Hello,
I am trying to plot functional data on a surface with nilearn like in this example: https://nilearn.github.io/auto_examples/01_plotting/plot_3d_map_to_surface_projection.html#sphx-glr-auto-examples-01-plotting-plot-3d-map-to-surface-projection-py
This part works fine (although I am wondering about the uncolored part of the mesh):
from nilearn import image
from nilearn import surface
from nilearn import plotting
%matplotlib inline
data_img = image.smooth_img(’/data/hippocampus/PWlearn_MEG/SourceCustomCode/Volwrite_Familiarity1_PWL-W.nii’, fwhm=0)
texture = surface.vol_to_surf(data_img,
‘/data/common/SPM8current/spm8/canonical/cortex_5124.surf.gii’)
fig = plotting.plot_surf_stat_map(stat_map = texture, surf_mesh = ‘/data/common/SPM8current/spm8/canonical/cortex_5124.surf.gii’, hemi=‘left’,
title=‘Surface left hemisphere’, colorbar=True)
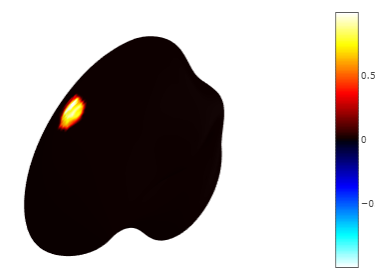
However, when I use a threshold only the functional data is plotted:
fig = plotting.plot_surf_stat_map(stat_map = texture, surf_mesh = ‘/data/common/SPM8current/spm8/canonical/cortex_5124.surf.gii’, hemi=‘left’,
colorbar=True, threshold = 0.6*max(texture))

I also tried to provide the surface image as bg_map but this produces an error:
ValueError Traceback (most recent call last)
in ()
1 fig = plotting.plot_surf_stat_map(stat_map = texture, surf_mesh = ‘/data/common/SPM8current/spm8/canonical/cortex_5124.surf.gii’, hemi=‘left’,
----> 2 colorbar=True, threshold = 0.6*max(texture), bg_map = ‘/data/common/SPM8current/spm8/canonical/cortex_5124.surf.gii’)
/data/home1/seisenha/.local/lib/python3.5/site-packages/nilearn/plotting/surf_plotting.py in plot_surf_stat_map(surf_mesh, stat_map, bg_map, hemi, view, threshold, alpha, vmax, cmap, colorbar, symmetric_cbar, bg_on_data, darkness, title, output_file, axes, figure, **kwargs)
417 alpha=alpha, bg_on_data=bg_on_data, darkness=1, vmax=vmax, vmin=vmin,
418 title=title, output_file=output_file, axes=axes, figure=figure,
–> 419 cbar_vmin=cbar_vmin, cbar_vmax=cbar_vmax, **kwargs)
420
421 return display
/data/home1/seisenha/.local/lib/python3.5/site-packages/nilearn/plotting/surf_plotting.py in plot_surf(surf_mesh, surf_map, bg_map, hemi, view, cmap, colorbar, avg_method, threshold, alpha, bg_on_data, darkness, vmin, vmax, cbar_vmin, cbar_vmax, title, output_file, axes, figure, **kwargs)
212 bg_data = load_surf_data(bg_map)
213 if bg_data.shape[0] != coords.shape[0]:
–> 214 raise ValueError('The bg_map does not have the same number ’
215 ‘of vertices as the mesh.’)
216 bg_faces = np.mean(bg_data[faces], axis=1)
ValueError: The bg_map does not have the same number of vertices as the mesh.
Also, view_surf is not working when I add the surf_map variable:
TypeError Traceback (most recent call last)
/data/home1/seisenha/Tools/anaconda3/lib/python3.5/site-packages/matplotlib/colors.py in to_rgba(c, alpha)
165 try:
–> 166 rgba = _colors_full_map.cache[c, alpha]
167 except (KeyError, TypeError): # Not in cache, or unhashable.
TypeError: unhashable type: ‘numpy.ndarray’
During handling of the above exception, another exception occurred:
ValueError Traceback (most recent call last)
in ()
----> 1 plotting.view_surf(surf_map = texture, surf_mesh=’/data/common/SPM8current/spm8/canonical/cortex_5124.surf.gii’)
/data/home1/seisenha/.local/lib/python3.5/site-packages/nilearn/plotting/html_surface.py in view_surf(surf_mesh, surf_map, bg_map, threshold, cmap, black_bg, vmax, symmetric_cmap)
261 surf_map=surf_map, surf_mesh=surf_mesh, threshold=threshold,
262 cmap=cmap, black_bg=black_bg, bg_map=bg_map,
–> 263 symmetric_cmap=symmetric_cmap, vmax=vmax)
264 return _fill_html_template(info, embed_js=True)
/data/home1/seisenha/.local/lib/python3.5/site-packages/nilearn/plotting/html_surface.py in one_mesh_info(surf_map, surf_mesh, threshold, cmap, black_bg, bg_map, symmetric_cmap, vmax)
54 info[‘vertexcolor_left’] = _get_vertexcolor(
55 surf_map, colors[‘cmap’], colors[‘norm’],
—> 56 colors[‘abs_threshold’], bg_map)
57 info[“cmin”], info[“cmax”] = float(colors[‘vmin’]), float(colors[‘vmax’])
58 info[‘black_bg’] = black_bg
/data/home1/seisenha/.local/lib/python3.5/site-packages/nilearn/plotting/html_surface.py in _get_vertexcolor(surf_map, cmap, norm, absolute_threshold, bg_map)
22 vertexcolor = cmap(norm(surf_map).data)
23 if absolute_threshold is None:
—> 24 return to_color_strings(vertexcolor)
25 if bg_map is None:
26 bg_map = np.ones(len(surf_map)) * .5
/data/home1/seisenha/.local/lib/python3.5/site-packages/nilearn/plotting/js_plotting_utils.py in to_color_strings(colors)
270 def to_color_strings(colors):
271 cmap = mpl.colors.ListedColormap(colors)
–> 272 colors = cmap(np.arange(cmap.N))[:, :3]
273 colors = np.asarray(colors * 255, dtype=‘uint8’)
274 colors = [’#{:02x}{:02x}{:02x}’.format(*row) for row in colors]
/data/home1/seisenha/Tools/anaconda3/lib/python3.5/site-packages/matplotlib/colors.py in call(self, X, alpha, bytes)
480 # See class docstring for arg/kwarg documentation.
481 if not self._isinit:
–> 482 self._init()
483 mask_bad = None
484 if not cbook.iterable(X):
/data/home1/seisenha/Tools/anaconda3/lib/python3.5/site-packages/matplotlib/colors.py in _init(self)
831
832 def _init(self):
–> 833 rgba = colorConverter.to_rgba_array(self.colors)
834 self._lut = np.zeros((self.N + 3, 4), float)
835 self._lut[:-3] = rgba
/data/home1/seisenha/Tools/anaconda3/lib/python3.5/site-packages/matplotlib/colors.py in to_rgba_array(arg, alpha)
351 then an empty array will be returned. Same for an empty list.
352 “”"
–> 353 return to_rgba_array(arg, alpha)
354
355
/data/home1/seisenha/Tools/anaconda3/lib/python3.5/site-packages/matplotlib/colors.py in to_rgba_array(c, alpha)
265 result = np.empty((len©, 4), float)
266 for i, cc in enumerate©:
–> 267 result[i] = to_rgba(cc, alpha)
268 return result
269
/data/home1/seisenha/Tools/anaconda3/lib/python3.5/site-packages/matplotlib/colors.py in to_rgba(c, alpha)
166 rgba = _colors_full_map.cache[c, alpha]
167 except (KeyError, TypeError): # Not in cache, or unhashable.
–> 168 rgba = _to_rgba_no_colorcycle(c, alpha)
169 try:
170 _colors_full_map.cache[c, alpha] = rgba
/data/home1/seisenha/Tools/anaconda3/lib/python3.5/site-packages/matplotlib/colors.py in _to_rgba_no_colorcycle(c, alpha)
217 # float)andnp.array(…).astype(float)` all convert “0.5” to 0.5.
218 # Test dimensionality to reject single floats.
–> 219 raise ValueError(“Invalid RGBA argument: {!r}”.format(orig_c))
220 # Return a tuple to prevent the cached value from being modified.
221 c = tuple(c.astype(float))
ValueError: Invalid RGBA argument: array([[0.05189484, 0. , 0. , 1. ]])
Thank you very much!
Susanne