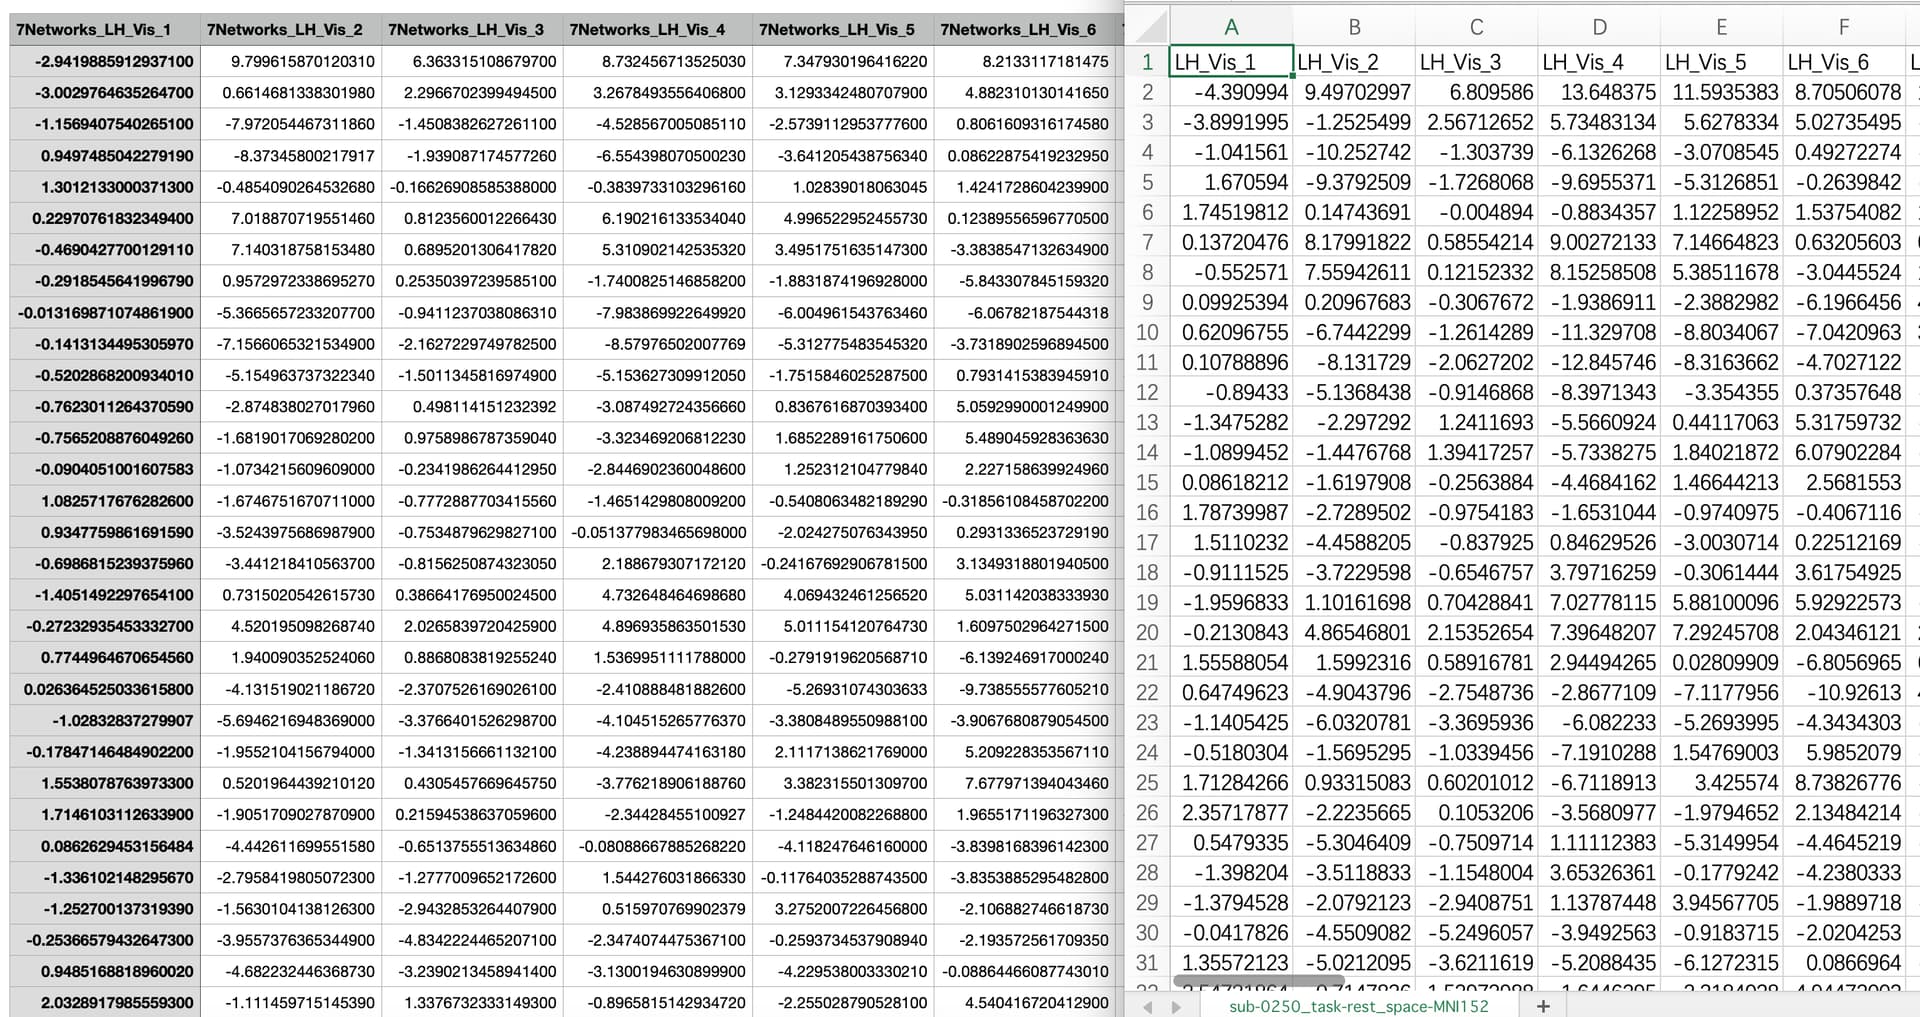
I extract time series from (code below):
~/func/sub-0250_task-rest_space-MNI152NLin2009cAsym_res-2_desc-denoised_bold.nii.gz
and
sub-0250_task-rest_space-MNI152NLin2009cAsym_res-2_desc-denoisedSmoothed_bold.nii.gz.
both of the extracted time series is different from the one xcp-d generated: sub-0250_task-rest_space-MNI152NLin2009cAsym_seg-4S156Parcels_stat-mean_timeseries.tsv.
so I want to ask what might cause the difference.
Command used (and if a helper script was used, a link to the helper script or the command generated):
 # Schaefer atlas (100 regions)
atlas_filename = 'Schaefer2018_100Parcels_7Networks_order_FSLMNI152_2mm.nii.gz'
schaefer = input_data.NiftiLabelsMasker(atlas_filename)

# ROI labels
label_file = 'Schaefer2018_100Parcels_7Networks_order.txt'

timeseries = schaefer.fit_transform(denoised_data, confounds=None)

        # Filtering data
        timeseries = signal.clean(timeseries,
                                   t_r=t_r,
                                   detrend=False,
                                   standardize=False,
                                   )

        # Check the shape of the extracted timeseries
        print(f'Timeseries shape for {sub}: {timeseries.shape}')

        # Convert to DataFrame and save as CSV with appropriate column names
        df_timeseries = pd.DataFrame(timeseries, columns=roi_labels[:timeseries.shape[1]])
        df_timeseries.to_csv(f'{out_dir}/{sub}_task-rest_space-MNI152NLin2009cAsym_seg-Schaefer100-denoisedSmoothed_timeseries.csv', index=False)
+1 for @smeisler’s points. Here are a few other things about how XCP-D does the parcellation with NIfTIs.
The parcellated time series come from the unsmoothed data, so you don’t need to compare to parcellating the smoothed data.
Please make sure to include the brain mask here as mask_img. XCP-D also calculates the coverage (% of voxels in the original ROI that are not masked out by the brain mask) and replaces the time series of any nodes with coverage below the threshold (--min-coverage) with NaNs.
Other than that, the only special thing XCP-D does is it checks the index of parcels in the atlas (e.g., what the values in the atlas are) against the labels TSV file, and fills in any nodes that might be missing from the atlas (e.g., due to warping it into the same space/resolution as the BOLD data) with NaNs in the extracted time series file.
I didn’t apply another filtering after XCP_D, the signal.clean didn’t do anything as tsalo pointed.
I know XCP_D bundles their atlases with subcoritcal regions (I used 156 rois), but I think the ROIs of cortical regions (100 rois) of xcp-d and the atlas I use should be the same given they have the same labels (first row of excel)(and because I thought I was using the same atlas XCP_D use).
if I applied smooth, I still need to manually extract time series from the smoothed data right?
'Please make sure to include the brain mask here as mask_img . 'I do not understand what you mean here.
Thank you for the detailed explanation of what XCP-D do. Is it possible to add the Schaefer (100 - 1000 parcels) atlas options in the XCP-D? so that we can use the time series of cortical regions directly.
As a general rule, you probably don’t want to parcellate smoothed data. Parcellation is already “smoothing” the data by averaging it over voxels. That said, if you really want parcellated time series from smoothed data, you would want to extract the time series from the smoothed file.
NiftiLabelsMasker accepts a mask_img input that specifies which voxels in the data/atlas to actually use. Often, voxels at the top or bottom of the brain will be cut off due to a limited FOV, and you don’t want to have voxels with all zeros contaminating the average time series across a given parcel, so if you include the brain mask you’ll ignore those voxels.
You can just use the 4S atlases. The cortical elements of those atlases are the Schaefer atlases. Just drop the subcortical nodes from the time series files.
I also got my atlas from the CBIG link, so I think I used the same atlas as xcp-d.
Thank you for the smoothing and mask_img advice.
I will use the 4S atlases.
And just want to confirm:
Time Series Standardization: In the documentation and reports, it is mentioned that the BOLD time series are mean-centered and standard deviation-normalized for ALFF computation. Is this standardization also applied to the output time series and used for functional connectivity analysis?
Fisher Transformation of Functional Connectivity: The pairwise functional connectivity is reported as Pearson’s correlation (sub-0250_task-rest_space-MNI152NLin2009cAsym_seg-4S156Parcels_stat-pearsoncorrelation_relmat.tsv).
I would like to confirm if these correlation values have been Fisher z-transformed. Because I see some discussions here: Fisher-transform connectivity matrices by smeisler · Pull Request #901 · PennLINC/xcp_d · GitHub