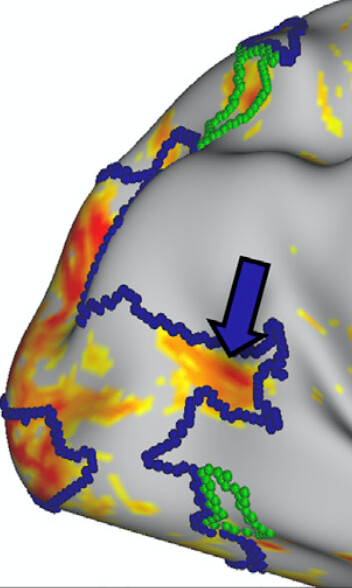
Often see this kind of delineated boundary of ROI overlaid on brain activations on cortical surface, does anyone know if there’re open-sourced tools to do this kind of visualization? (e.g. in HCP grayordinate system)
You mean Workbench? You can create boundary line on the surface.
https://www.humanconnectome.org/software/workbench-command
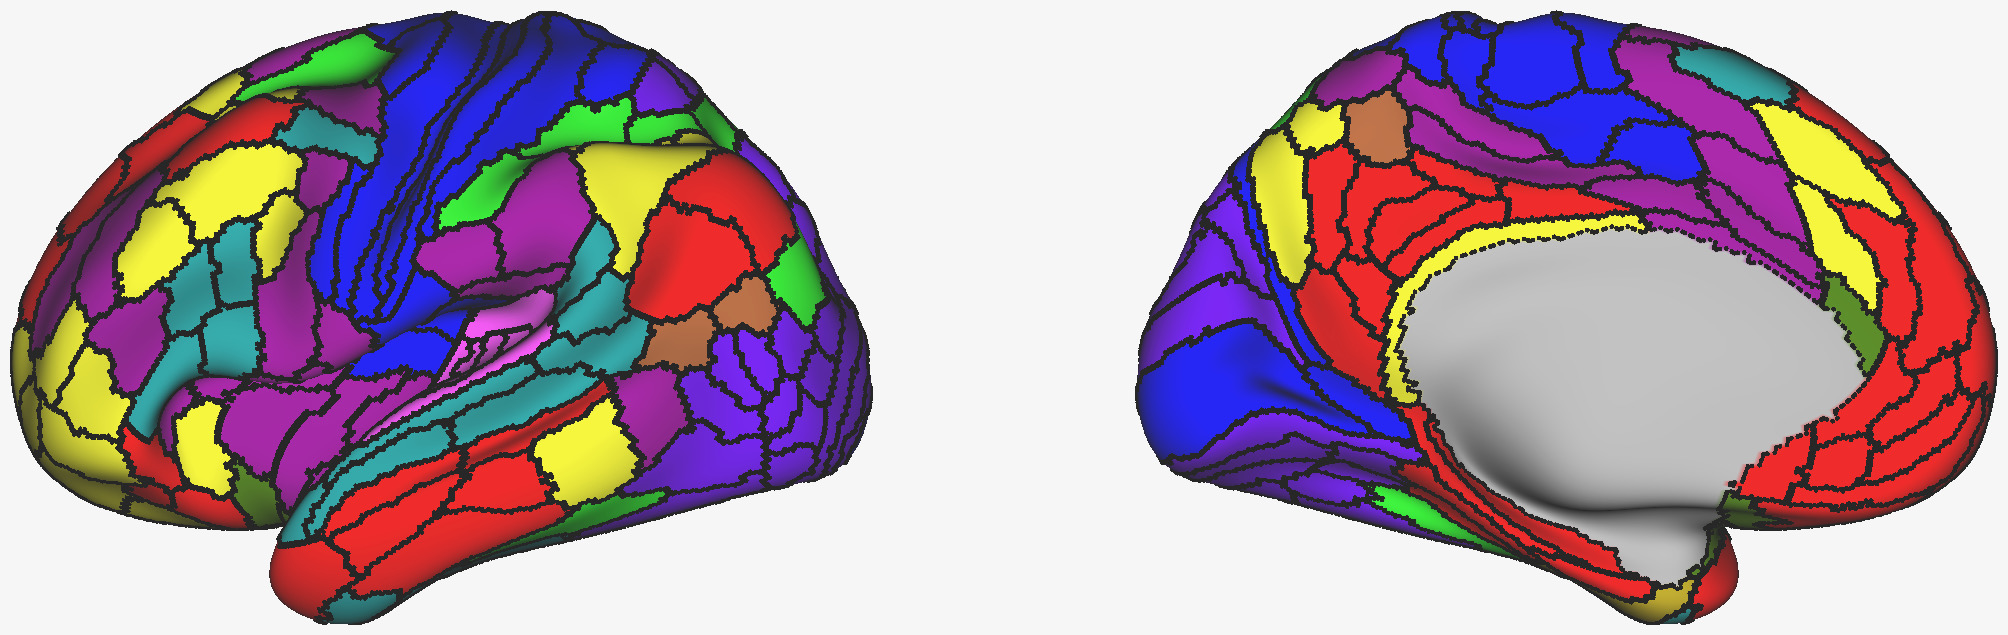
Here is a plot of atlas with boundary.
1 Like
Or Nilearn:
http://nilearn.github.io/auto_examples/01_plotting/plot_3d_map_to_surface_projection.html#sphx-glr-auto-examples-01-plotting-plot-3d-map-to-surface-projection-py
Best,
2 Likes
For Workbench examples, try MVPA Meanderings: overlaying in Connectome Workbench 1.4.2.
2 Likes
Thank you guys, these are very helpful.