Dear Neurostars Community,
I’m struggling with trying to find out what types of fieldmaps I have from some data in the lab…
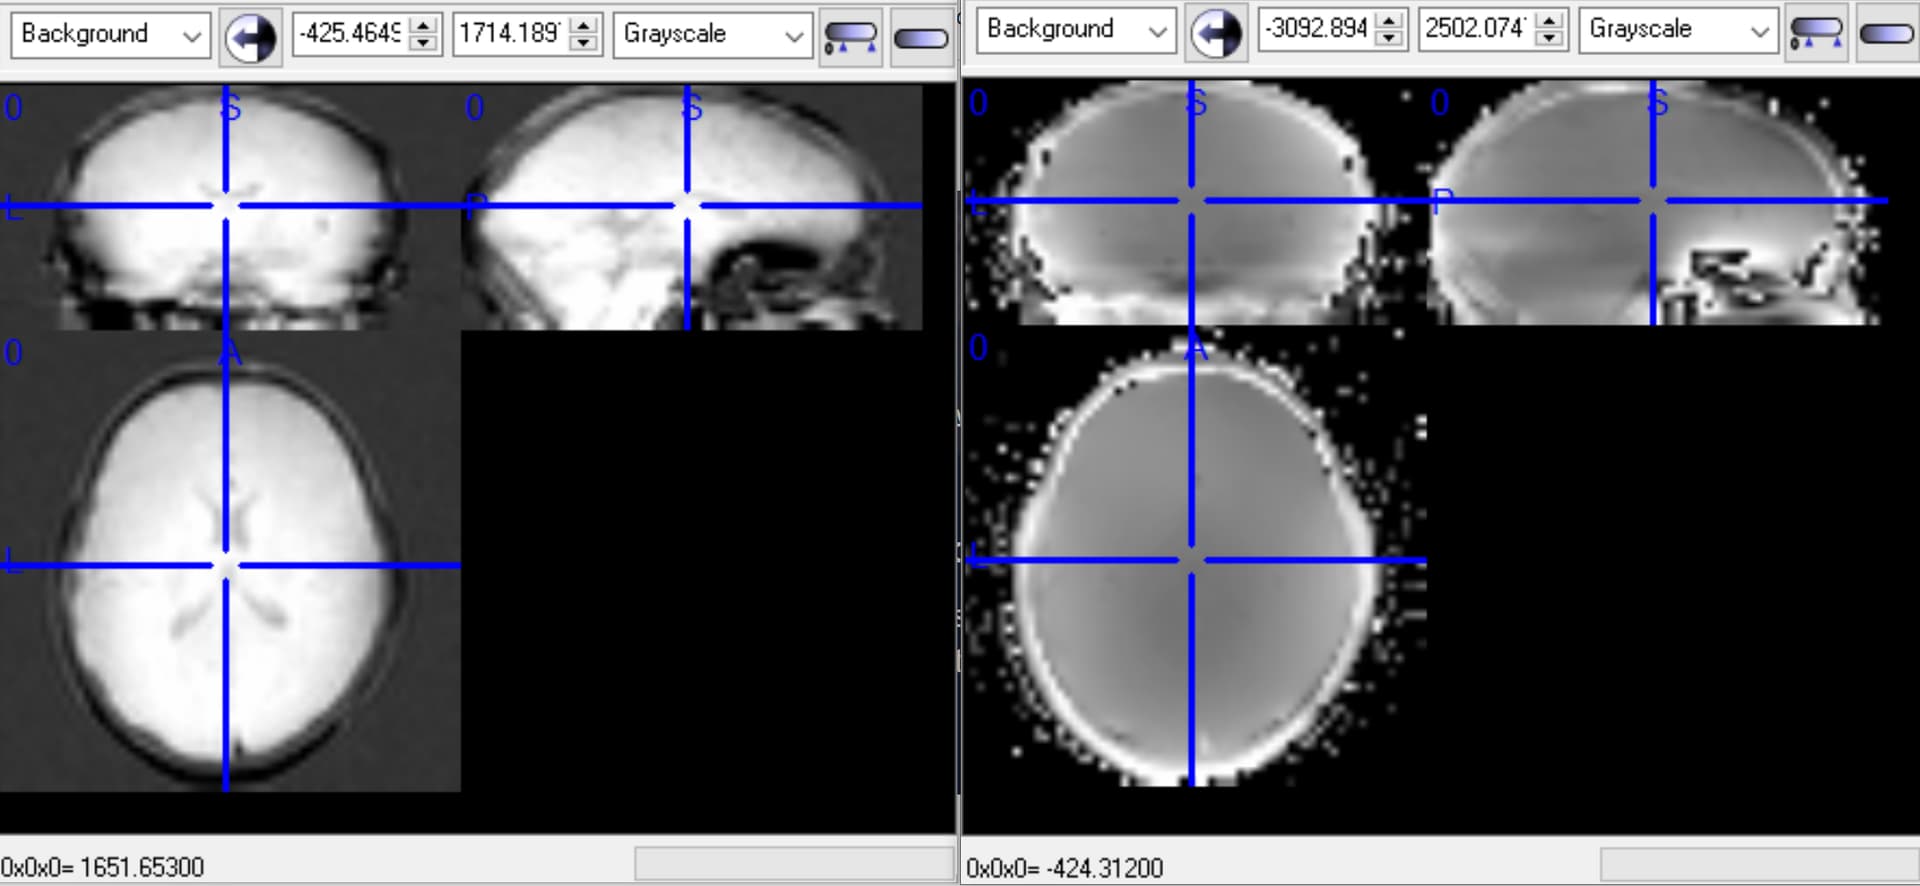
The data were collected some time ago and Dicom format is not available – only Nifti and REC/PAR. When looking at the Nifti files, I noticed that the fieldmaps from some subjects followed the same pattern, which I labeled as magnitude and phase images. An exemplary pair of images is the following, in which magnitude would be in the image on the left and phase the one on the right:
After making the required alterations in the sidecar files, fMRIprep ran susceptibility correction distortion successfully and the results were satisfactory. This is the “case 2” of Types of fieldmaps in Magnetic Resonance Imaging - Brain Imaging Data Structure v1.9.0 (bids-specification.readthedocs.io) So far so good!
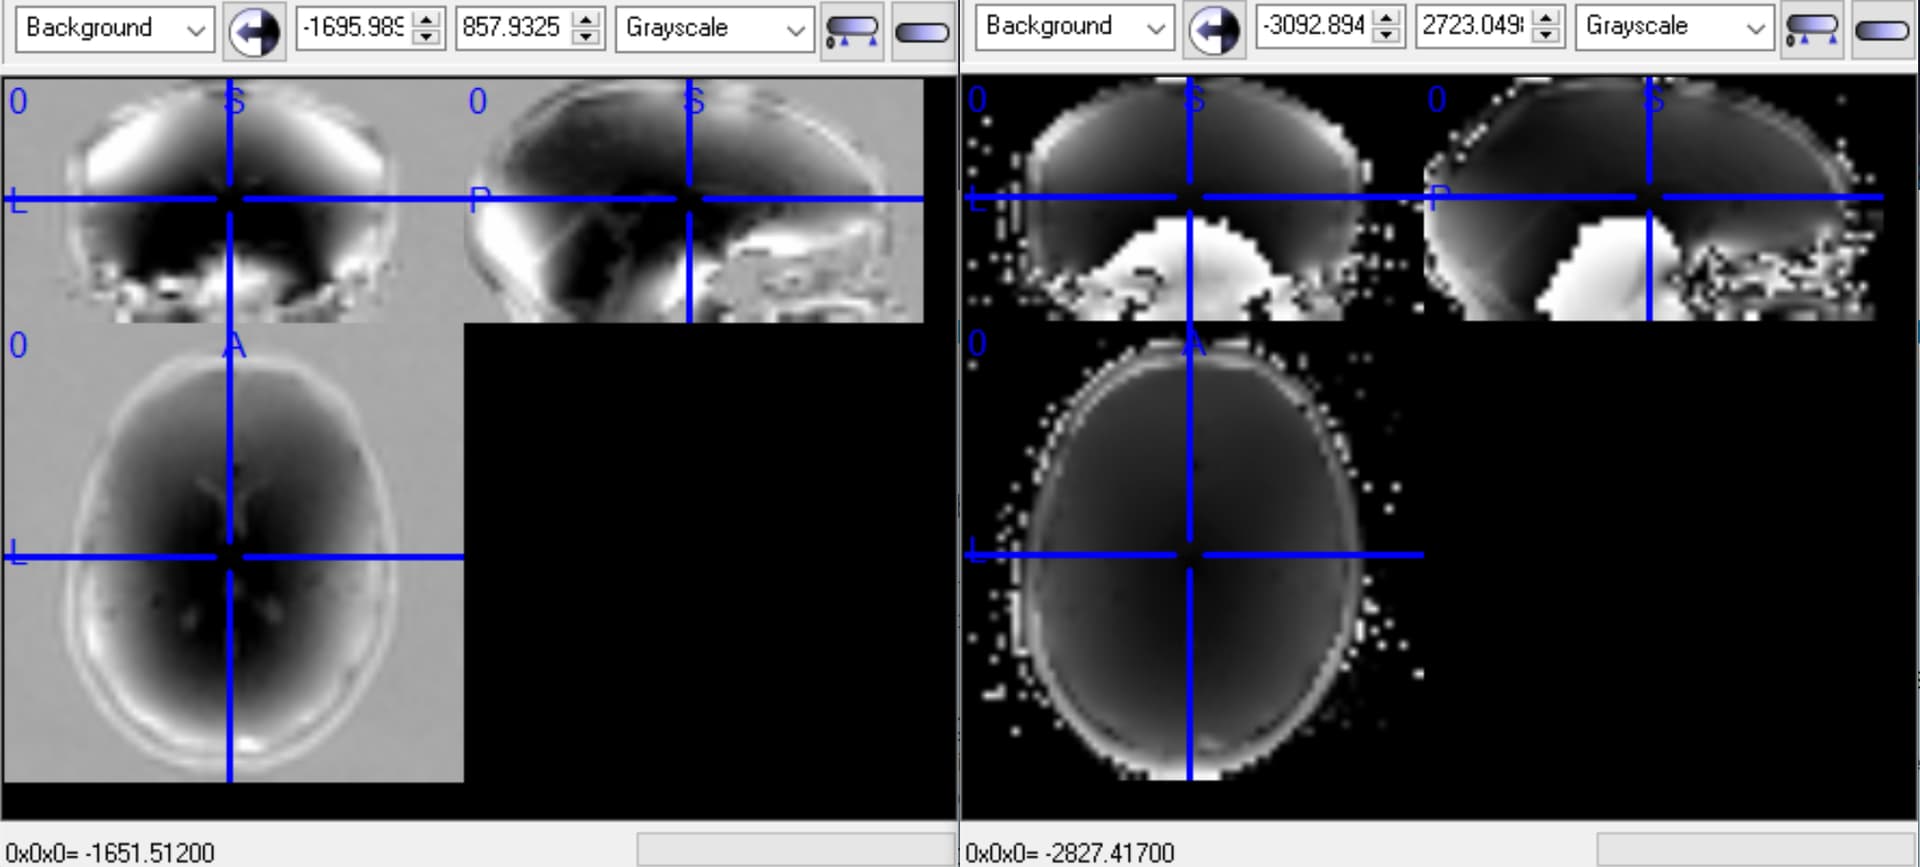
However, I was intrigued that, for some other subjects, the pair of images looked like the following:
which I don’t know what types of fieldmaps they should be. Classifying then as magnitude and phase, as before, led to bad results (i.e., the correction didn’t make sense, looking at the final fMRIprep report). It’s somehow intriguing to me that, the image on the left is mainly comprised of negative results and it’s almost like a negative of the magnitude image I showed earlier…
Also, it was baffled by the fact that, apparently, nothing was intentionally done when acquiring the images to obtain these different results. I wonder what led the scanner to produce those images.
Would anyone have a clue about what the second pair of images would be? Any input is highly appreciated. Many thanks in advance!
Cheers,
Gustavo
@drmclem Dear Matthew Clemence, I saw in another post that you are familiar with the way that Philips scanners deal with fieldmap acquisitions. May I ask your opinion about this issue here? Thank you in advance.
Hi
If the user is using the product b0 mapping option then you should end up with two images, a magnitude and a processed b0 map (fully phase corrected and scaled to the offset in Hz of the resonant frequency). In DICOM they will be labelled as type M and type B0 respectively or if you have the par-rec - they will be type 2 and type 5 respectively.
Your second set of images does not match this and look as if the b0 map option was not used - the users do have freedom to change the generated images (so for example to collect the uncorrected phase map as well as the b0 map) but these do look very incorrect for homogenity - my guess is that you have images R and P and no b0 map in the second set - you should be able to look in the par file and check the image types (my guess would be you will see 0 and 3)
Matthew
Hi Matthew,
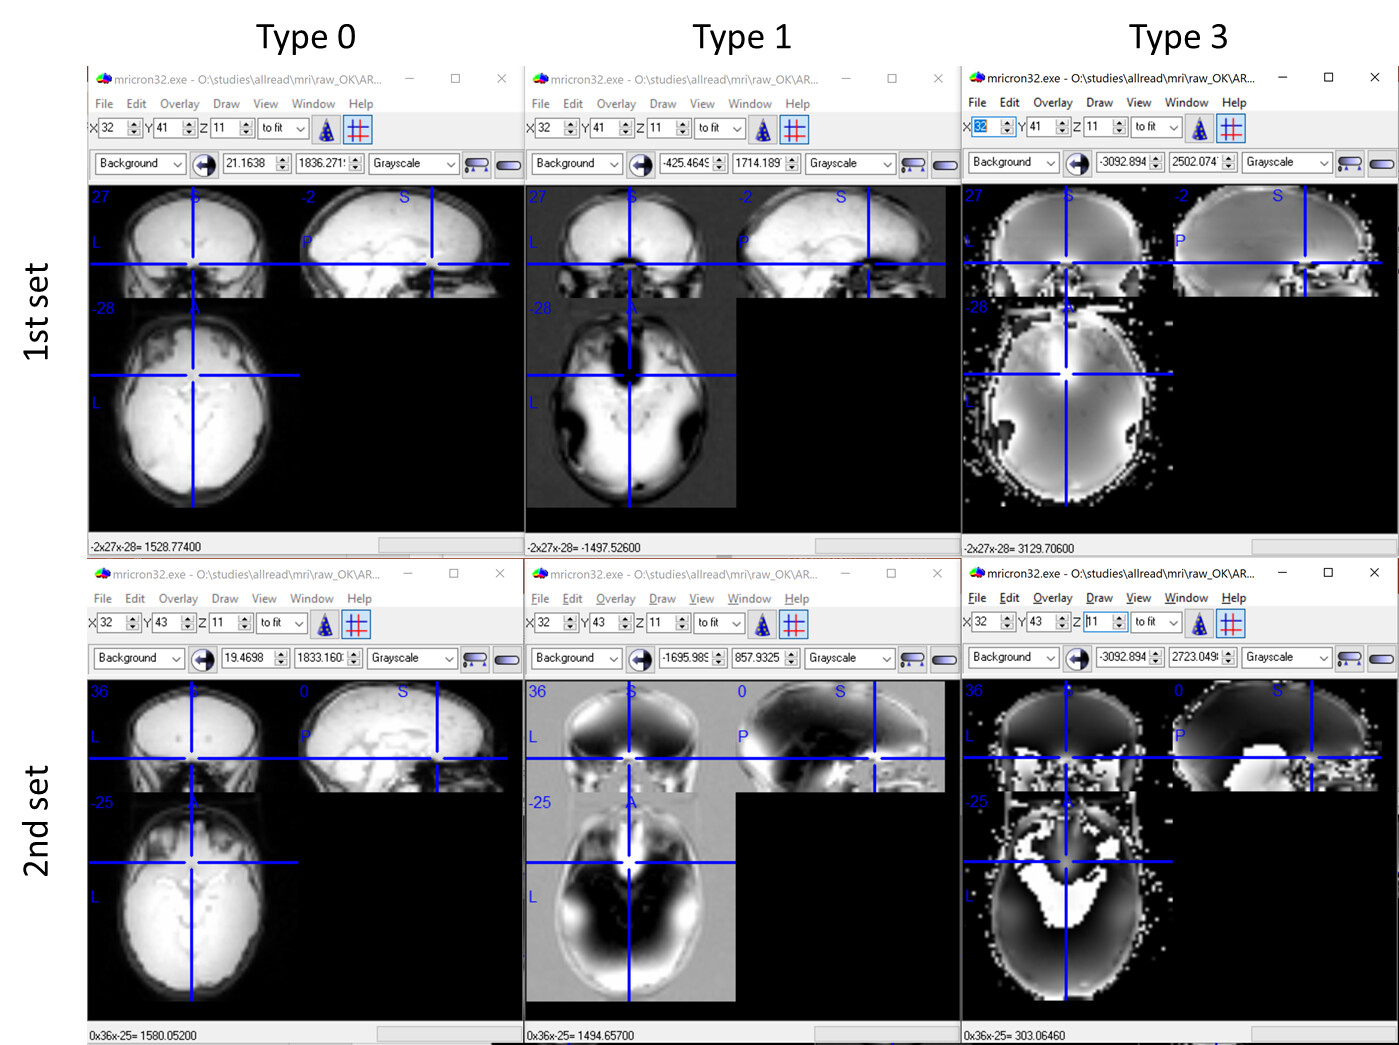
Thank you for your swift response. Sorry, there’s also a third image… Let me post the complete sets here:
We unfortunately don’t have the DICOM files, but the .par files say that we have type 0, 1, and 3 images. This is the case for both sets.
My interpretation was that type 0 is the processed b0 map (left), type 1 is magnitude (center), and type 3 is phase (right). This seems to be okay with the first set of images, but not the second one. It’s somewhat intriguing to me that the type 1 image in the second set looks a kind of an inverse of what was computed for the type 1 image in the first set…
It’s intriguing to me that it seems to be an intermittent issue, coming from the same sequence. Sometimes the acquisitions are similar to the first set, sometimes they are similar to the second set…
Any ideas of what is going on?
Cheers,
Gustavo
Hi - I’m afraid without the DICOM or the Examcard its going to be difficult to work out what has gone on here - it looks as if these sets are not a standard product b0 map and may have been collected with research versions as the image types do not seem consistent (0, 1 and 3 are uncorrected Real, IMaginary and Phase respectively). Matthew
Many thanks, @drmclem. I’ll see if I can find out what reproduces this inconsistency in the scanner. In this case, I’ll inform you.
I would like to update my post, as I found a satisfactory solution to my question. After some research, I am convinced that, for both 1st and 2nd sets in the figure above, type 0 is magnitude, type 1 is real, type 3 is phase.
To arrive at that conclusion, I first assumed that type 0 image was actually magnitude (it doesn’t have negative values). And I also assumed that type 3 image was phase.
A complex number z is expressed, using the polar form equation, by:
z = r (cos(phi) + i * sin(phi))
in which r is magnitude and phi is the phase. Therefore, the real part is expressed by:
real = r * cos(phi)
Using the voxel values from my images and plugging them into the equation above (phi is the value from the phase image divided by 1000 – I saw somewhere that the phase values are expressed in radians per milisecond, so the conversion is necessary to keep the values in rad/s), I get values that are fairly close to the ones in the type 1 image. Therefore, I conclude that the image shows real numbers. The fact that for one set the real image (type 1) is rather positive and another set is rather negative just depends on the estimated values for magnitude and phase, I guess.
After using type 0 and type 3 images for susceptibility distortion correction, in either fMRIprep or SPM, I got satisfactory results.