Summary of what happened:
Hi everyone, I am currently using FSL and AFNI to do the bias field correction, since I am not familiar with this topic, if anyone can give me feedback on my analysis pipeline then I really appreciate it. I followed the instructions given by the FSL and AFNI strictly, but I was worried that I would make a mistake.
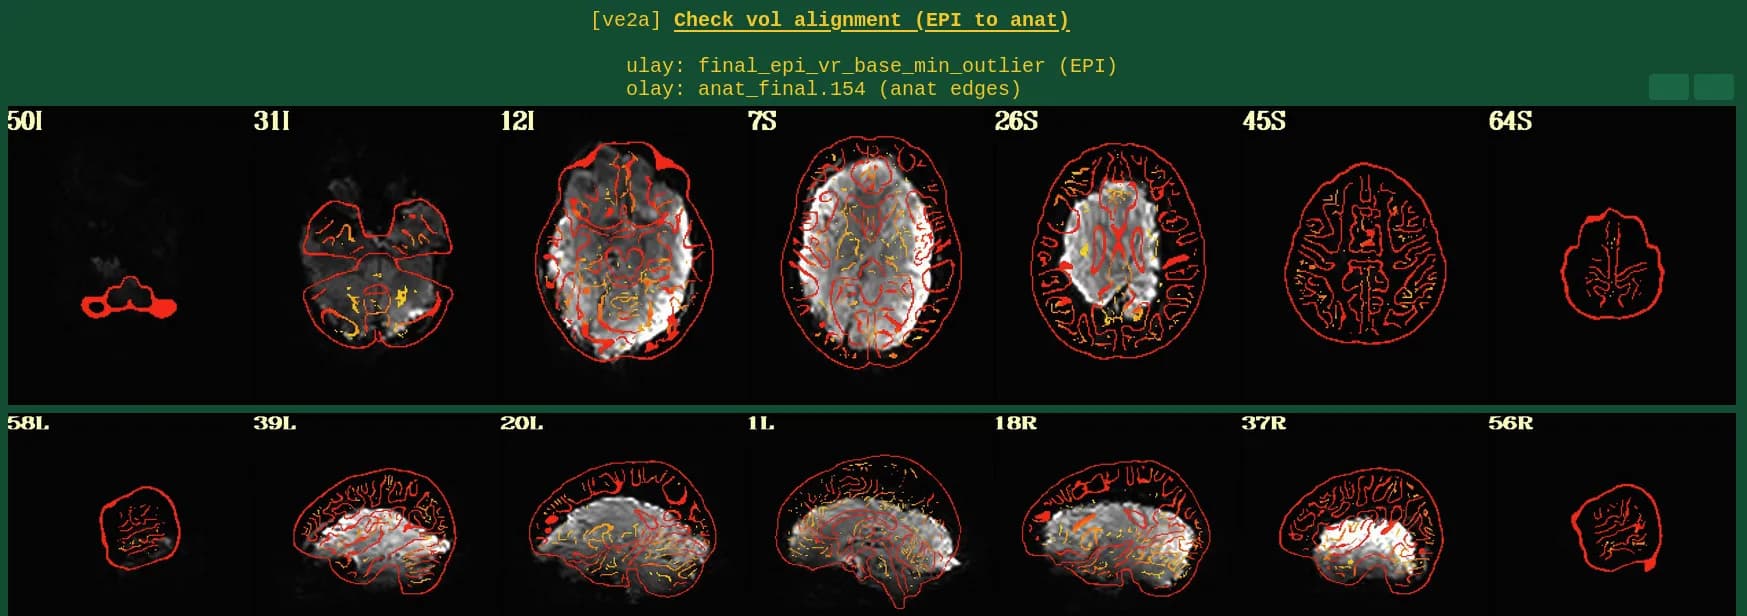
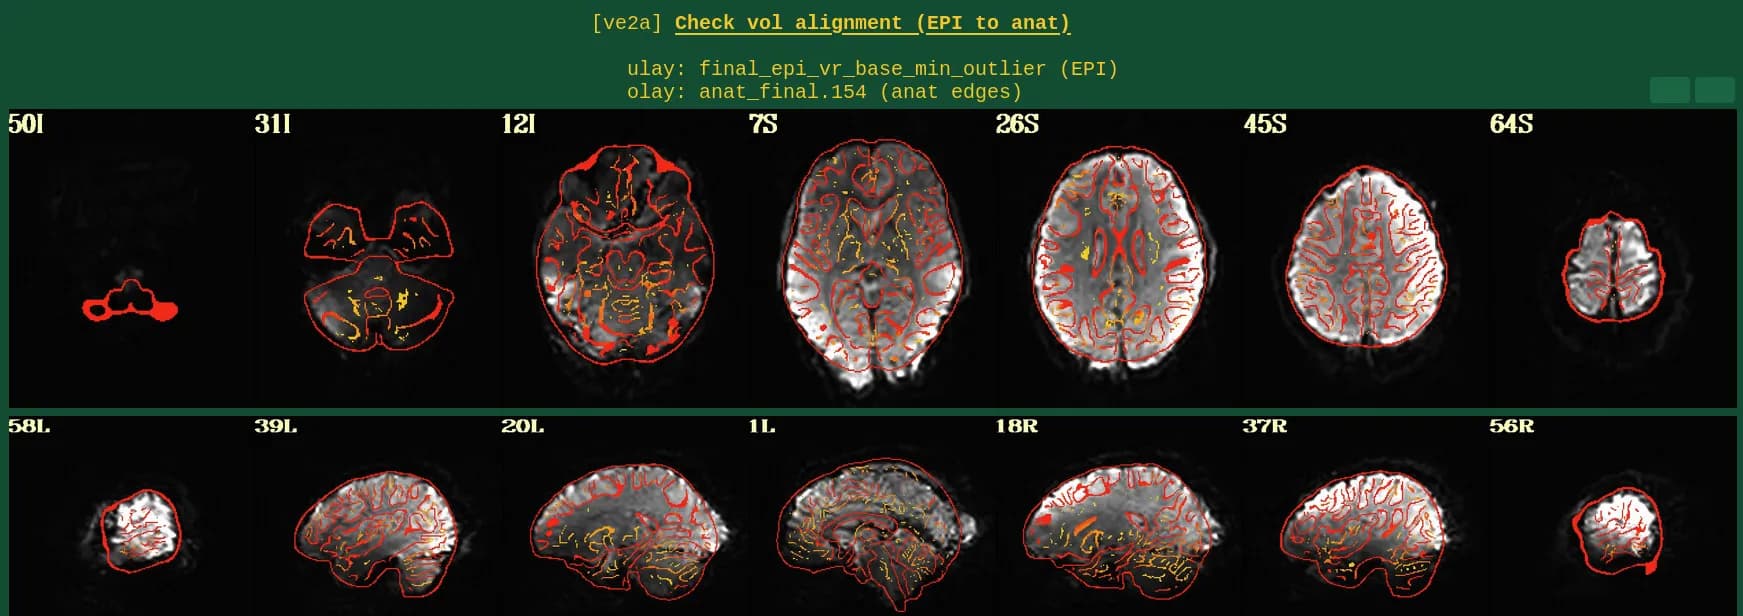
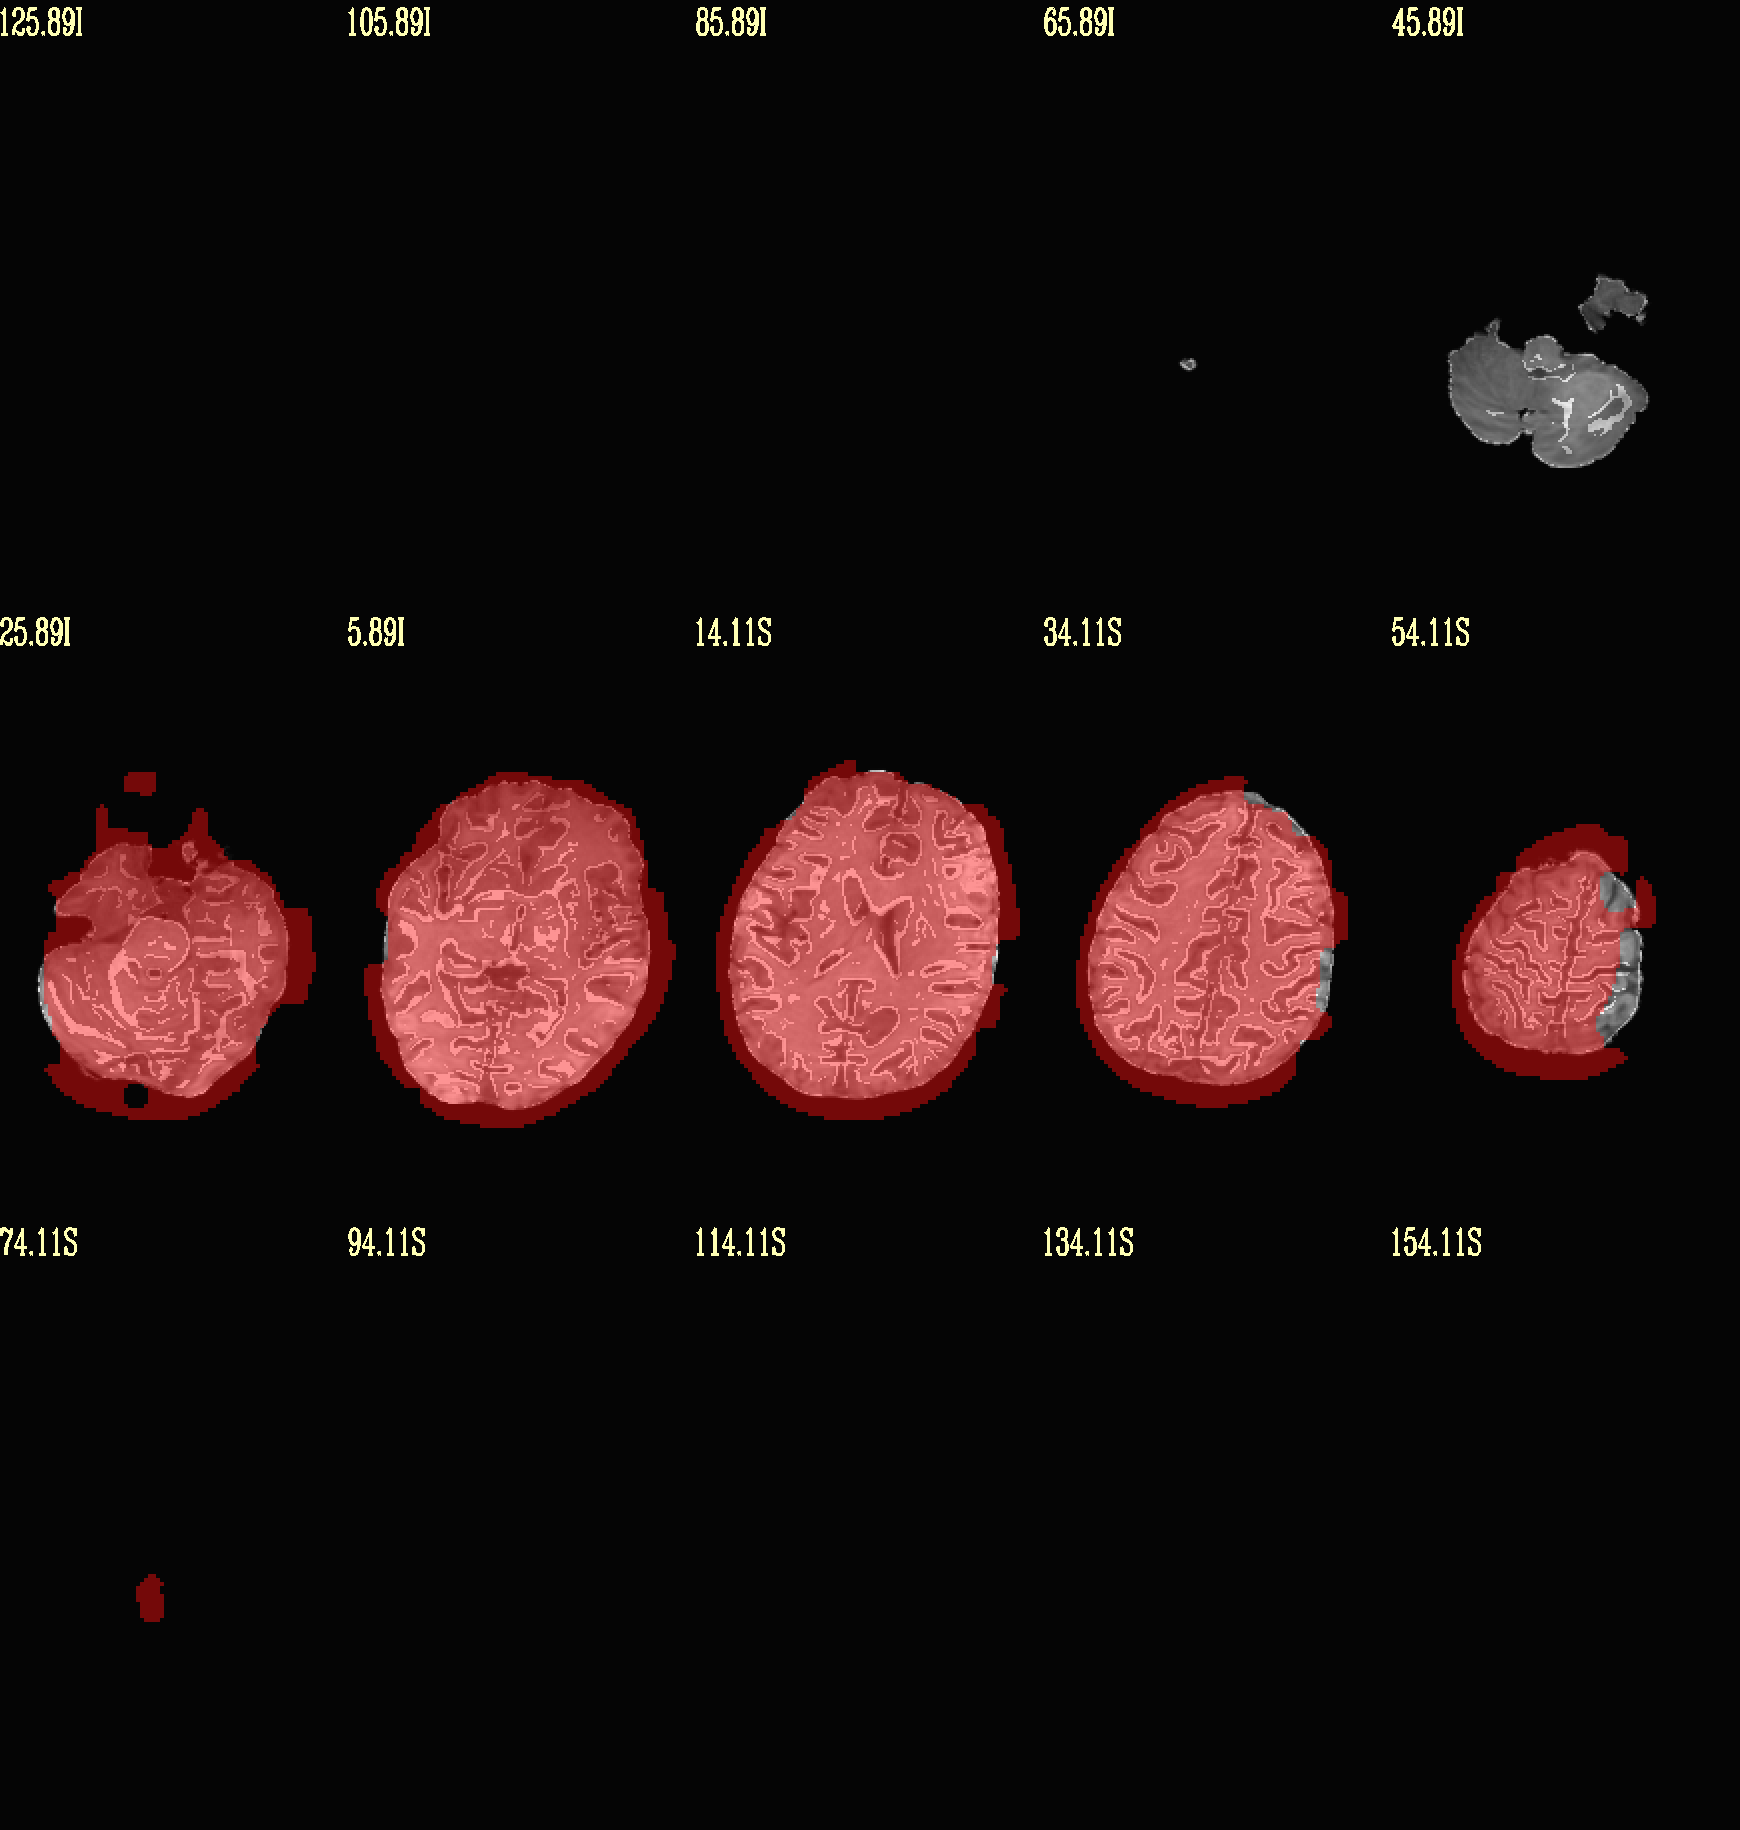
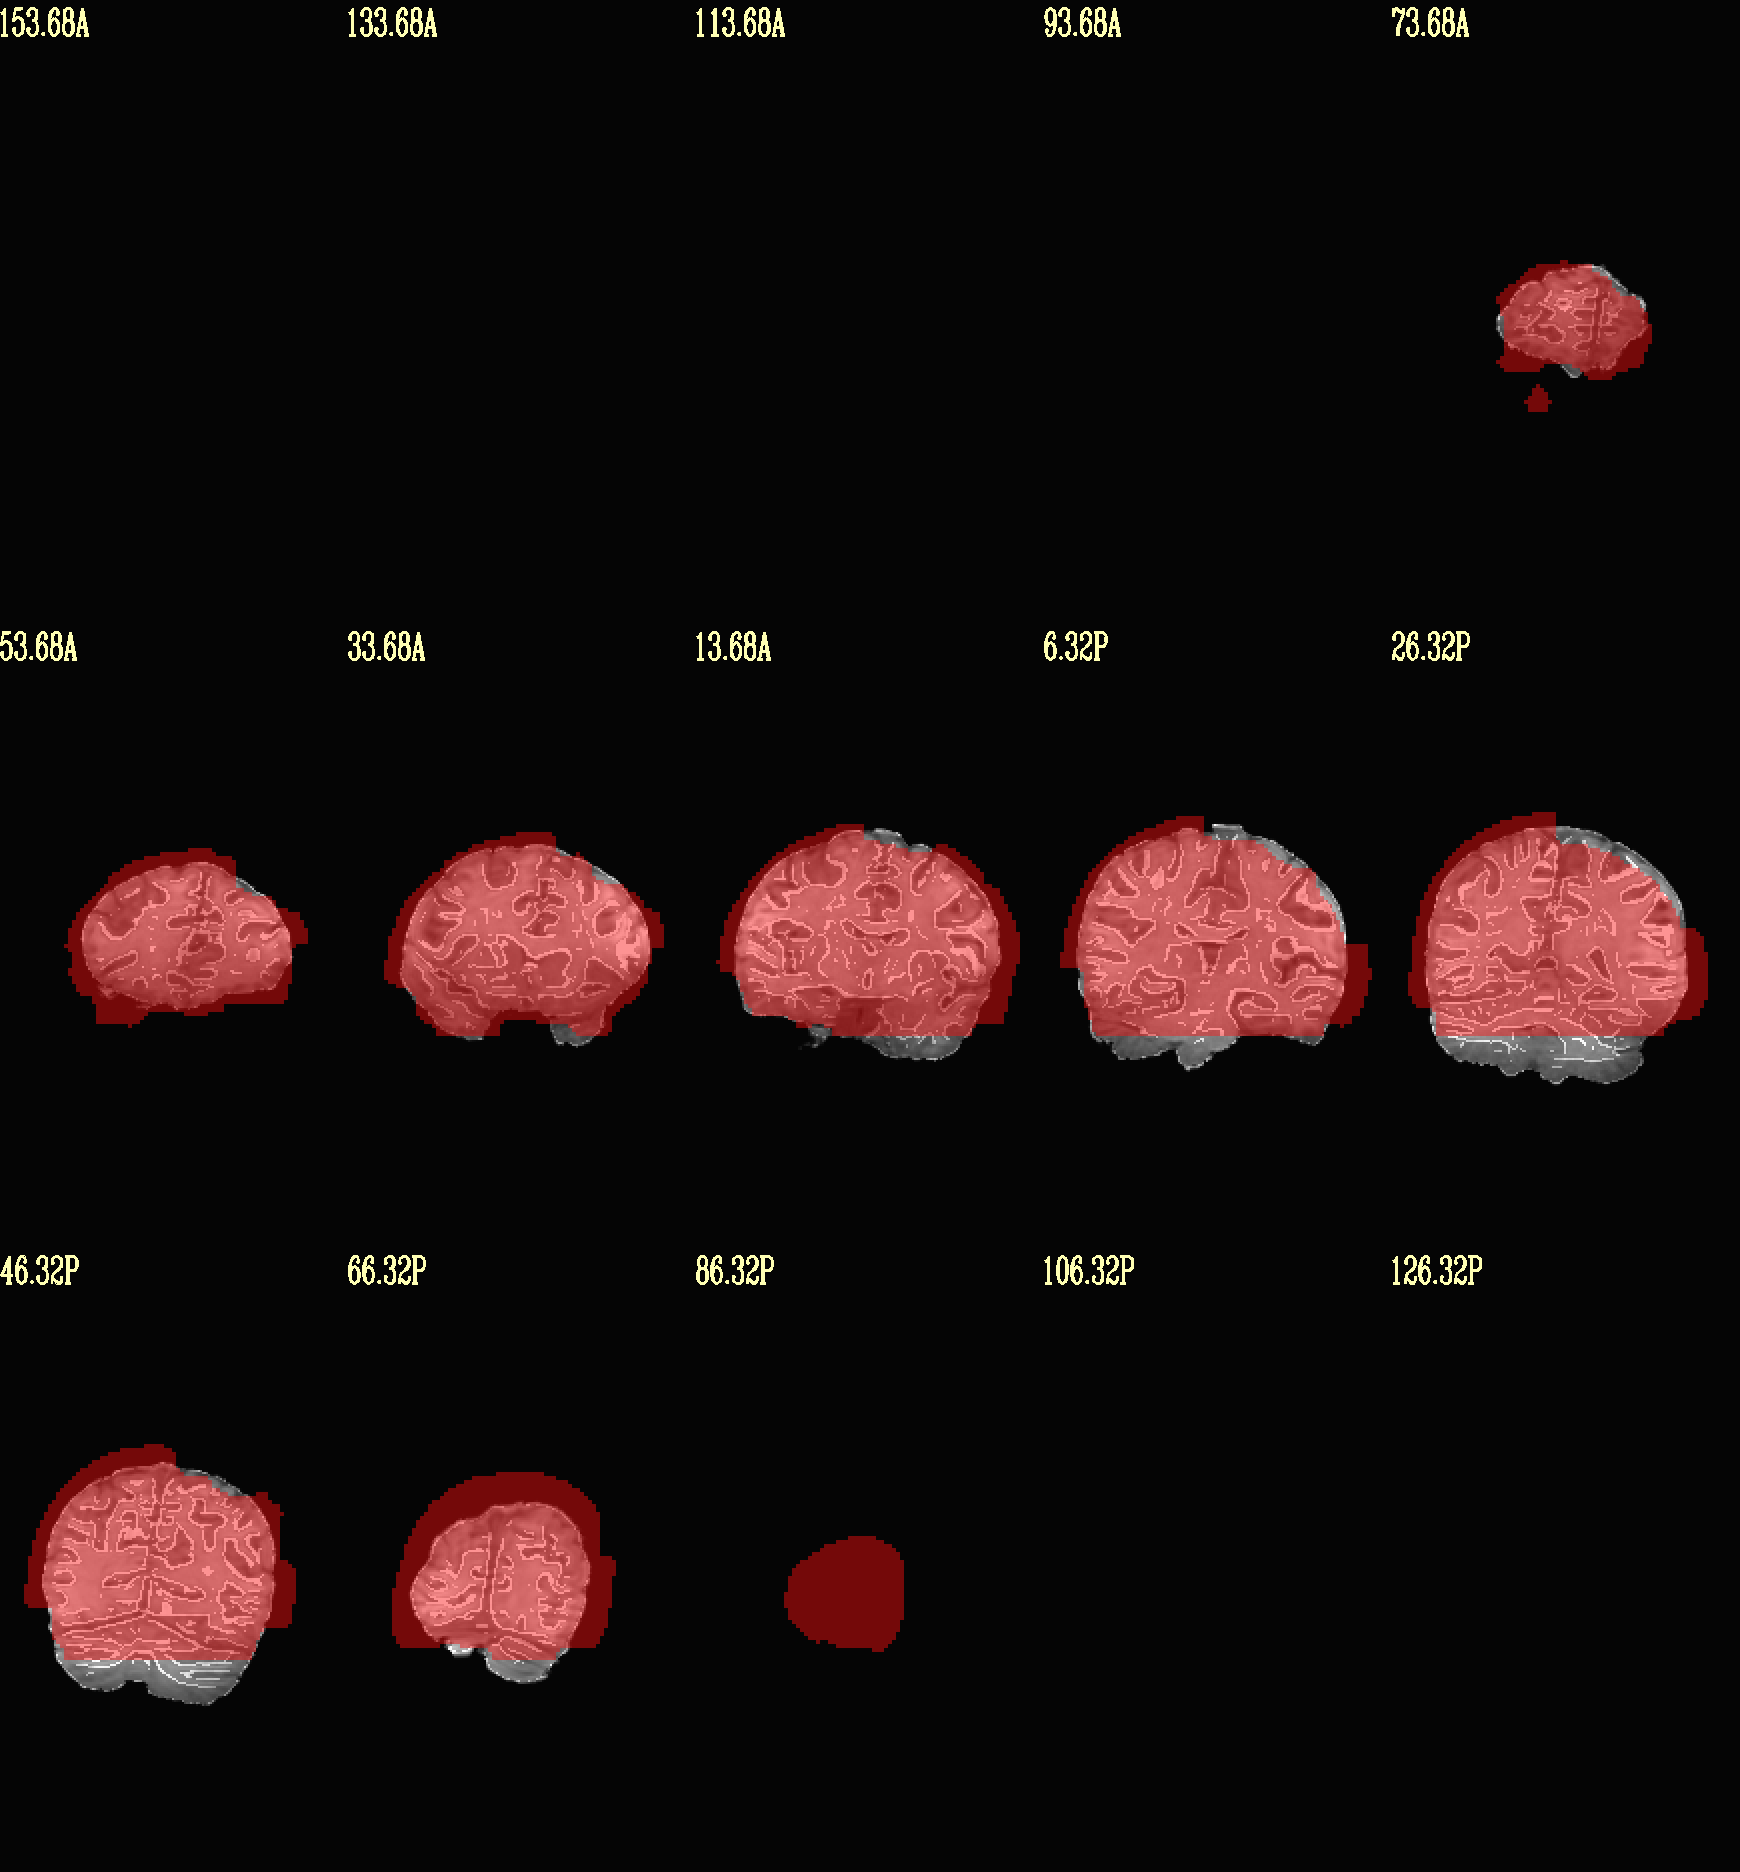
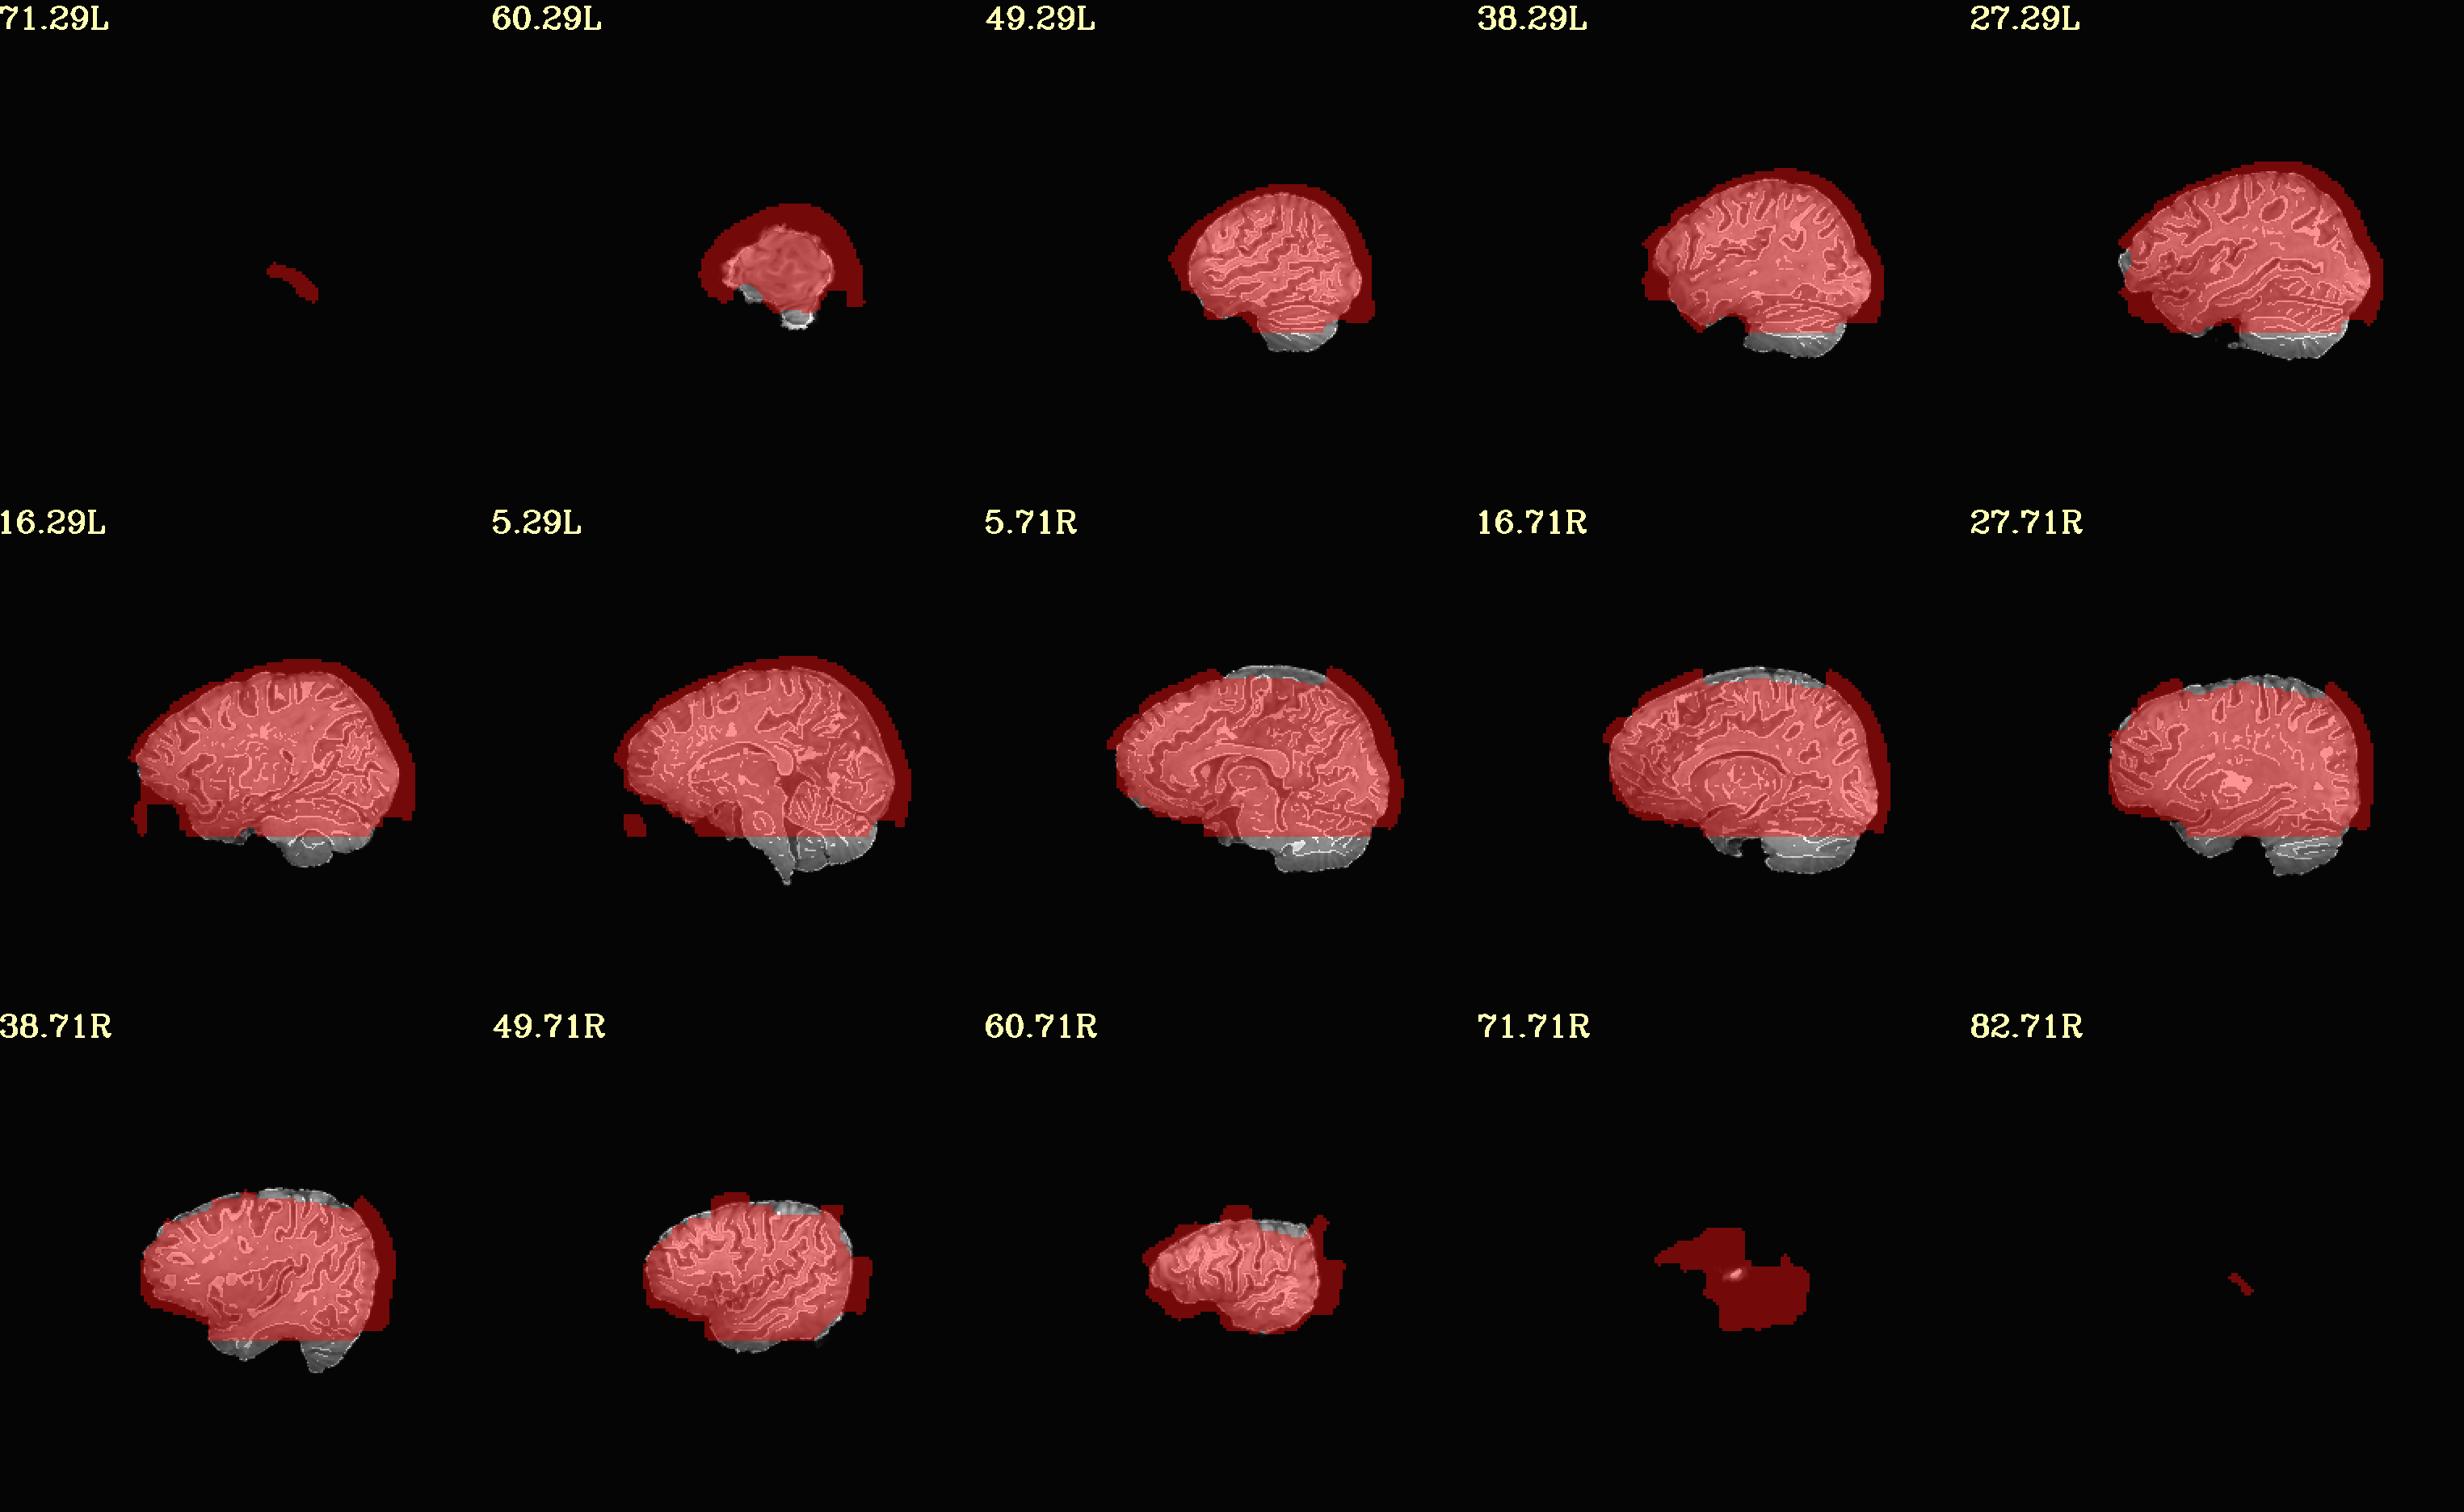
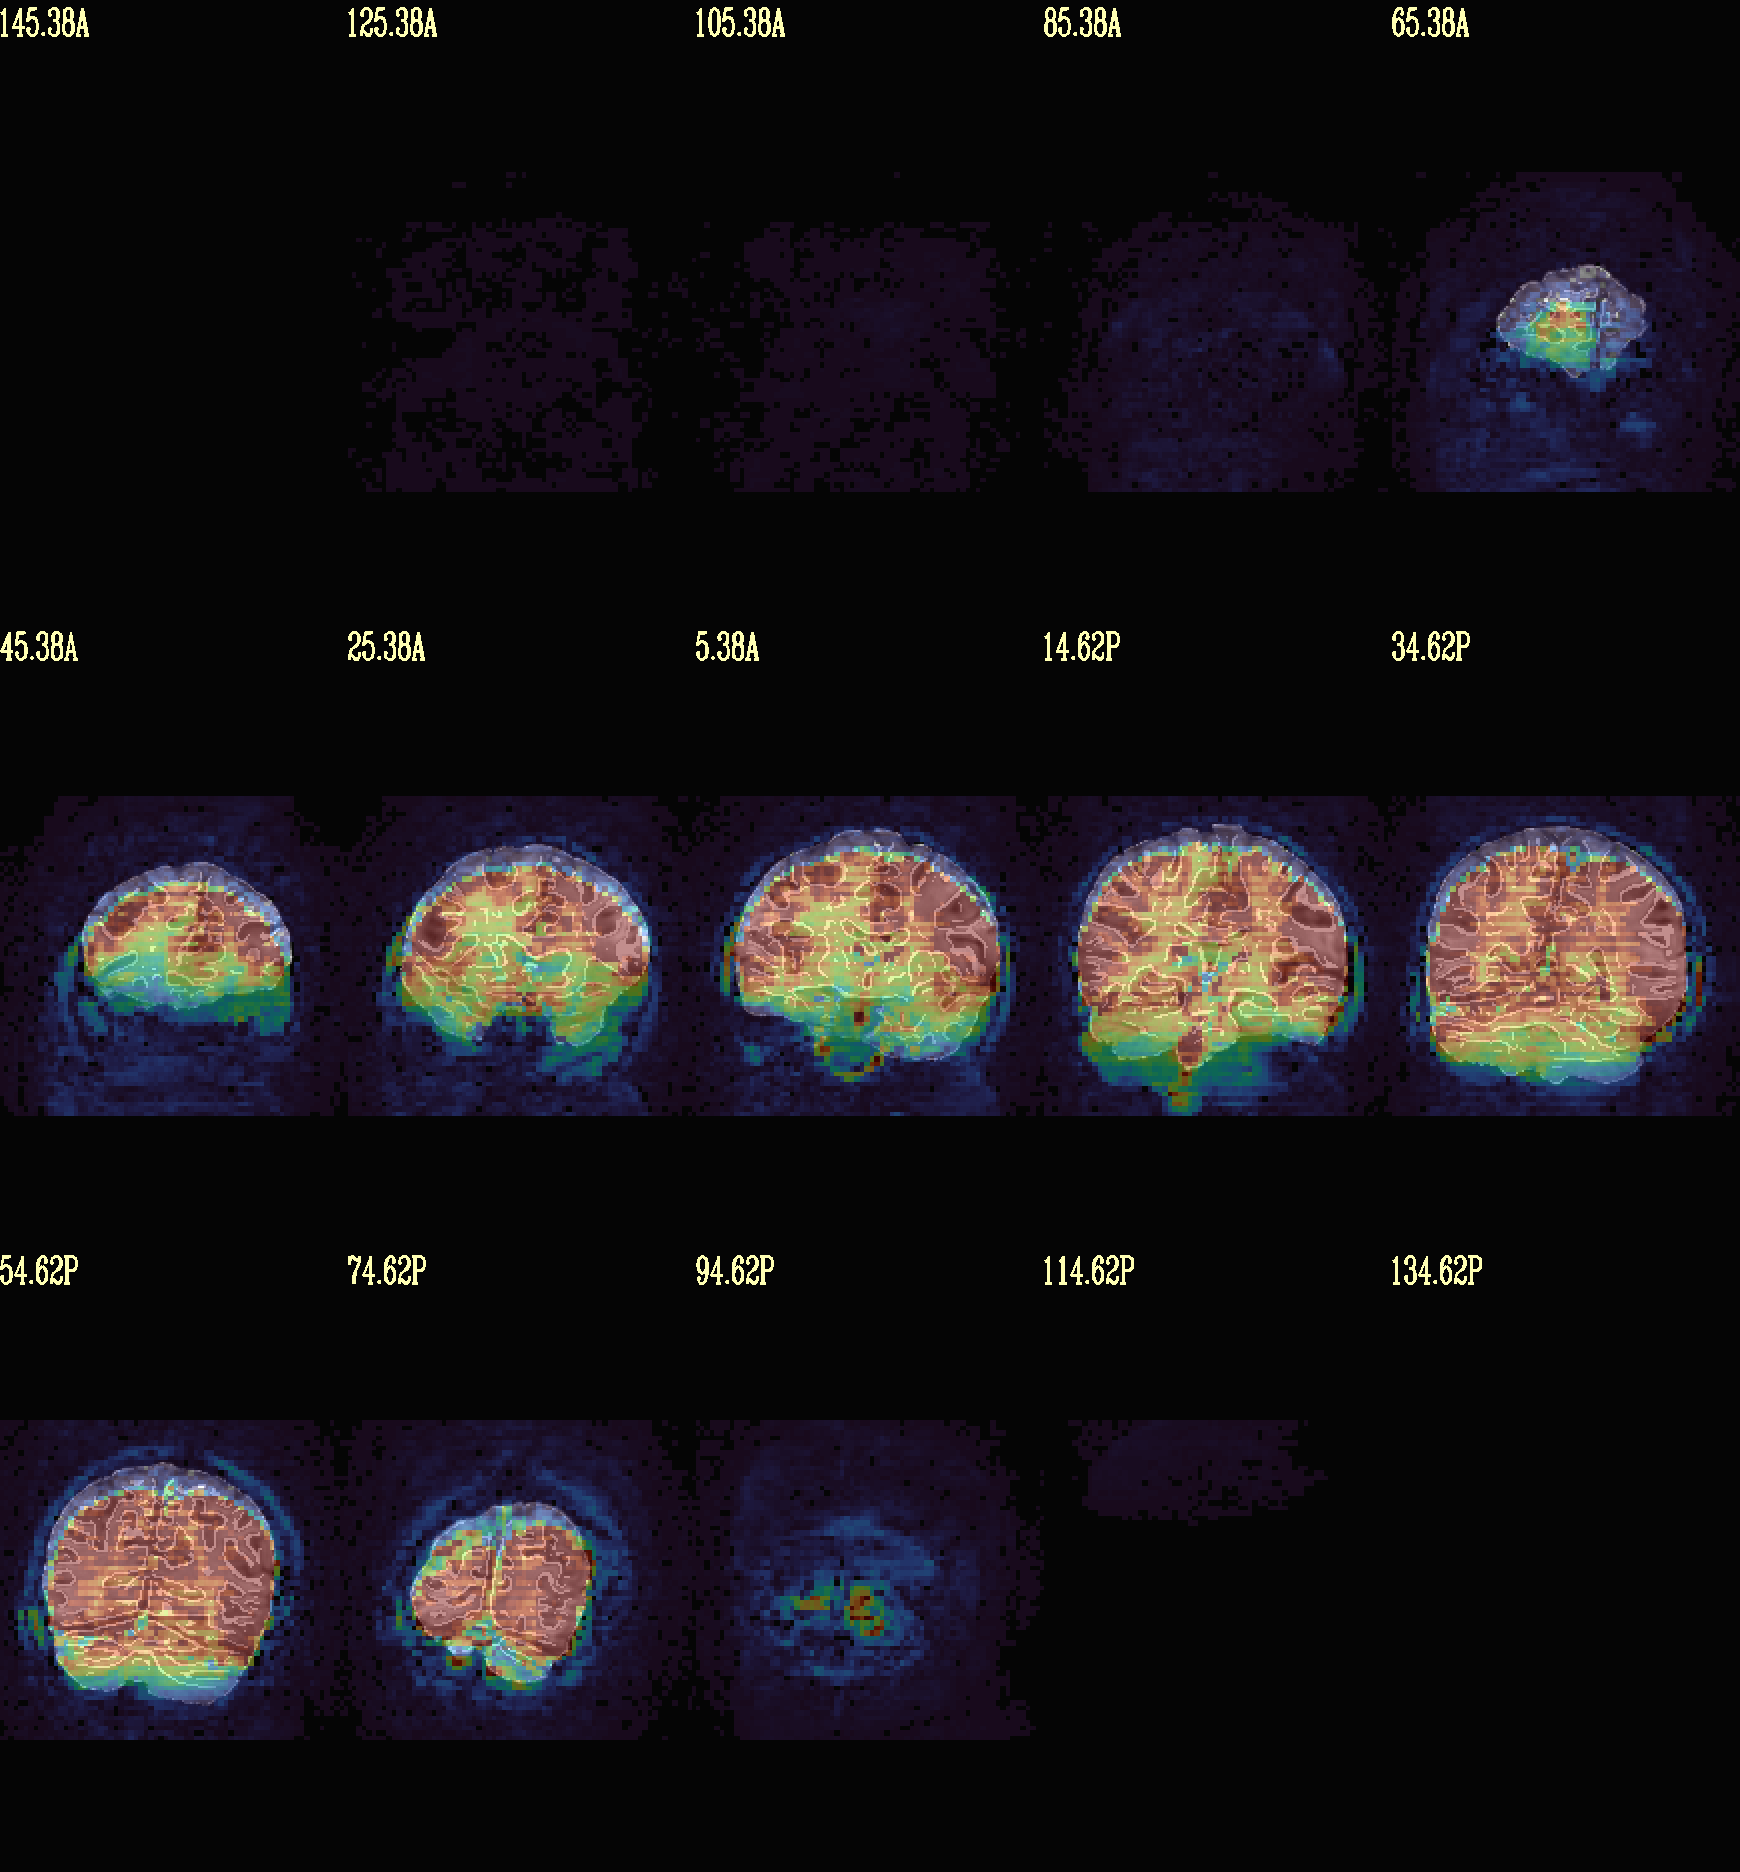
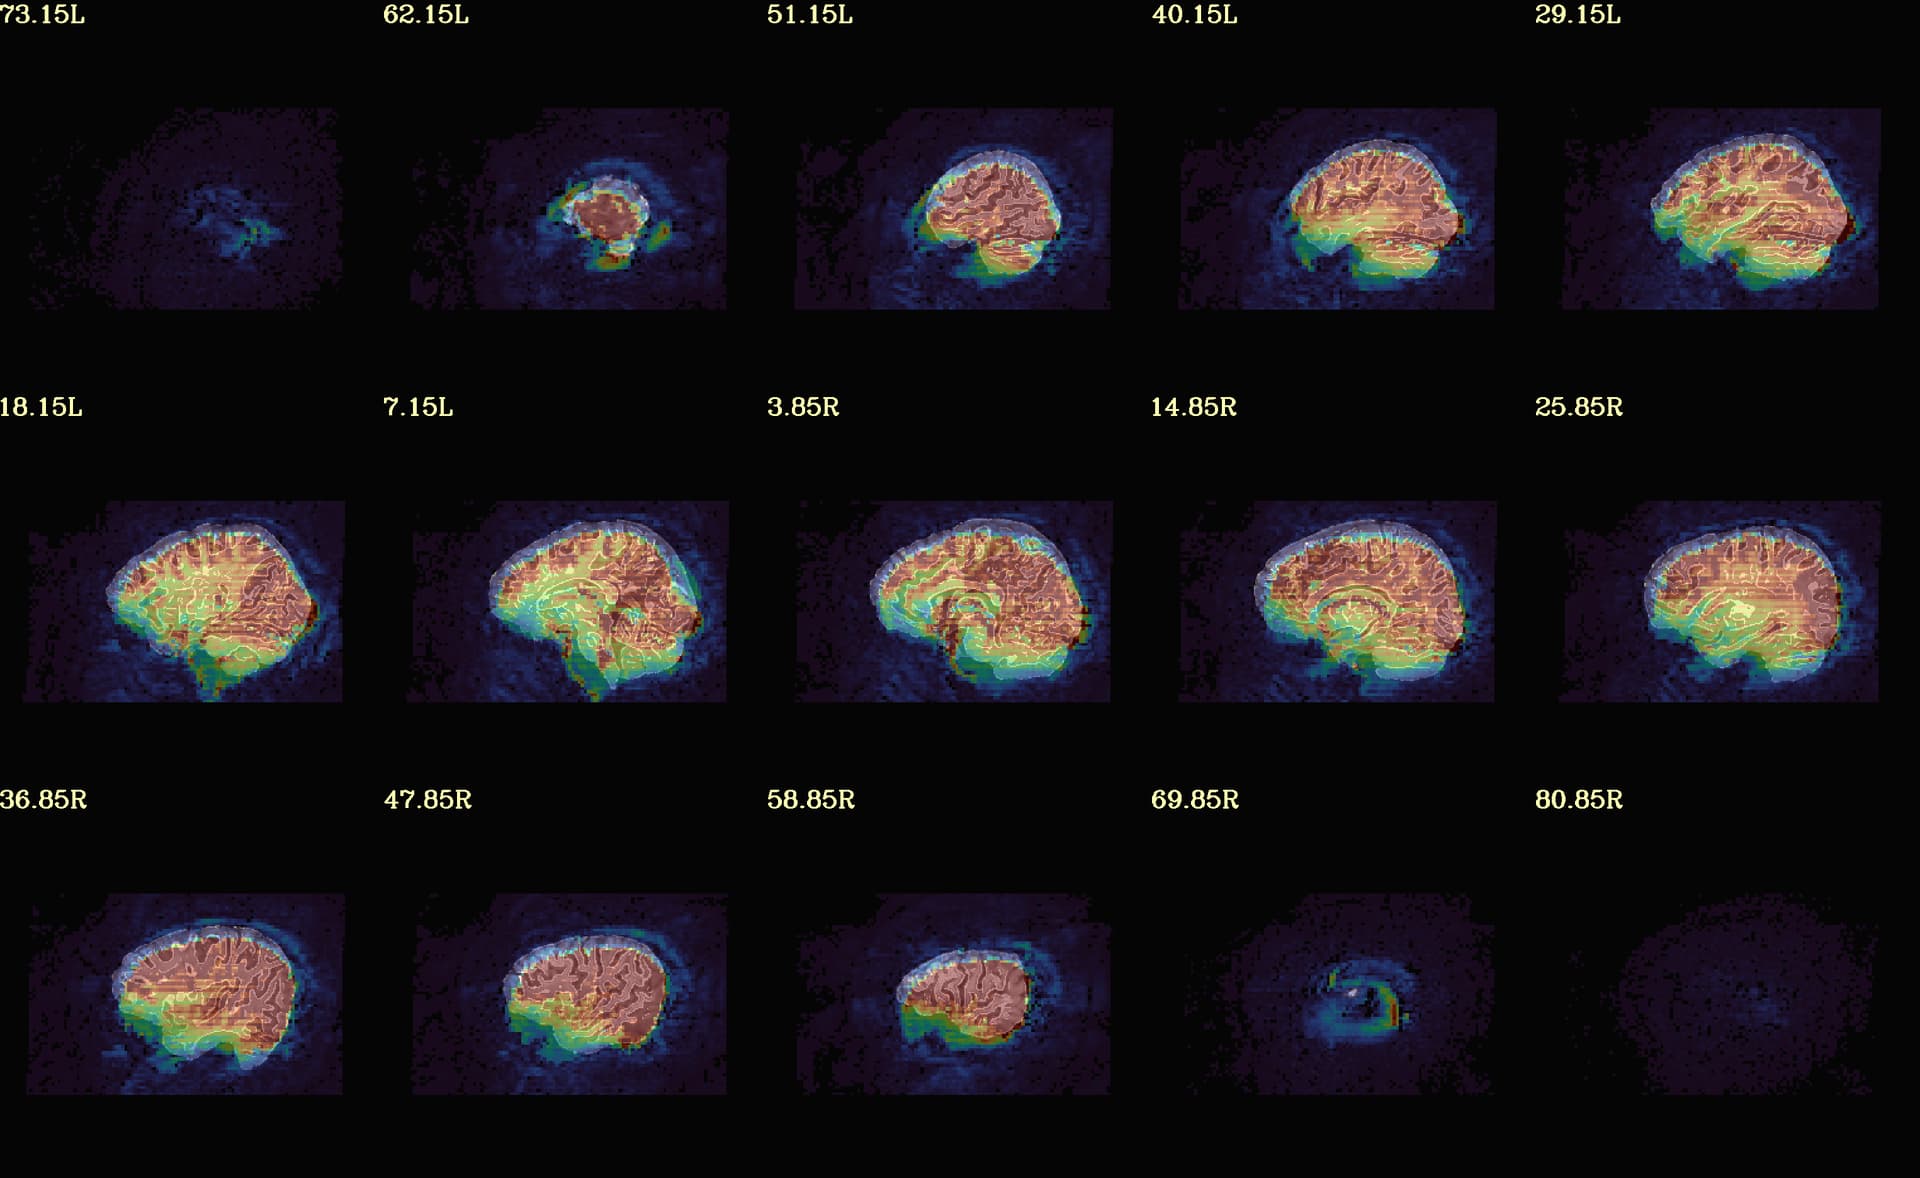
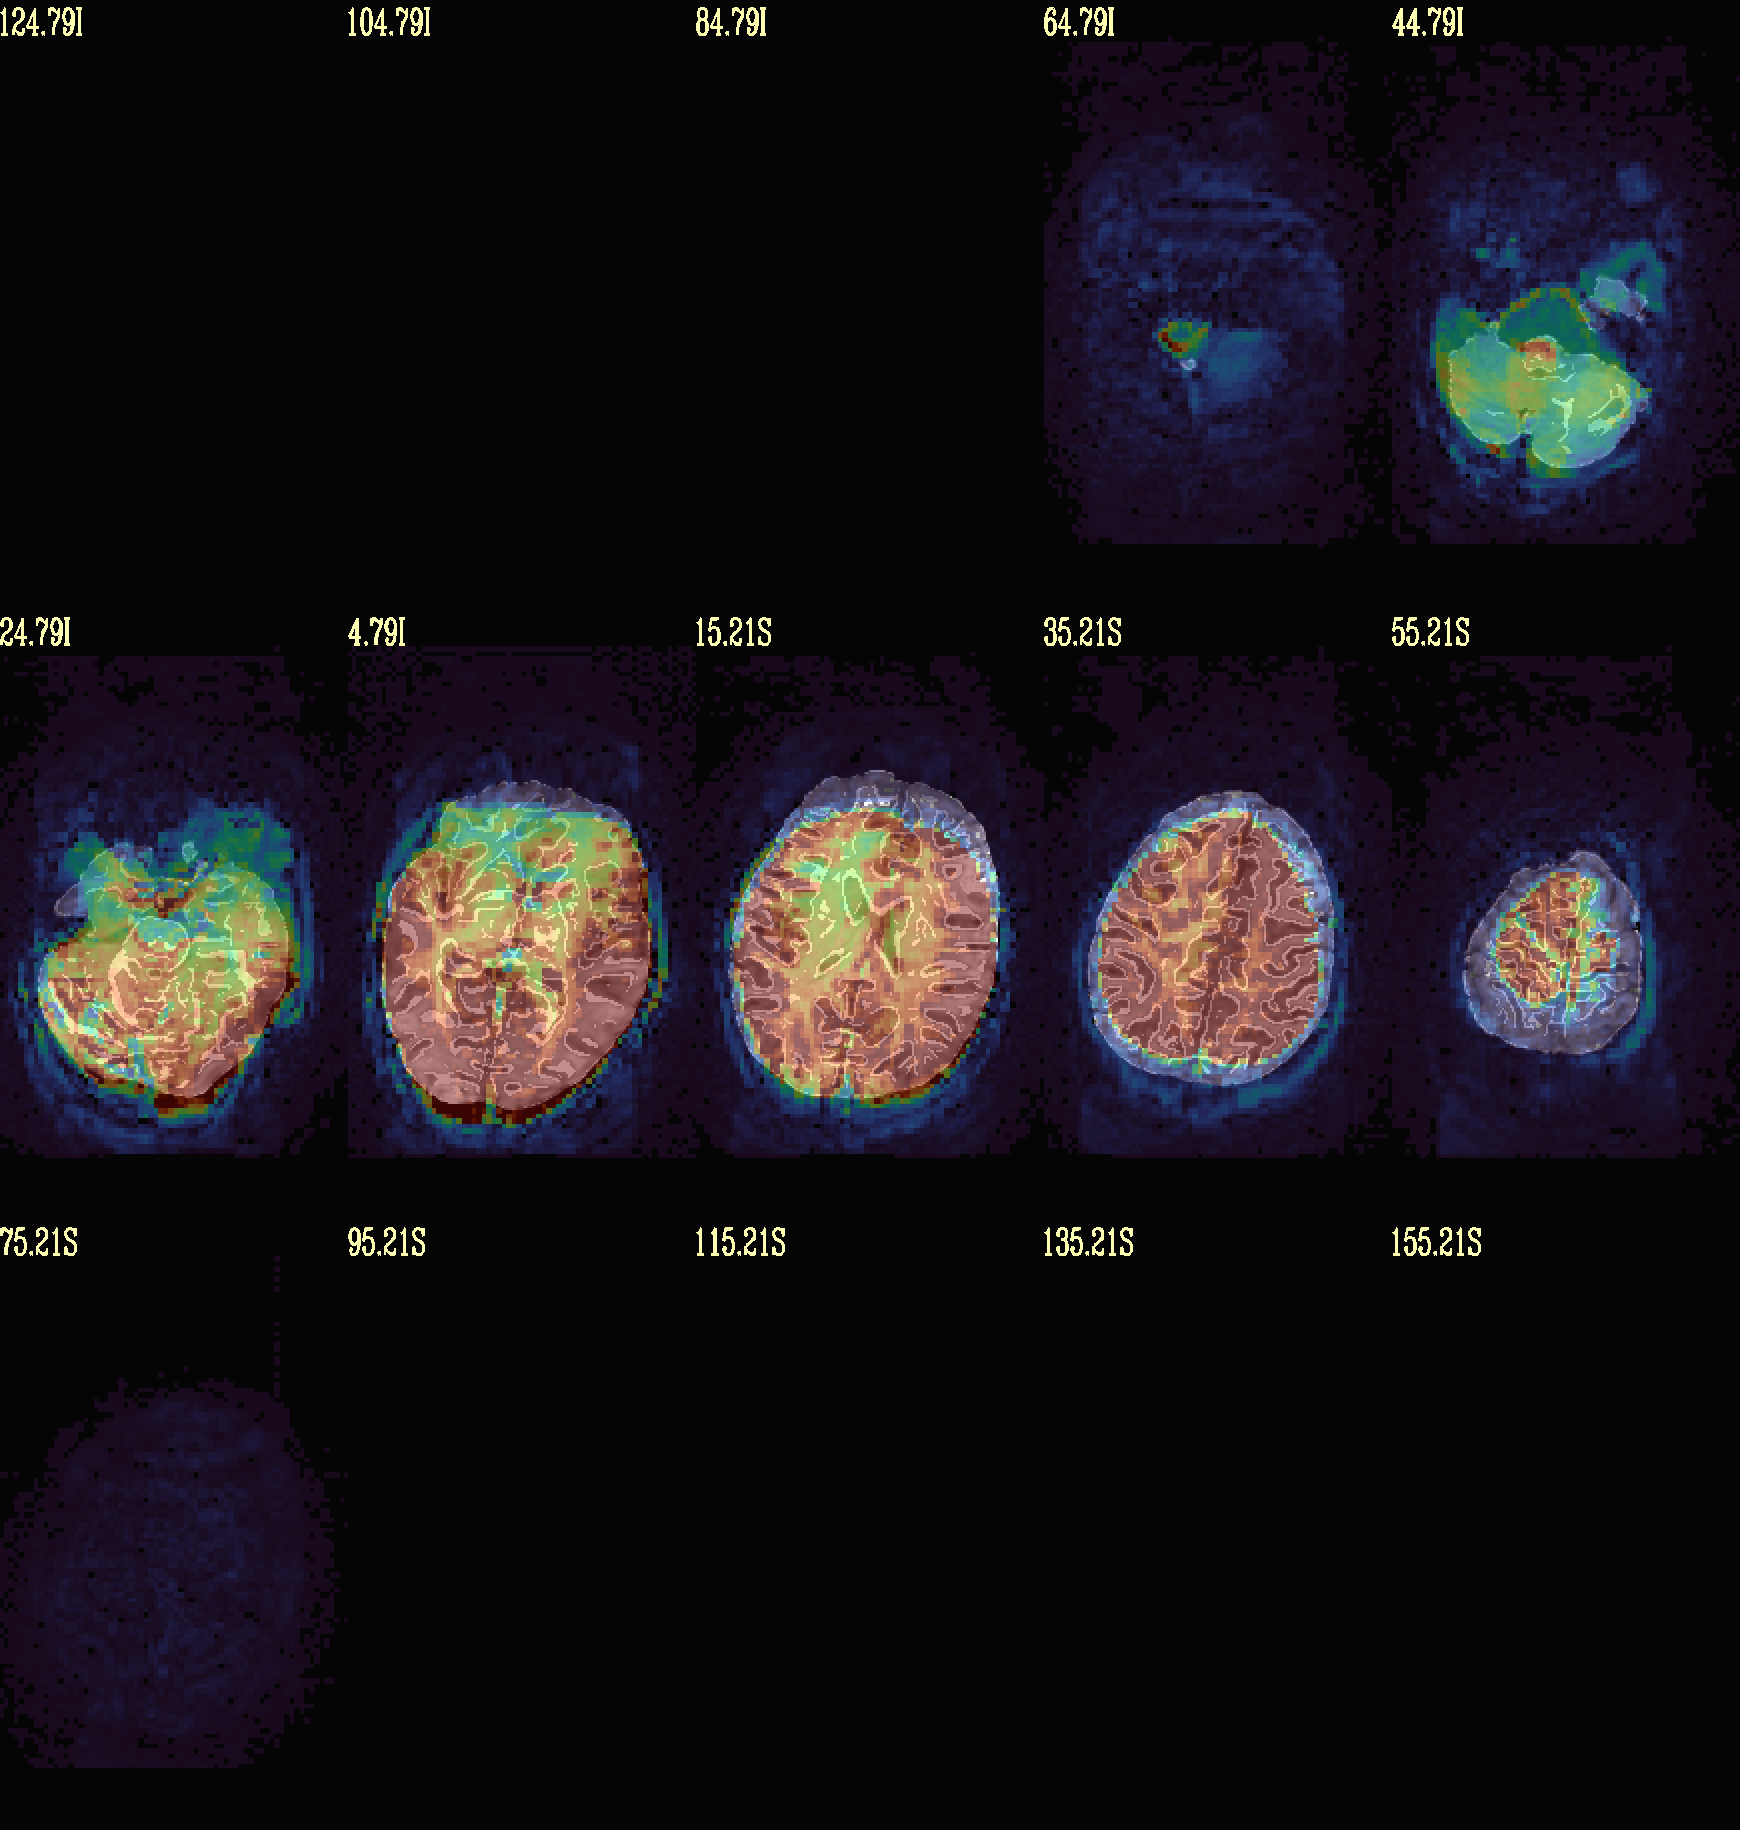
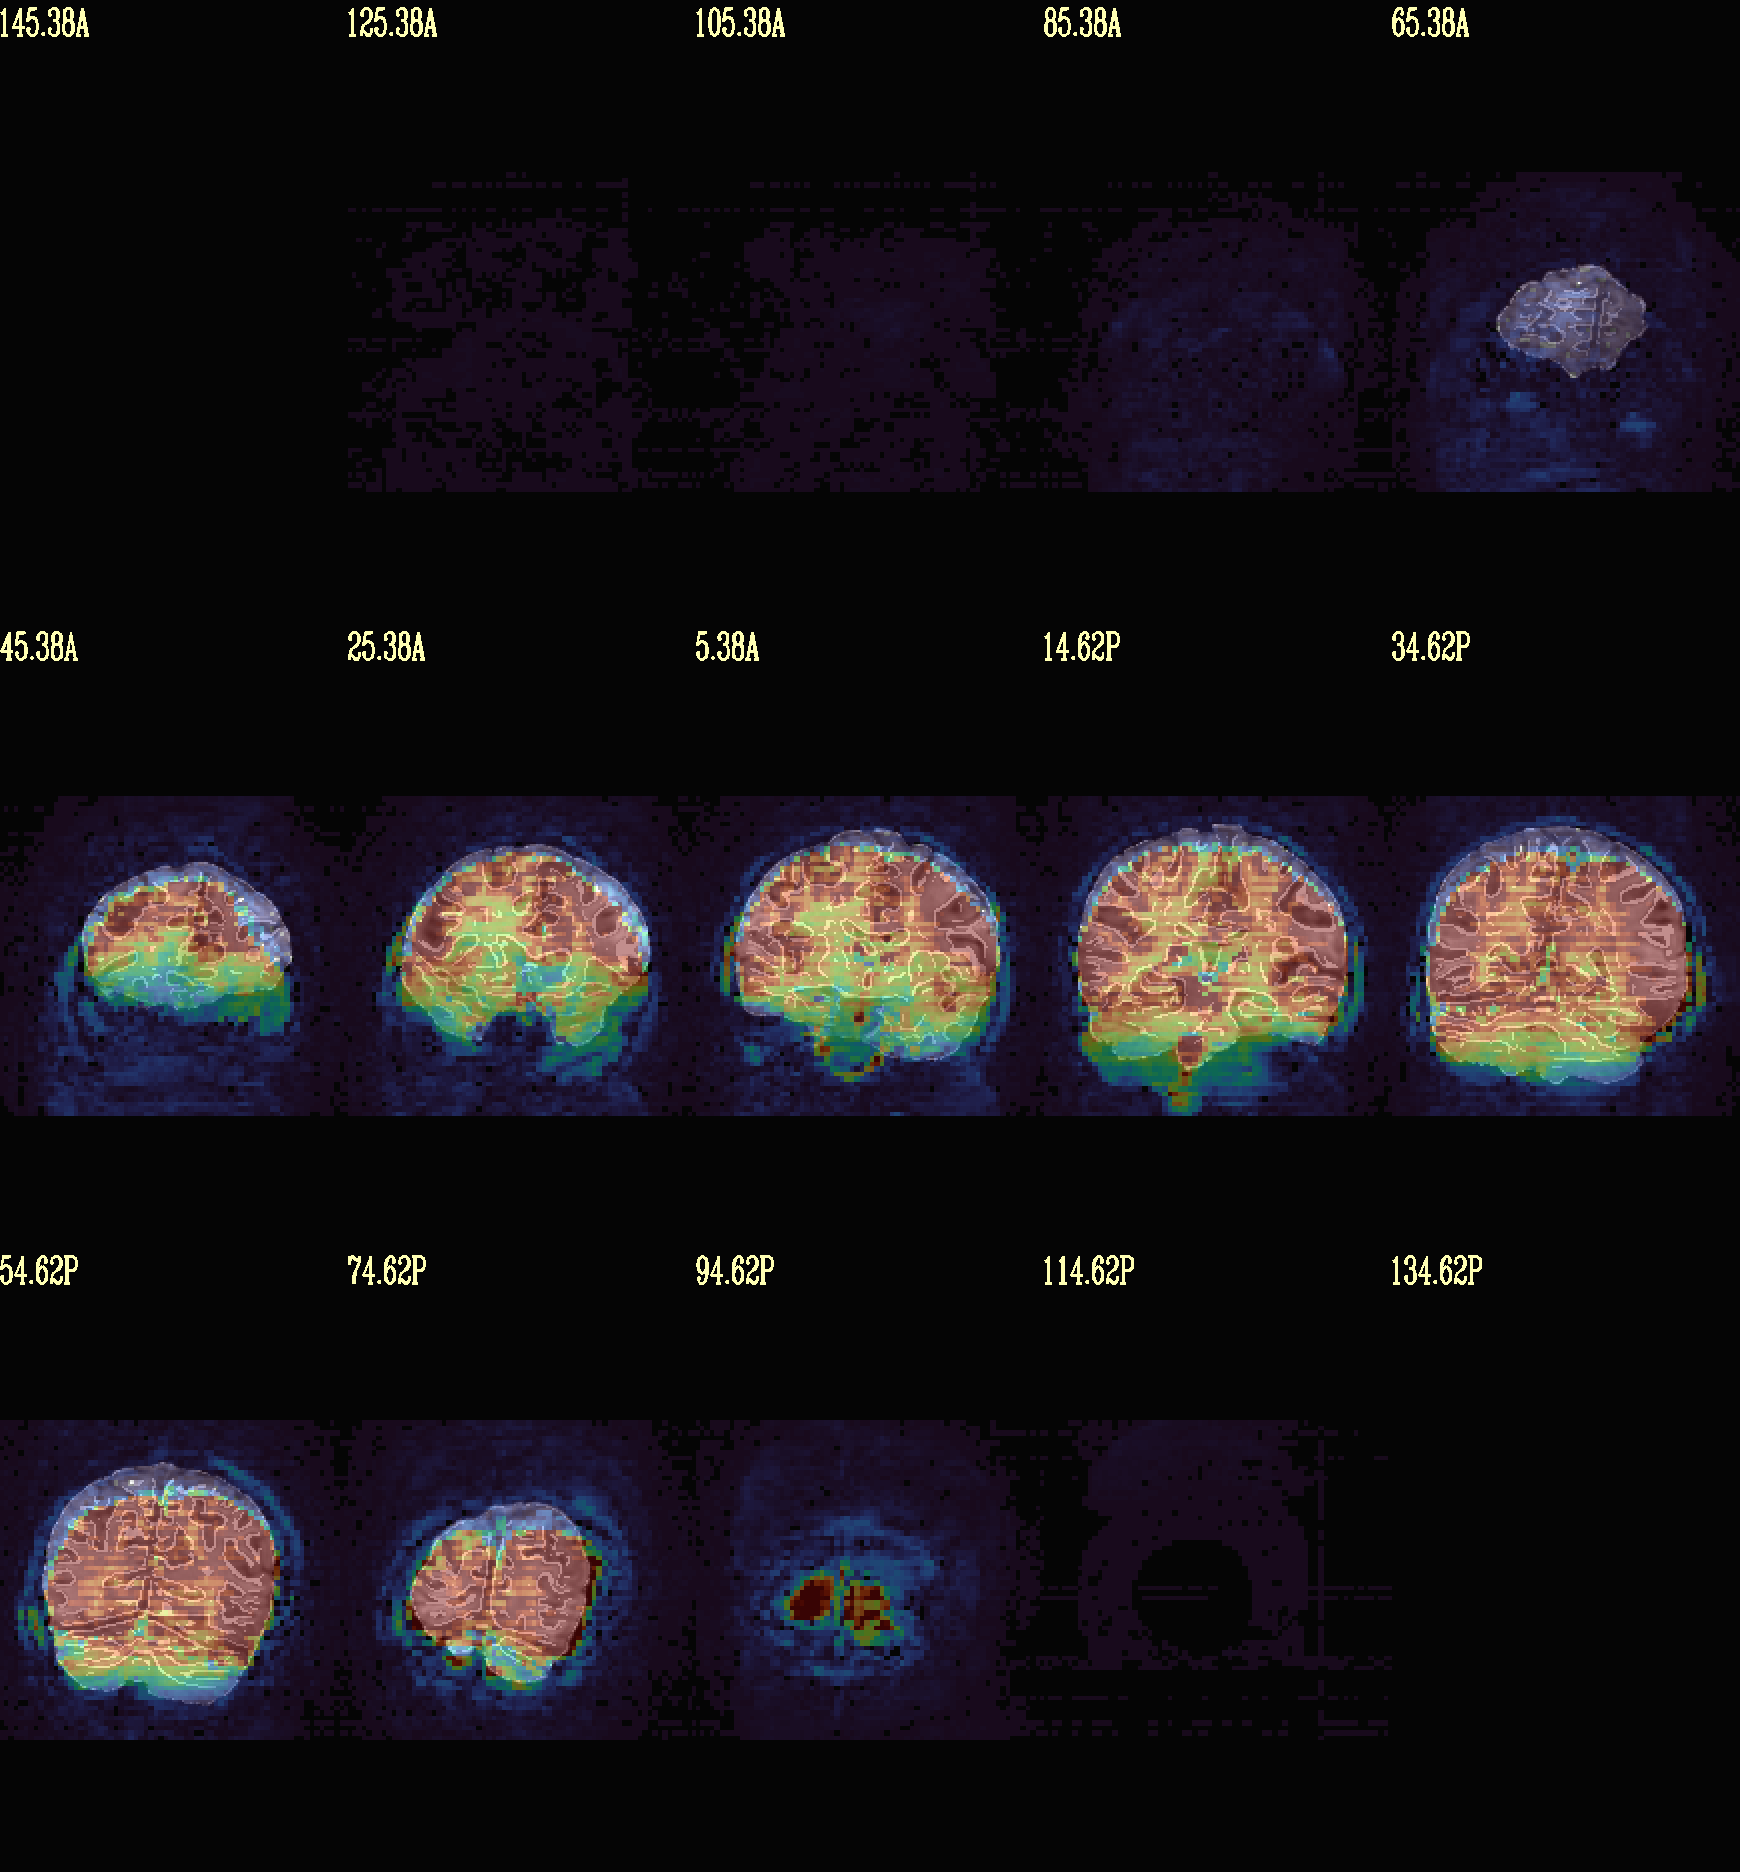
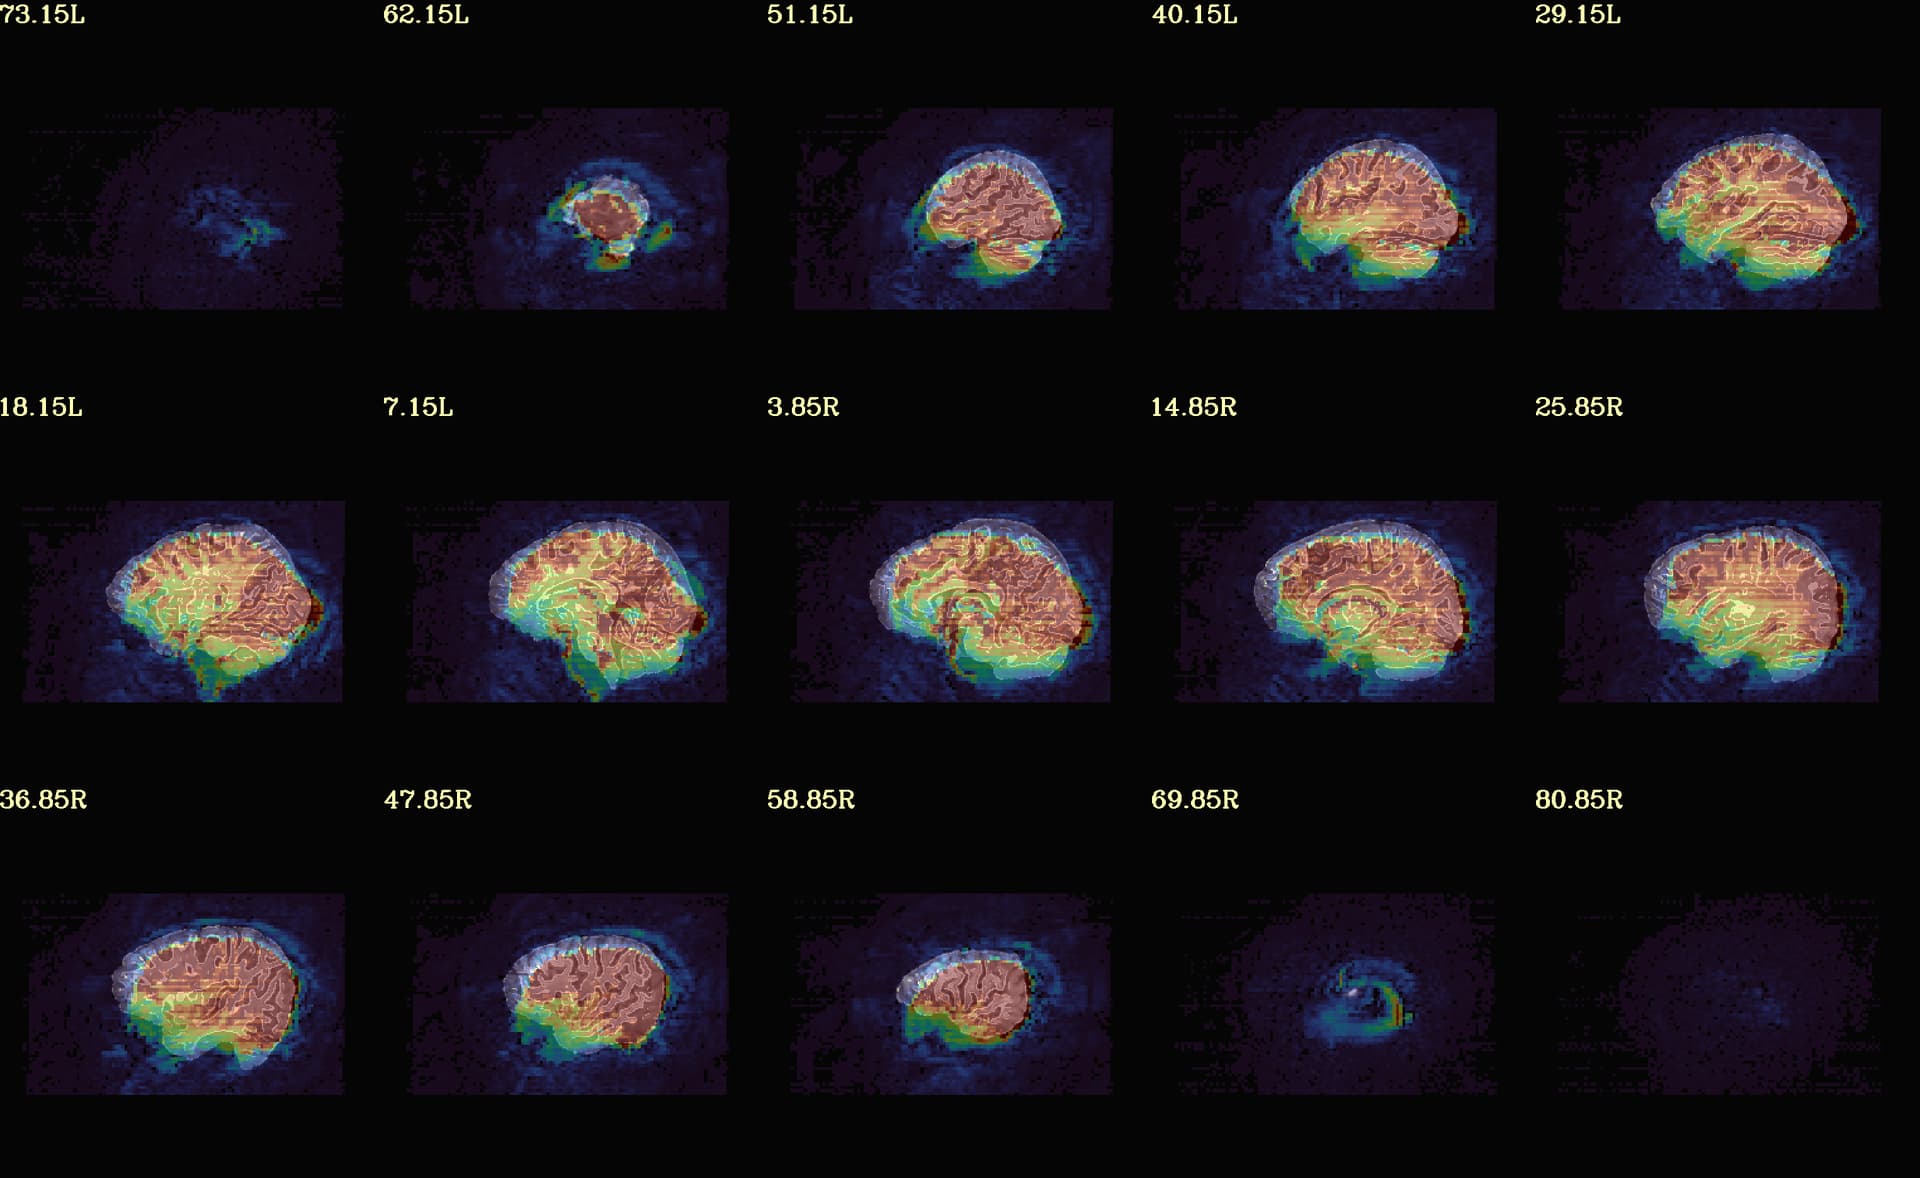
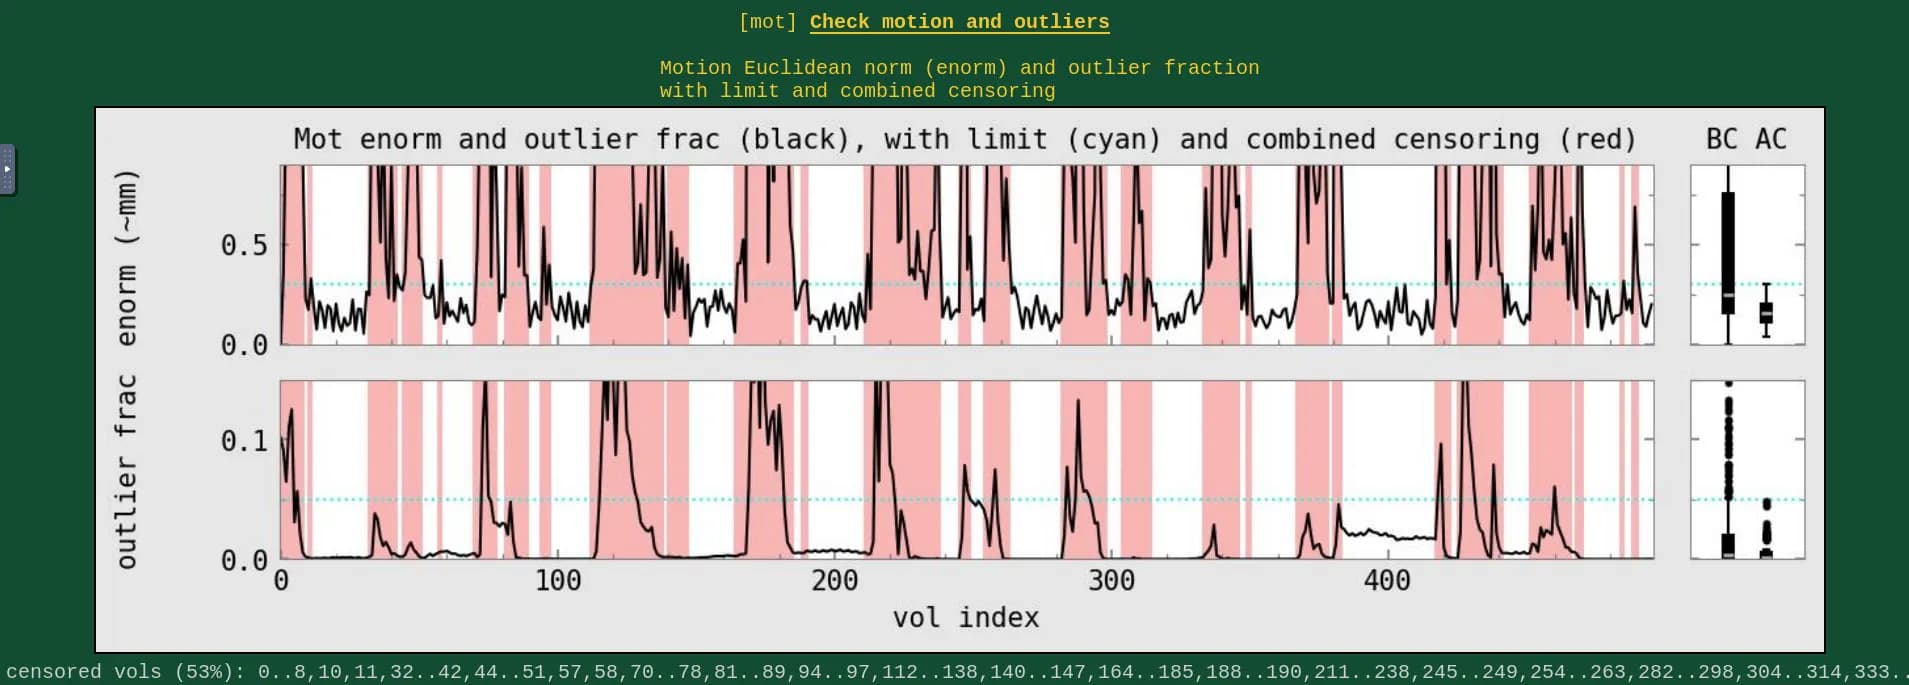
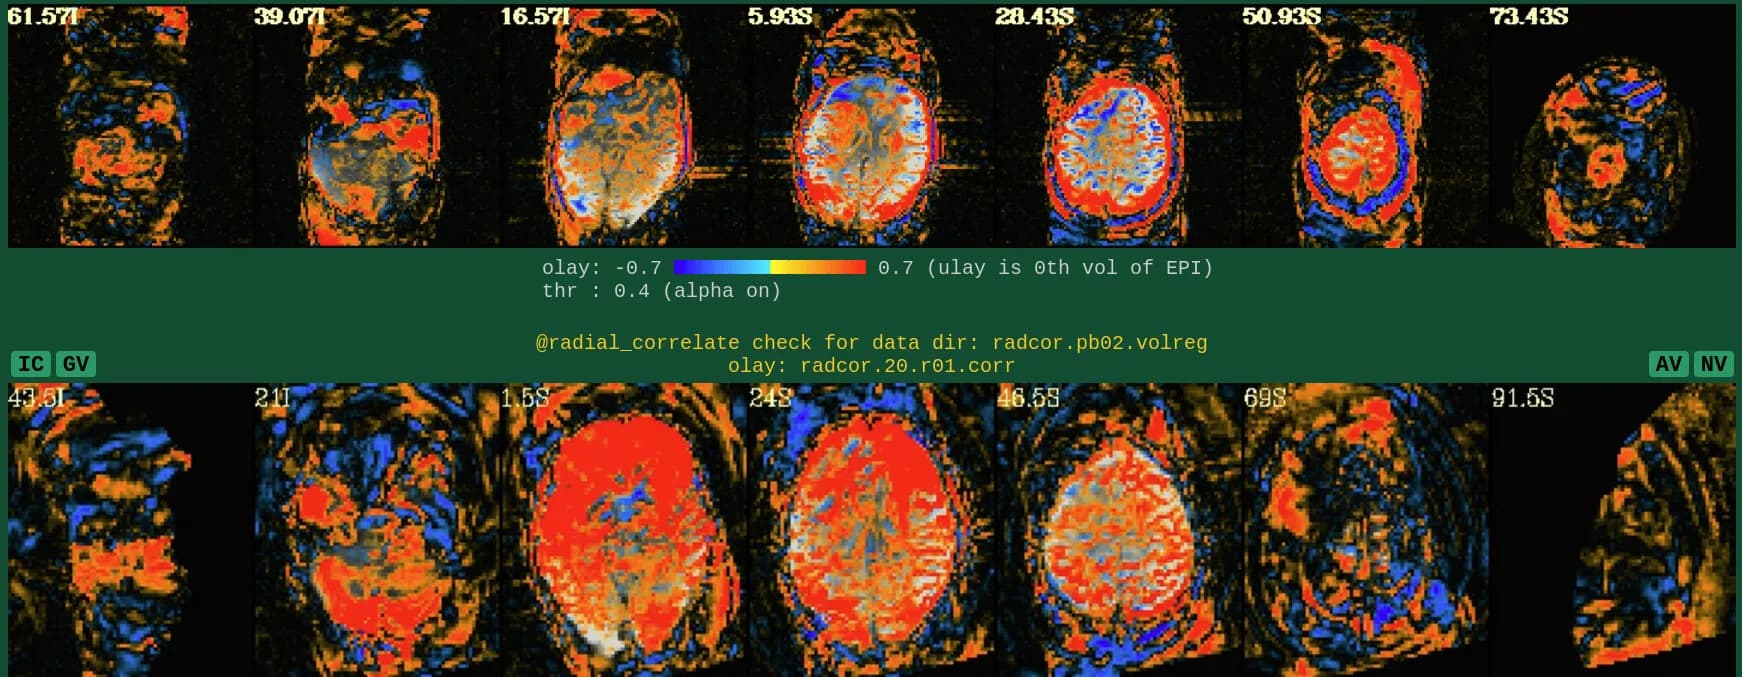
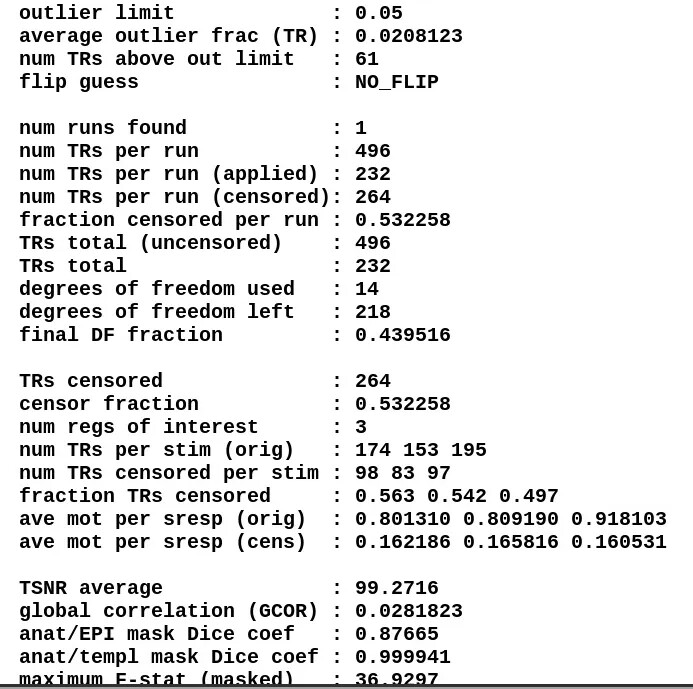
Moreover, when comparing the results of the distortion correction, I found that some results produce more severe distortion, and some results show that the motion correction improves, as evidenced by a reduction in censor fraction. I’m not sure if this is due to motion, as our participants were mainly children aged 5-10 years old, who may have had greater motion when scanning phase maps or magnitude images (so I’m not sure it’s a good idea to do distortion correction either). Here, the former results, the partcipant who produced more motion had more severe distortion.
First, our lab uses dual echo GE health scan so I went to read the document about how to do the distortion correction. According to the GE documentation it should output two nii.gz files, including 1 B0 map itself in HZ and 1 magnitude images, but we have four (two phase maps and two magnitude images for each echo, the two phase maps are not in complex volume), so we need to compute the field map. I asked the operator about the information and he said he wasn’t sure about the units or range of the phase map, but I used the command and found the range of the phase map is [-3141, 3141], so I guess the unit would be rad/s.
I followed the guidance from FUGUE “For a pair of phase images you need to do steps 1b, 1c, 2b, 3, 4a, and 5.”
- Convert the DICOM files into NIFTI files. Get two phase maps and two magnitude maps.
- Make sure the magnitude image and the phase maps have the same resolution:
a.flirt -in B*_PM1_4_ph.nii.gz -ref B*_PM1_4_.nii.gz -applyxfm -out orig_phase0 flirt -in B*_PM2_5_ph.nii.gz -ref B*_PM1_4_.nii.gz -applyxfm -out orig_phase1 - Check the range of phase map, which is [-3141, 3141]. Use
fslmathsand ensure the final range of the phase0_rad image is approximately 0 to 6.28.
a.fslmaths orig_phase0 -add 3141 -mul 3.14159 -div 3140 phase0_rad -odt float fslmaths orig_phase1 -add 3141 -mul 3.14159 -div 3140 phase1_rad -odt float - Unwrap the phase map to reduce the phase wrapping by using
prelude.
a.prelude -a B*_PM1_4_.nii.gz -p phase0_rad -o phase0_unwrapped_rad prelude -a B*_PM2_5_.nii.gz -p phase1_rad -o phase1_unwrapped_rad - Get the final field map in rad/s by calculating the phase map difference and dividing by the TE interval. The delta TE (the difference of echo time) must be in units of milliseconds.
a.fslmaths phase1_unwrapped_rad -sub phase0_unwrapped_rad -mul 1000 -div 2.2 fieldmap_rads -odt float
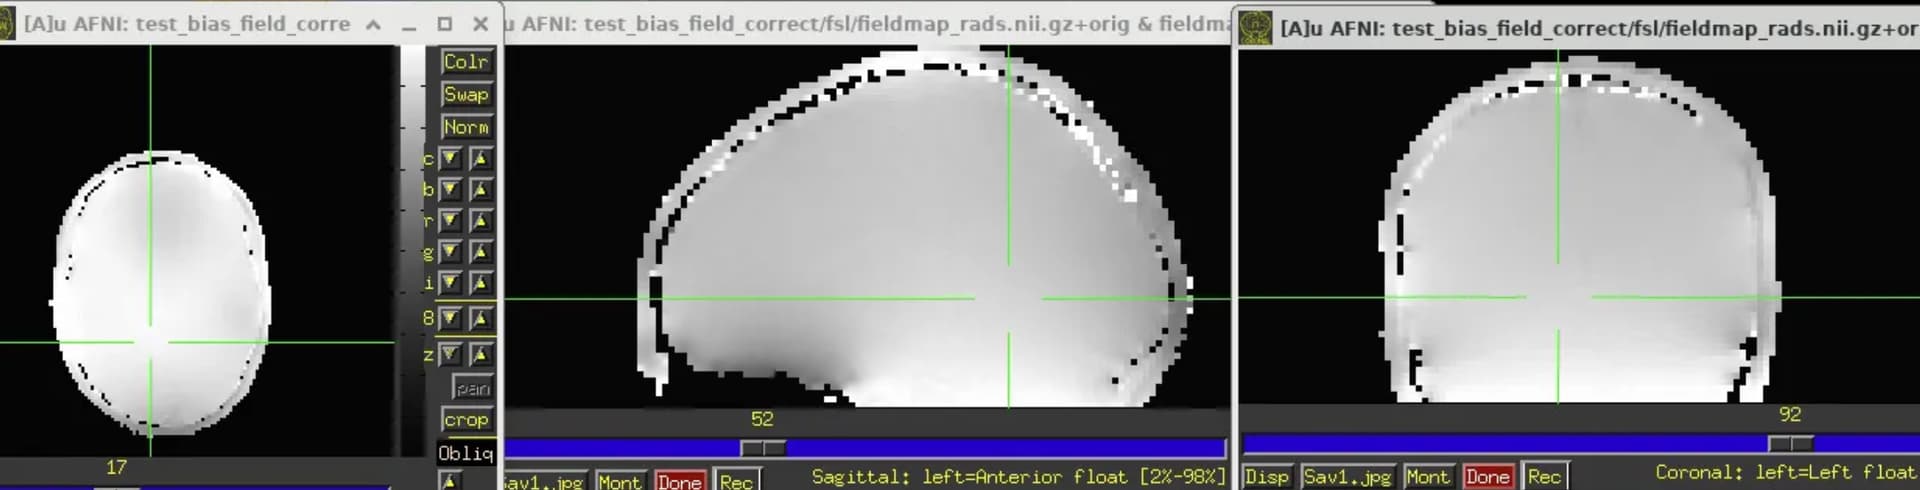
In this way, I get a field map, and then I can use the AFNI processing pipeline epi_b0_correct.py to calculate the wrap field map and put it into afni_proc.py to do the preprocessing step.
In the end, the script looks like this:
#!/bin/bash

# Define the results directory for FSL and AFNI
fsl_results_dir="${base_dir}/s${subj}/derivatives/bias_field_correct/FSL_results"
afni_results_dir="${base_dir}/s${subj}/derivatives/bias_field_correct/AFNI_results"

# Create the result directories if they don't exist
mkdir -p "$fsl_results_dir"
mkdir -p "$afni_results_dir"

# FSL pipeline, to generate a field map
flirt -in B*_PM1_4_ph.nii.gz -ref B*_PM1_4_.nii.gz -applyxfm -out "${fsl_results_dir}/orig_phase0"
flirt -in B*_PM2_5_ph.nii.gz -ref B*_PM1_4_.nii.gz -applyxfm -out "${fsl_results_dir}/orig_phase1"

fslmaths "${fsl_results_dir}/orig_phase0" -add 3141 -mul 3.14159 -div 3140 "${fsl_results_dir}/phase0_rad" -odt float
fslmaths "${fsl_results_dir}/orig_phase1" -add 3141 -mul 3.14159 -div 3140 "${fsl_results_dir}/phase1_rad" -odt float

prelude -a B*_PM1_4_.nii.gz -p "${fsl_results_dir}/phase0_rad" -o "${fsl_results_dir}/phase0_unwrapped_rad"
prelude -a B*_PM2_5_.nii.gz -p "${fsl_results_dir}/phase1_rad" -o "${fsl_results_dir}/phase1_unwrapped_rad"

fslmaths "${fsl_results_dir}/phase1_unwrapped_rad" -sub "${fsl_results_dir}/phase0_unwrapped_rad" -mul 1000 -div 2.2 "${fsl_results_dir}/fieldmap_rads" -odt float

# AFNI pipeline, you need to use the WRAP file in afni_proc.py once you finish it
epi_b0_correct.py \
  -in_epi_json B*CEV*.json \
  -in_freq "${fsl_results_dir}/fieldmap_rads.nii.gz" \
  -in_magn B*_PM1_4_.nii.gz \
  -in_epi B*CEV*.nii.gz \
  -in_anat "${base_dir}/s${subj}/derivatives/sswarp2/T1_results/anatQQ.s${subj}.nii"  \
  -prefix "${afni_results_dir}/b0_corr_s${subj}" \
  -do_recenter_freq MEAN
Finally, use the warp file in afni_proc.py : put the -blip_warp_dset b0_corr_WARP.nii.gz \ between tcat_remove_first_trs and tshift_interp.
Environment (Docker, Singularity / Apptainer, custom installation):
HPC
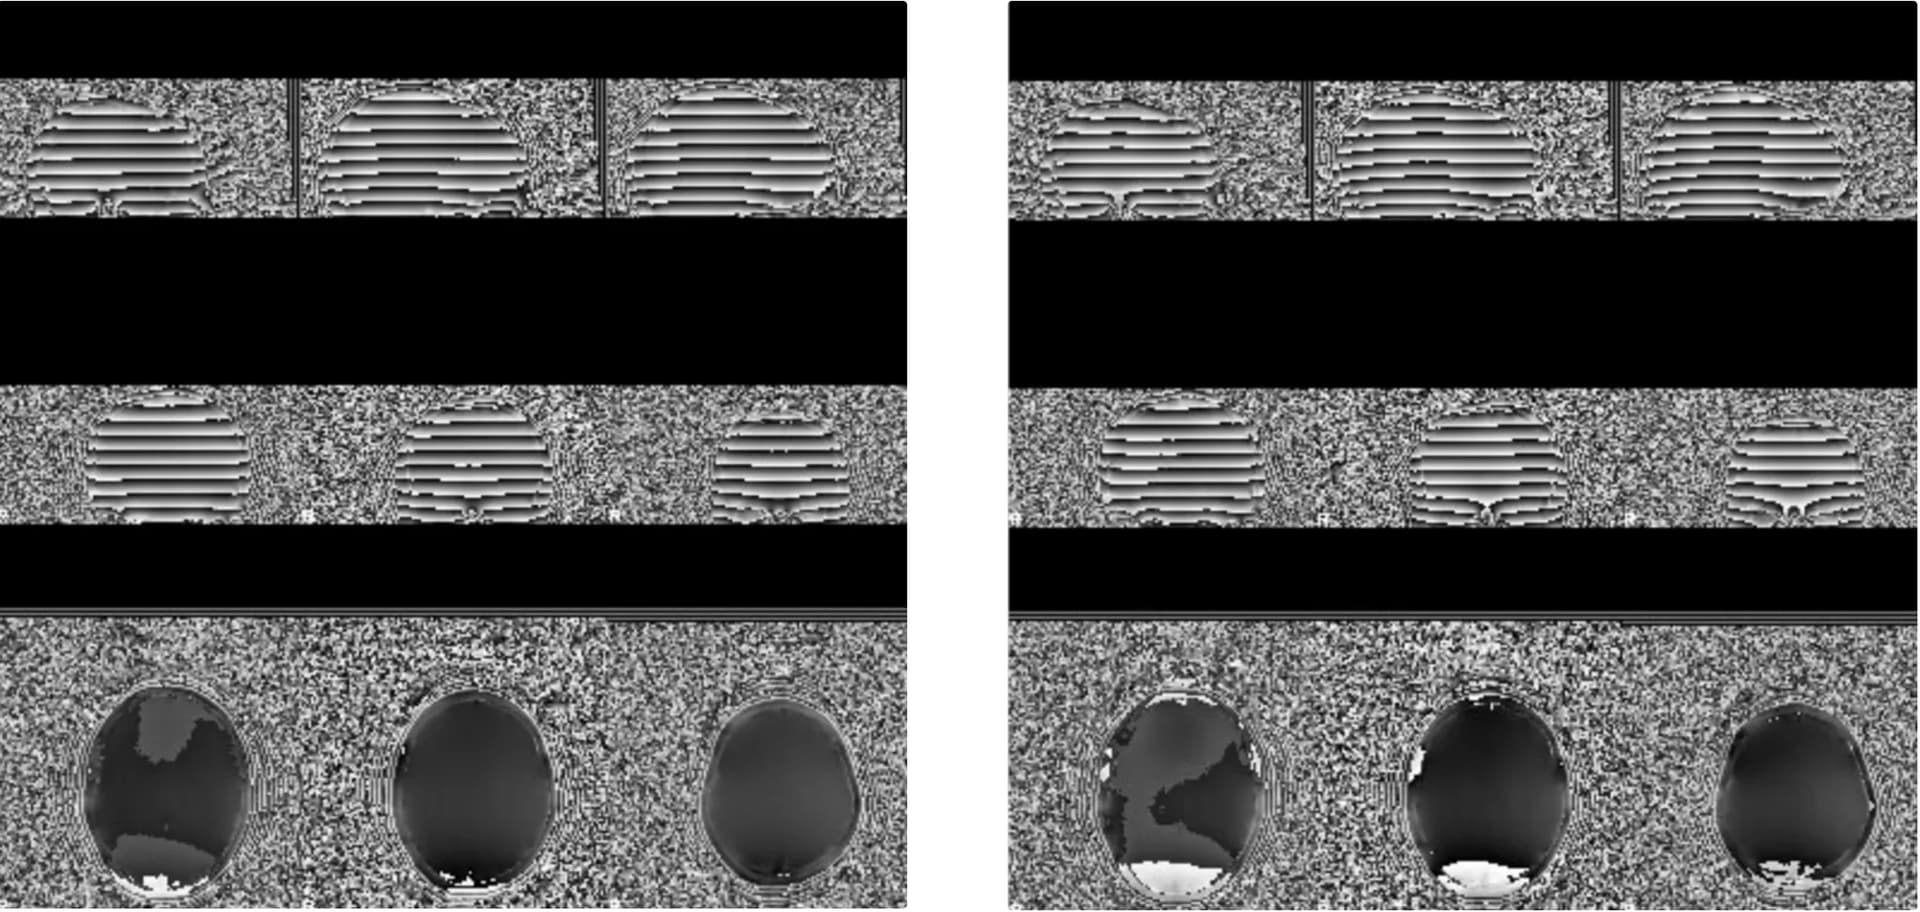
Screenshots / relevant information:
After I did distortion correction, one participant has more severe distortion…but this participant moves a lot during the session.
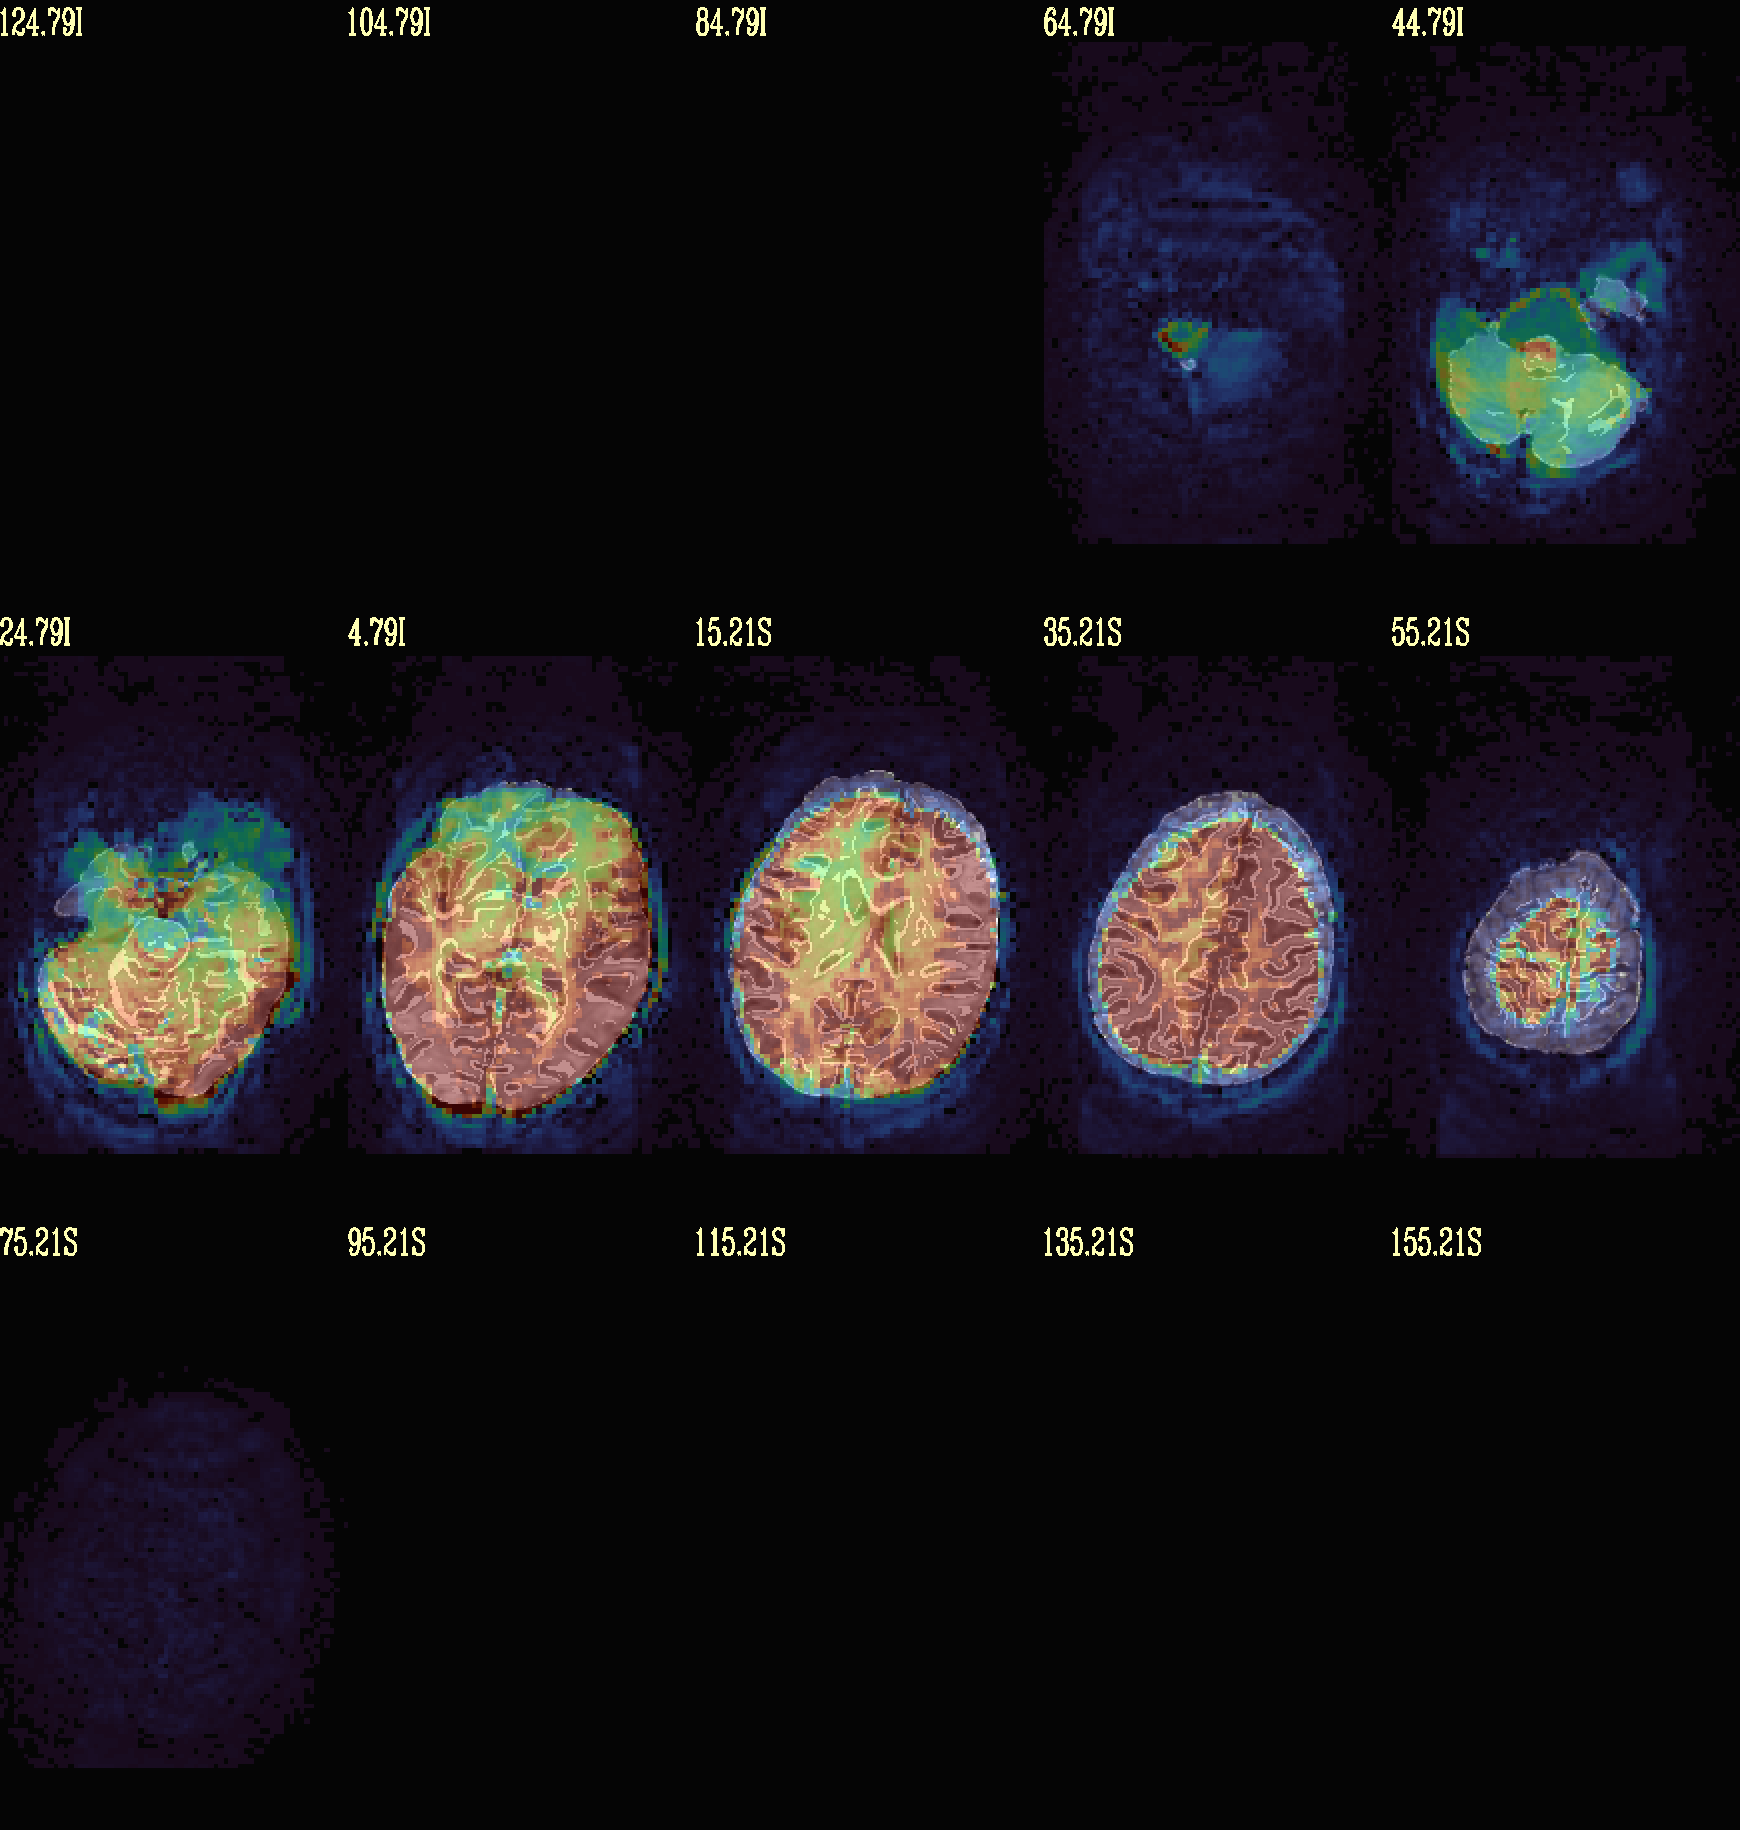
With correction: