We’ve just shipped an update to the HCP project dataset loader notebook.
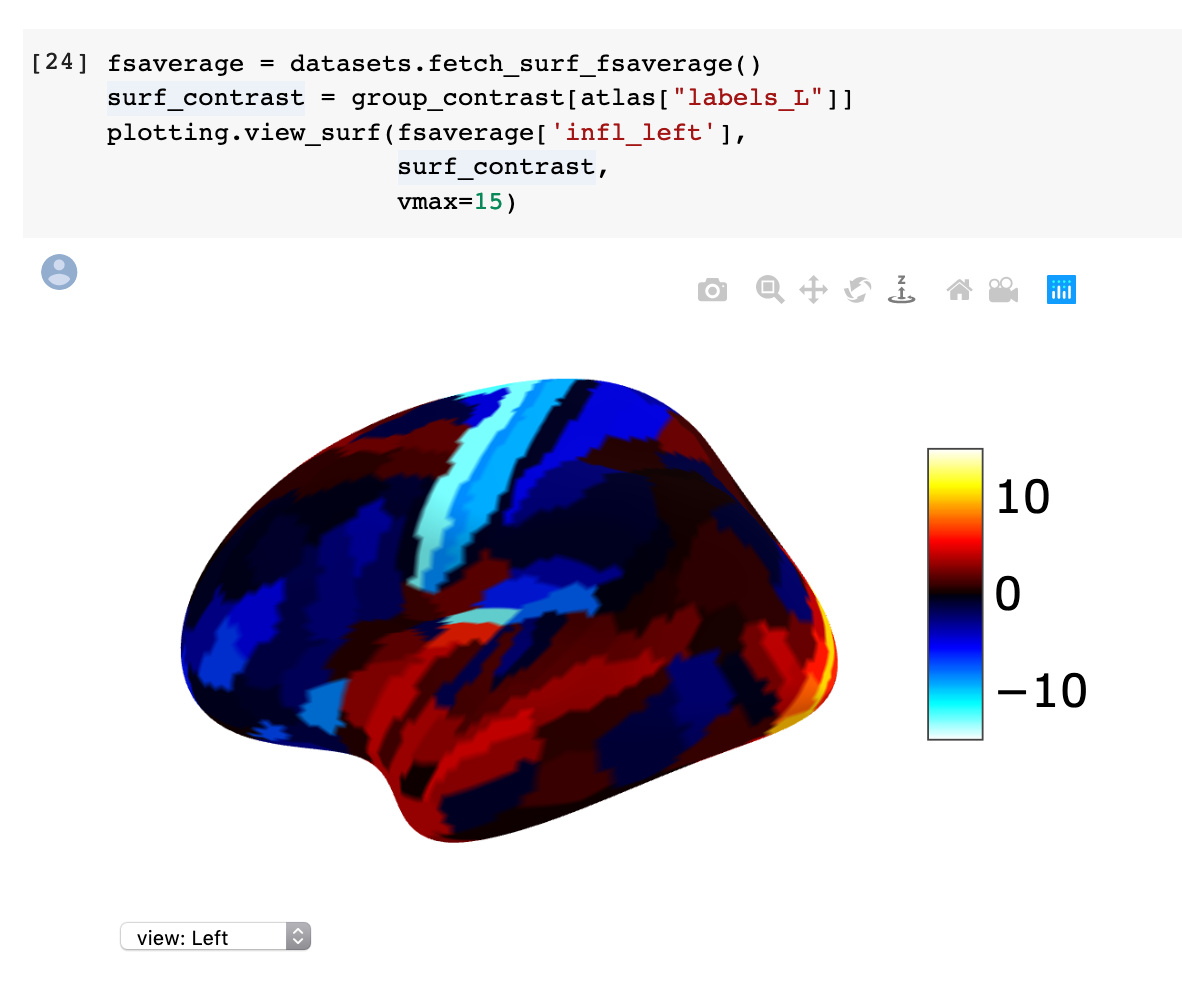
The update includes additional information useful for visualizing the parcel-wise data in Nilearn, including showing ROI statistics on the fsaverage5 surface:
Hi!
I was exploring the visualization update according to my different correlation matrix and threshold values but after a few plots, I’m getting this warning that I have created more than 10 plots.
I want to know how to clear my colab RAM? I’m just plotting 1 plot and then after downloading it as png image I delete the cell and create a new plot with different data but still, I’m getting the warning.
/usr/local/lib/python3.6/dist-packages/nilearn/reporting/html_document.py:60: UserWarning: It seems you have created more than 10 nilearn views. As each view uses dozens of megabytes of RAM, you might want to delete some of them.
  MAX_IMG_VIEWS_BEFORE_WARNING))
In my group, we’re looking at the HCP data and we would like to do some modelling that bridges between the fMRI and the behavioural data. We are particularly interested in the Language task (story/math) and whether we can get hold of the trial by trial accuracy or difficulty for the questions that are asked after the stories or maths problems. We here define a trial as an individual run in each task (e.g. each story that the subjects listen to in language task -> story condition).
Could anyone point us where to find this, or whether this data exists at all? Many thanks
Hi, thanks for the updates! I have a question about the group_contrast[atlas[“labels_L”]] part of the surface plots. group_contrast has a length of 360 for each of the parcels, but atlas[“labels_L”] has a length of over 10,000? Can you provide some insight to how this indexing is working?
The 3D visualization uses a mesh that has ~10K vertices. The atlas["labels_L"] maps from the indices in a parcel-wise array to a vertex-wise array.
When indexing into a numpy array with integer values, the size of the index array determines the size of the output. The size of the input determing the range of possible index values. Does that help?
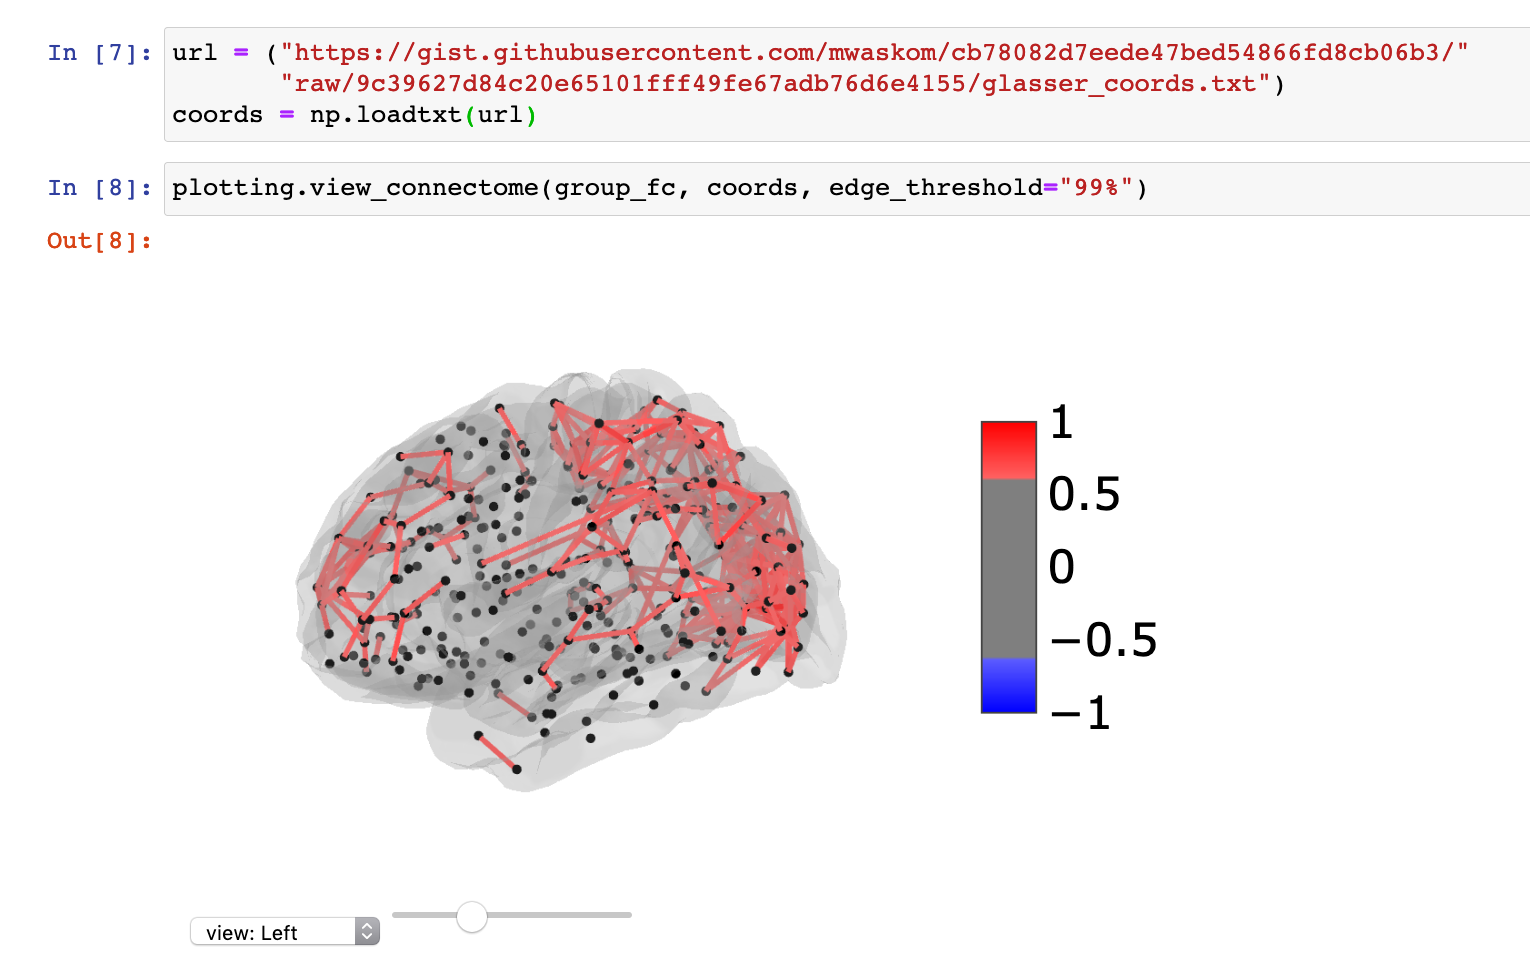
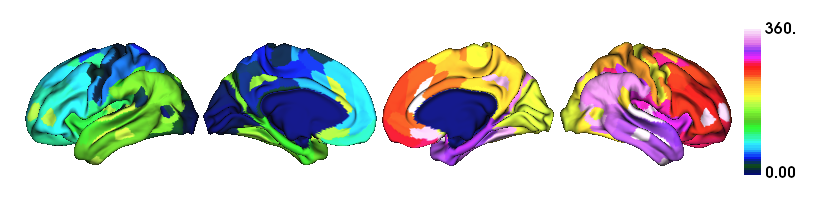
In my pod we prepared two ipynb with visualization of the Glasser parcellations over the surface, I couldn’t make them work on colab, but they work fine locally (if all the dependencies are install).
Could be useful for visualization.
hi
yes this data exists if i well understood your question, you want EVs of language task.
you can find that in AWS or compact subject data in a path like this
104416_3T_tfMRI_LANGUAGE_preproc//104416/MNINonLinear/Results/tfMRI_LANGUAGE_LR/EVs/