Hi y’all!
I am attempting to run FSLNets in the Octave GUI and I am not getting the output I am expecting (i.e. the group maps, which I have attached). I cannot seem to find where the error is occurring so I have attached my_nets.m script (please note I already ran the script to create the summary outputs as well):
%% FSLNets - simple network matrix estimation and applications
%%% FMRIB Analysis Group
%%% Copyright © 2012-2014 University of Oxford
%%% See documentation at www.fmrib.ox.ac.uk/fsl
%%% change the following paths according to your local setup
addpath /Users/knameth/Desktop/FAB/FSLNets % wherever you’ve put this package
addpath /Users/knameth/Desktop/FAB/FSLNets/L1precision % L1precision toolbox
addpath /Users/knameth/Desktop/FAB/FSLNets/pwling % pairwise causality toolbox
addpath(sprintf(’%s/etc/matlab’,getenv(‘FSLDIR’))) % you don’t need to edit this if FSL is setup already
%%% setup the names of the directories containing your group-ICA and dualreg outputs
group_maps=’/Users/knameth/Desktop/FAB/FSLNets/groupmelodic.ica/melodic_IC.nii.gz’; % spatial maps 4D NIFTI file, e.g. from group-ICA
%%% you must have already run the following (outside MATLAB), to create summary pictures of the maps in the NIFTI file:
%%% slices_summary <group_maps> 4 $FSLDIR/data/standard/MNI152_T1_2mm <group_maps>.sum
ts_dir=’/Users/knameth/Desktop/FAB/FSLNets/53_ICA.dr’; % dual regression output directory, containing all subjects’ timeseries
%%% load timeseries data from the dual regression output directory
ts=nets_load(ts_dir,2,1);
%%% arg2 is the TR (in seconds)
%%% arg3 controls variance normalisation: 0=none, 1=normalise whole subject stddev, 2=normalise each separate timeseries from each subject
ts_spectra=nets_spectra(ts); % have a look at mean timeseries spectra
%%% cleanup and remove bad nodes’ timeseries (whichever is not listed in ts.DD is BAD).
ts.DD=[13 14 15 17 21 22 34 36 39 44 45 47 48 49 55 56 59 61 62 64 66 69 71 82 83 87 90 96 97 99 103 104 110 111 113 119 126 130 134 140 148]; % list the good nodes in your group-ICA output (counting starts at 1, not 0)
% ts.UNK=[10]; optionally setup a list of unknown components (where you’re unsure of good vs bad)
ts=nets_tsclean(ts,1); % regress the bad nodes out of the good, and then remove the bad nodes’ timeseries (1=aggressive, 0=unaggressive (just delete bad)).
% For partial-correlation netmats, if you are going to do nets_tsclean, then it probably makes sense to:
% a) do the cleanup aggressively,
% b) denote any “unknown” nodes as bad nodes - i.e. list them in ts.DD and not in ts.UNK
% (for discussion on this, see Griffanti NeuroImage 2014.)
nets_nodepics(ts,group_maps); % quick views of the good and bad components
ts_spectra=nets_spectra(ts); % have a look at mean spectra after this cleanup
%%% create various kinds of network matrices and optionally convert correlations to z-stats.
%%% here’s various examples - you might only generate/use one of these.
%%% the output has one row per subject; within each row, the net matrix is unwrapped into 1D.
%%% the r2z transformation estimates an empirical correction for autocorrelation in the data.
netmats0= nets_netmats(ts,0,‘cov’); % covariance (with variances on diagonal)
netmats0a= nets_netmats(ts,0,‘amp’); % amplitudes only - no correlations (just the diagonal)
netmats1= nets_netmats(ts,1,‘corr’); % full correlation (normalised covariances)
netmats2= nets_netmats(ts,1,‘icov’); % partial correlation
netmats3= nets_netmats(ts,1,‘icov’,10); % L1-regularised partial, with lambda=10
netmats5= nets_netmats(ts,1,‘ridgep’); % Ridge Regression partial, with rho=0.1
netmats11= nets_netmats(ts,0,‘pwling’); % Hyvarinen’s pairwise causality measure
%%% view of consistency of netmats across subjects; returns t-test Z values as a network matrix
%%% second argument (0 or 1) determines whether to display the Z matrix and a consistency scatter plot
%%% third argument (optional) groups runs together; e.g. setting this to 4 means each group of 4 runs were from the same subject
[Znet1,Mnet1]=nets_groupmean(netmats1,1); % test whichever netmat you’re interested in; returns Z values from one-group t-test and group-mean netmat
[Znet5,Mnet5]=nets_groupmean(netmats5,1); % test whichever netmat you’re interested in; returns Z values from one-group t-test and group-mean netmat
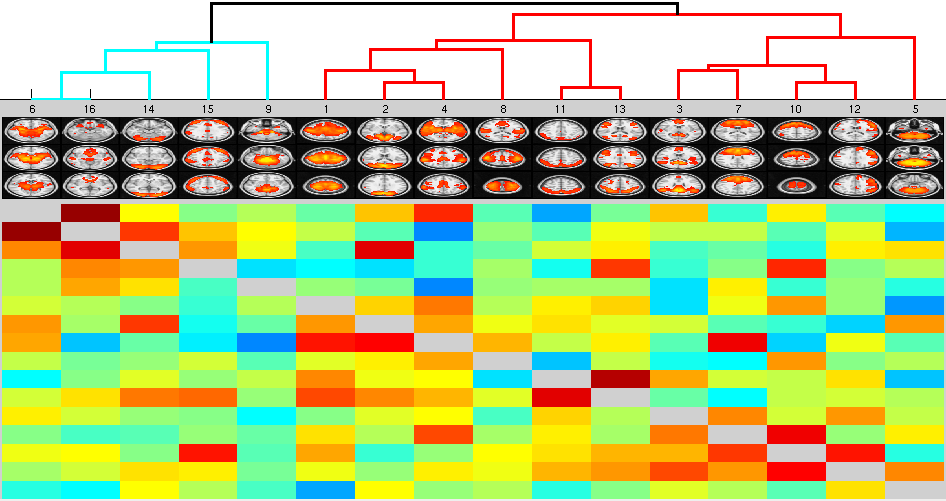
%%% view hierarchical clustering of nodes
%%% arg1 is shown below the diagonal (and drives the clustering/hierarchy); arg2 is shown above diagonal
nets_hierarchy(Znet1,Znet5,ts.DD,’/Users/knameth/Desktop/FAB/FSLNets/groupICA156.sum’);
%%% view interactive netmat web-based display
nets_netweb(Znet1,Znet5,ts.DD,group_maps,‘netweb’);
%%% cross-subject GLM, with inference in randomise (assuming you already have the GLM design.mat and design.con files).
%%% arg4 determines whether to view the corrected-p-values, with non-significant entries removed above the diagonal.
[p_uncorrected,p_corrected]=nets_glm(netmats1,‘design.mat’,‘design.con’,1); % returns matrices of 1-p
%%% OR - GLM, but with pre-masking that tests only the connections that are strong on average across all subjects.
%%% change the “8” to a different tstat threshold to make this sparser or less sparse.
%netmats=netmats3; [grotH,grotP,grotCI,grotSTATS]=ttest(netmats); netmats(:,abs(grotSTATS.tstat)<8)=0;
%[p_uncorrected,p_corrected]=nets_glm(netmats,‘design.mat’,‘design.con’,1);
%%% view 6 most significant edges from this GLM
nets_edgepics(ts,’/Users/knameth/Desktop/FAB/FSLNets/groupICA156.sum’,Znet1,reshape(p_corrected(1,:),ts.Nnodes,ts.Nnodes),6);
%%% simple cross-subject multivariate discriminant analyses, for just two-group cases.
%%% arg1 is whichever netmats you want to test.
%%% arg2 is the size of first group of subjects; set to 0 if you have two groups with paired subjects.
%%% arg3 determines which LDA method to use (help nets_lda to see list of options)
[lda_percentages]=nets_lda(netmats3,40,1)
%%% create boxplots for the two groups for a network-matrix-element of interest (e.g., selected from GLM output)
%%% arg3 = matrix row number, i.e. the first component of interest (from the DD list)
%%% arg4 = matrix column number, i.e. the second component of interest (from the DD list)
%%% arg5 = size of the first group (set to -1 for paired groups)
nets_boxplots(ts,netmats3,1,7,36);
%print(’-depsc’,sprintf(‘boxplot-%d-%d.eps’,IC1,IC2)); % example syntax for printing to file