Hello again.
When I run this (where D is a freshly-loaded EPI.nii, and array_data is a numpy array computed on D and its friends):
array_img = nl.image.new_img_like(D, array_data)
resamp_ai = nl.image.resample_to_img(array_img,anatpath+anatname,interpolation='linear')
fig = plt.figure(figsize=(20,5.5))
cc = (2,-53,10)
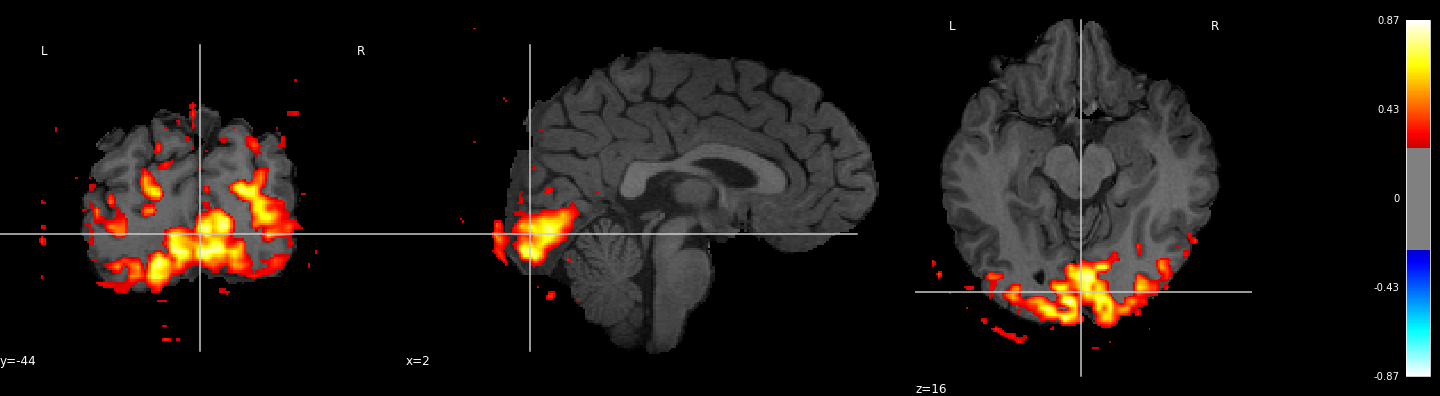
plotting.plot_stat_map(resamp_ai,anatpath+anatname,threshold=0.25,figure=fig)
I get a nice image (cannot upload because i am new, see reply below) where everything is there where it should be (seems to me) - i.e. the stat map is drawn onto the T1, and everything looks right.
But then when I try:
cc = (2,-53,10)
view = plotting.view_img(resamp_ai,anatpath+anatname,threshold=0.25)

view
I get:
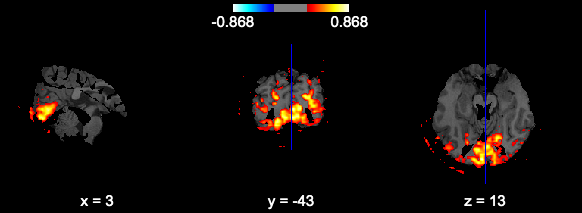
At first glance seems ok, but in fact the volumes are all masked incorrectly (you can see black ventricle holes where there shouldn’t be, round clipping around the edges), and the coordinates are not the same.
So, view_img thinks the images are oriented differently and in a different position than they actually are.
I suspect there is something wrong in one of the nifti objects and only view_img is picking it up, but… what could it be?
thanks again
-andrew