Hi there. I have an fMRI of my own brain that I’m curious to visualise. I’m not sure what kind it is though.
If it helps at all, the folder name is 202210131240_AWP79013_20_ep2d_11mm_TR2600_SMS3_ipat2_258vol_run1.
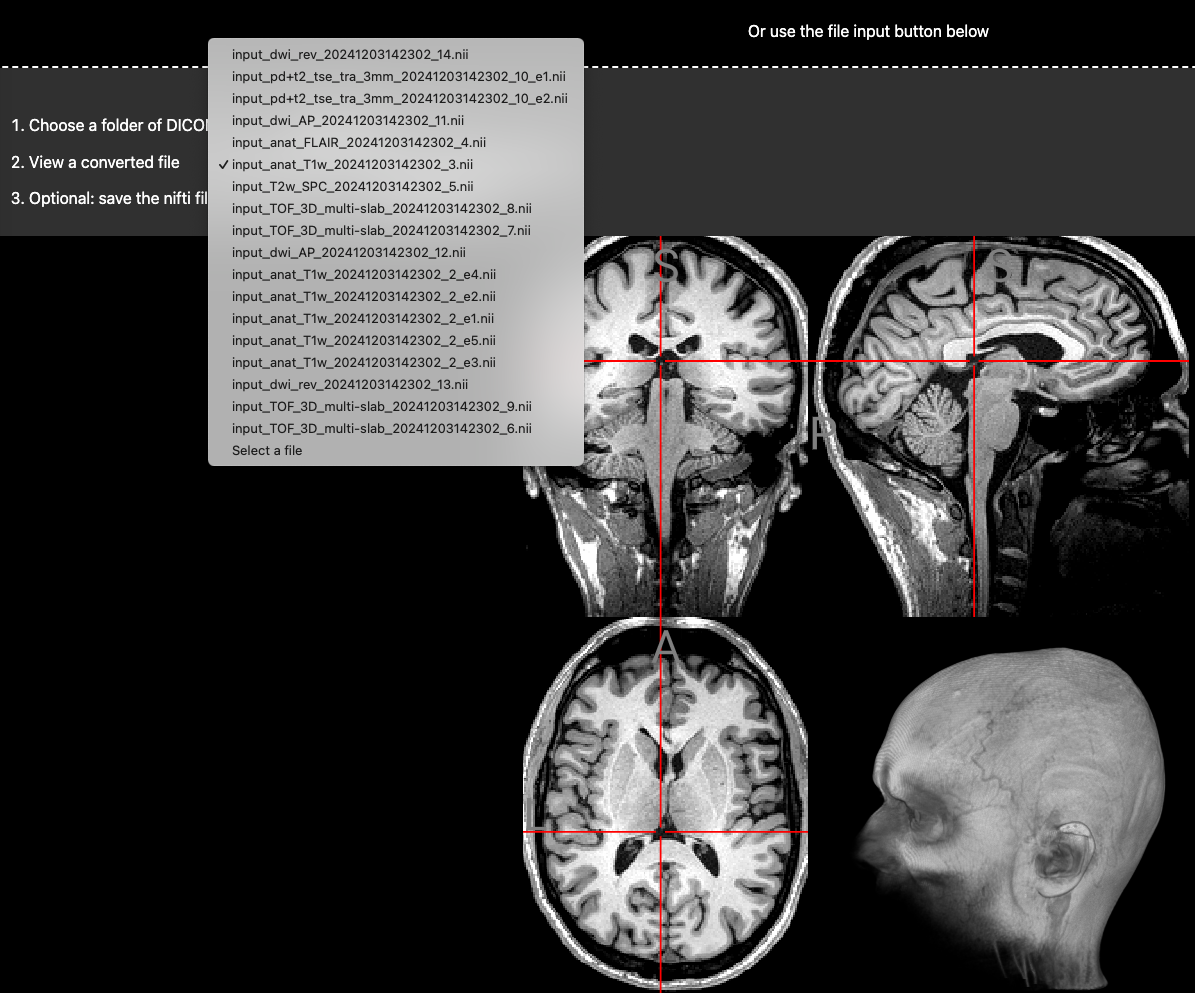
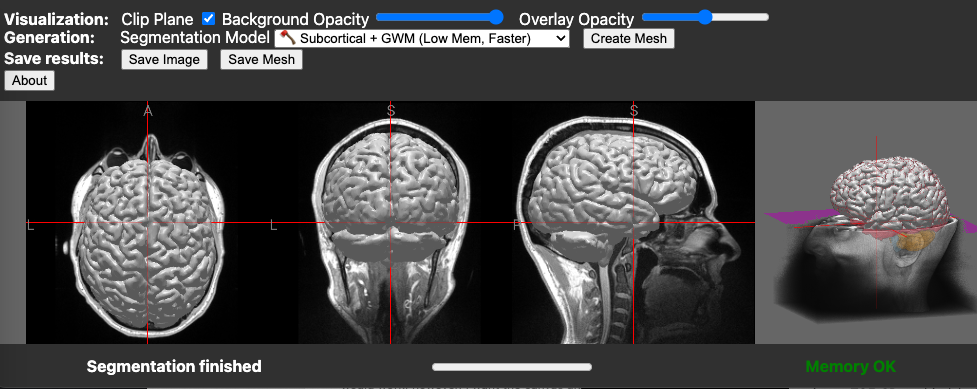
I also have a bunch of other dicoms, localisers, t2s, mprage, etc.
The fMRI in question started as a stack (85) of individual dicoms. Each dicom was a panel of 11x11 images. I reordered it to give HWDT using the following code:
import pydicom as dicom
import numpy as np
from pathlib import Path
import nibabel as nib


def get_3d_dicom(path: Path, grid: tuple[int, int]) -> np.ndarray:
    ds = dicom.dcmread(path)
    arr: np.ndarray = ds.pixel_array

    old_shape = np.array(arr.shape)
    new_shape = old_shape // grid
    assert np.all(new_shape * grid == old_shape)

    image_list = []
    for i in range(grid[0]):
        idx_i = i * new_shape[0]
        for j in range(grid[1]):
            idx_j = j * new_shape[1]
            sub_image = arr[idx_i:idx_i + new_shape[0], idx_j:idx_j + new_shape[1]]
            image_list.append(sub_image)
    arr = np.array(image_list)
    return np.moveaxis(arr, 0, -1)


def get_4d_dicom(directory: Path, grid: tuple[int, int]) -> np.ndarray:
    image_list = []
    for dicom_file in directory.glob("*.dcm"):
        arr = get_3d_dicom(dicom_file, grid)
        image_list.append(arr)
    arr = np.array(image_list)
    return np.moveaxis(arr, 0, -1)


def main() -> None:
    dicom_directory = Path("/path/to/dicom")

    arr = get_4d_dicom(dicom_directory, (11, 11))
    print(arr.shape)

    # save 4D array as nii.gz
    nii = nib.Nifti1Image(arr, np.eye(4))
    nii.to_filename(f"{dicom_directory.stem}.nii.gz")
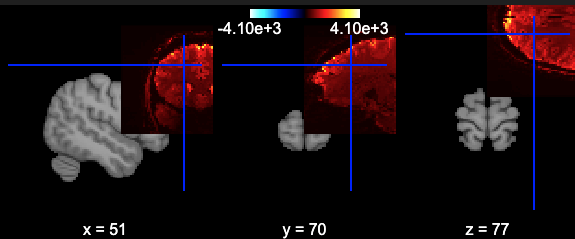
I’m wondering how I can visualise the data. I followed some of the basic examples in the nilearn documentation, but they are poorly aligned.
from nilearn import plotting
from nilearn.image import mean_img
from pathlib import Path
fmri_filename = sorted(Path(".").glob("*.nii.gz"))[0]
plotting.view_img(mean_img(fmri_filename, copy_header=True), threshold=None)
gives:
I’m also not sure what data I have so not sure what processing is appropriate.
Would appreciate any pointers! ![]()