Hello everyone.
I was trying to visualize a functional image on MATLAB with the volshow function with the following code:
path = "func.nii.gz"; % Path to anatomical NifTi file
V = niftiread(path); % Load NifTi file
Vm = mean(V,4); % Mean across time
volshow(Vm);
Is there any way I can get rid of the black part?
I was trying to normalize the file with the formula:
V_norm = (Vm - Vmin)./(Vmax - Vmin)
where Vmin and Vmax are the minimum and maximum values of the whole volume, respectively. But it displays the same thing.
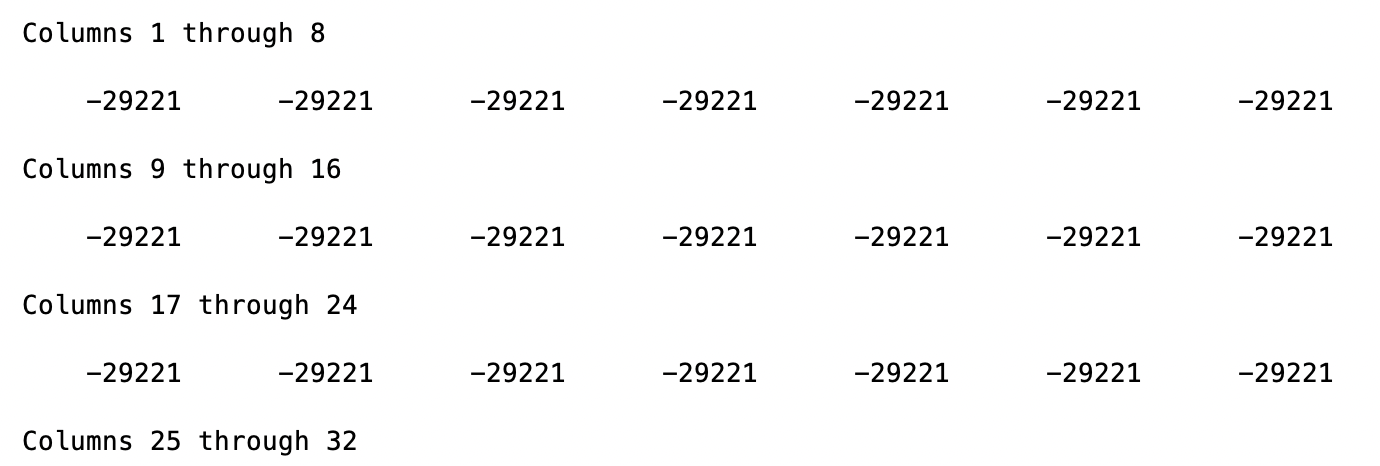
The problem is that displays -29221, which represents “nothing”, as black. And I want to get rid of that. Is there any way I can fix this?
Thank you in advance.
Hi @blancoarnau,
Try using Alphamap property. You can assign alpha values following an exponential function to make your low values more transparent (less visible) than the higher ones. Also, it would be useful if you can give an idea of your whole value range (e.g. with a histogram) if the alphamap does not help.
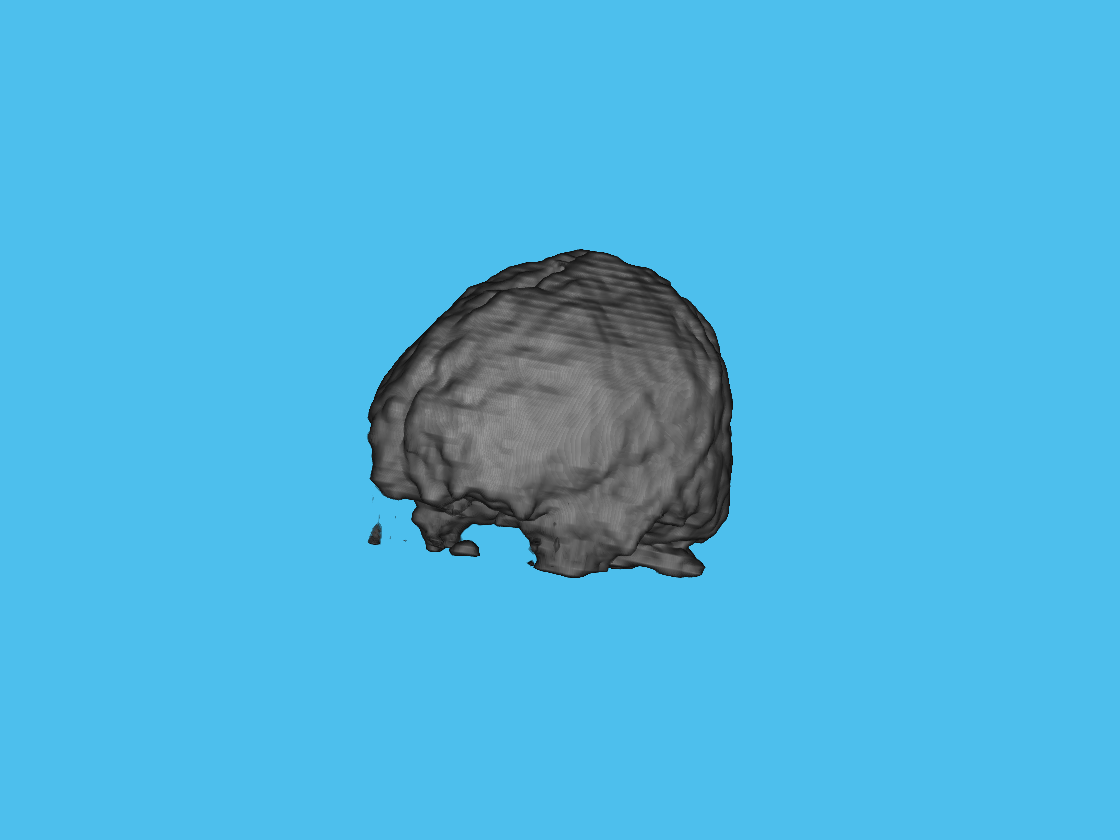
Mmm… I tried to do it this way:
step = 1/256;
i = 0:step:1-step;
a = 0.1;
N = (exp(a.*i(end)) - exp(a.*i(1)));
alpha = (exp(a.*i)-1)./N;
volshow(V,'Alphamap',alpha');
So that the values in alpha go from 0 to 1 in an exponential manner:
But I was still getting the same result:
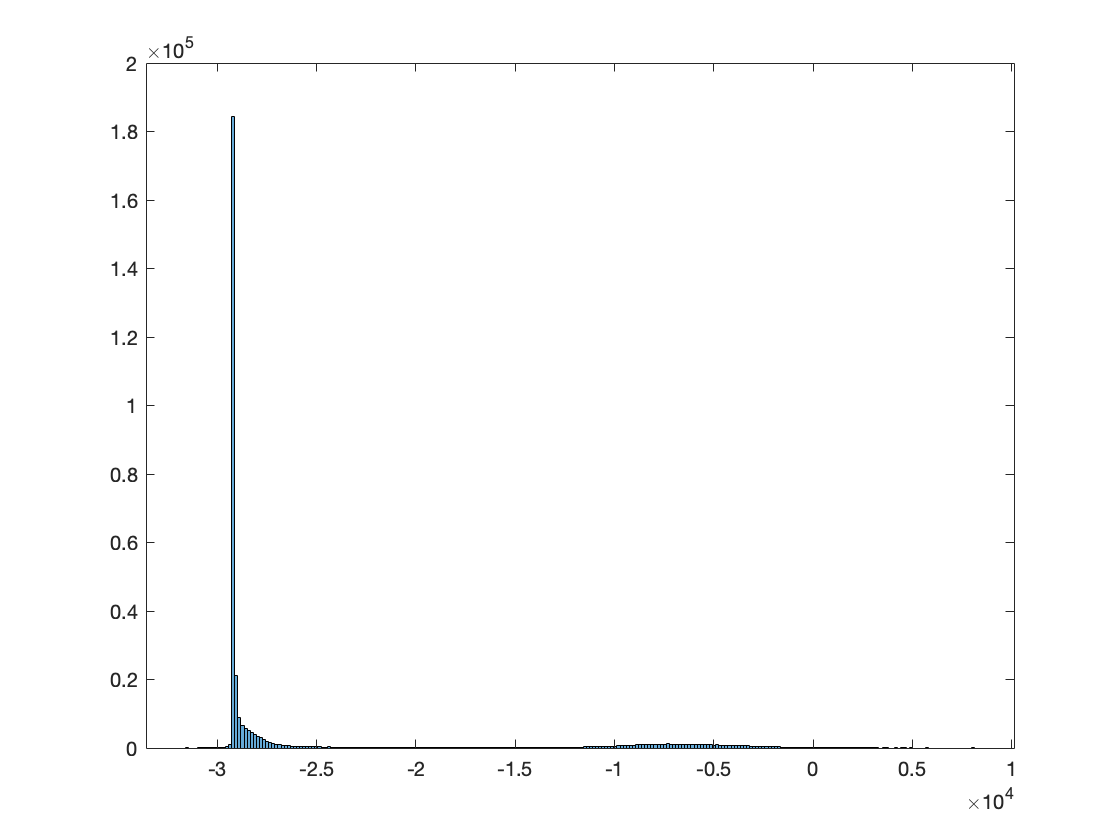
The histogram of my volume is the following:
So, what I did in the end was to define alpha in the following way:
alpha = (0:255)/256;
alpha(1:100) = 0;
Problem solved, thanks!
1 Like