Dear Steven,
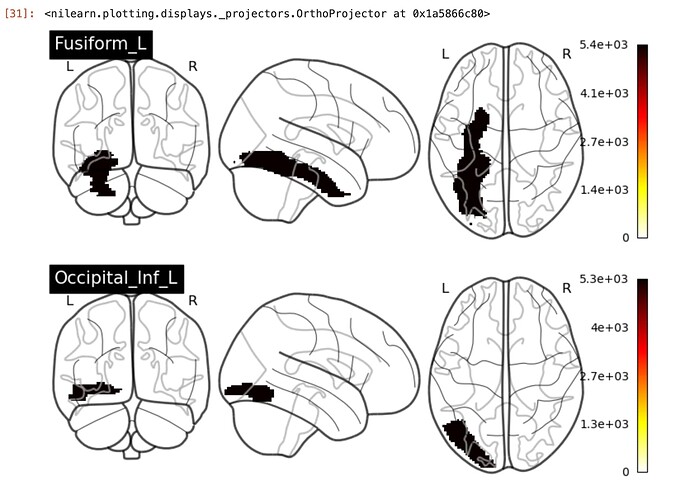
Concerning these regions, how can I plot these regions in different colors within each region.
E.g. Temporal_Inf_R is completely in red with this code below, but how can I have it randomly in red and yellow:
 import matplotlib.pyplot as plt
import numpy as np
import nilearn.datasets
import nilearn.plotting
import nilearn.image
from matplotlib.colors import LinearSegmentedColormap, Normalize
from matplotlib.colorbar import ColorbarBase


# Load the AAL atlas
aal = nilearn.datasets.fetch_atlas_aal(version='SPM12')

# Define the regions and their corresponding labels
regions = {
    'Temporal_Inf_R': 8302,
    'Frontal_Inf_Orb_L': 2321,
    'Frontal_Inf_Oper_R': 2302,
    'Frontal_Mid_Orb_R': 2212,
    'Postcentral_R': 6002,
    'Frontal_Sup_Medial_L': 2601
}

# Load AAL image
aal_img = nilearn.image.load_img(aal.maps)
aal_affine = aal_img.affine
aal_data = aal_img.get_fdata()

# Define colormap ranges
yellow_range = (5, 7)
blue_range = (1, 3)

# Create a smooth transition colormap from blue to yellow
colors = [(0, 'blue'), (0.5, 'yellow'), (1, 'red')]  # Ensure the colormap starts at 0 and ends at 1
cmap = LinearSegmentedColormap.from_list('custom_cmap', colors)

# Create a figure with multiple plots for each region
fig, axes = plt.subplots(2, 3, figsize=(15, 10), gridspec_kw={'hspace': 0.5, 'wspace': 0.3})

# Iterate over each region and plot on a glass brain
for i, (region_name, label) in enumerate(regions.items()):
    # Create a mask for the current region
    region_data = aal_data.copy()
    region_data[region_data != label] = 0

    # Define colormap and title based on region category
    if region_name in ['Temporal_Inf_R', 'Frontal_Inf_Orb_L', 'Frontal_Inf_Oper_R']:
        region_cmap = cmap # Use the custom colormap for yellow range
        title = f'{region_name} (Yellow)'
    else:
        region_cmap = 'Blues'  # Use default 'Blues' colormap for blue range
        title = f'{region_name} (Blue)'

    # Create a new Nifti image for the current region
    region_img = nilearn.image.new_img_like(aal_img, region_data, affine=aal_affine, copy_header=True)

    # Plot the region on a glass brain with custom colormap
    row = i // 3
    col = i % 3
    display = nilearn.plotting.plot_glass_brain(region_img, title=title, colorbar=False, axes=axes[row, col],
                                                cmap=region_cmap, threshold=0.3)

# Add a single colorbar for all plots
cbar_ax = fig.add_axes([0.95, 0.15, 0.03, 0.7])  # Position of the colorbar
norm = Normalize(vmin=1, vmax=7)  # Adjust these limits as per your data

# Create a colorbar using ColorbarBase
cbar = ColorbarBase(cbar_ax, cmap=cmap, norm=norm, orientation='vertical')
cbar.set_ticks([blue_range[0], yellow_range[0], yellow_range[1], blue_range[1]])  # Define tick locations
cbar.set_ticklabels([str(blue_range[0]), str(yellow_range[0]), str(yellow_range[1]), str(blue_range[1])])  # Define tick labels
cbar.ax.tick_params(labelsize=10)  # Adjust tick label size
cbar.set_label('Intensity', fontsize=12)  # Set colorbar label

# Adjust layout
plt.tight_layout()

# Show the plot
plt.show()
