Hi!
When I play with this demo, I have some thoughts I may want to discuss with you.
I suppose that the location of a visual target is clear and close, so people have a small standard deviation (1) in the visual distribution. And participants have good auditory ability to distinguish and identify the location of the audio source, thus I use a small standard deviation(1) in auditory likelihood distribution as well.
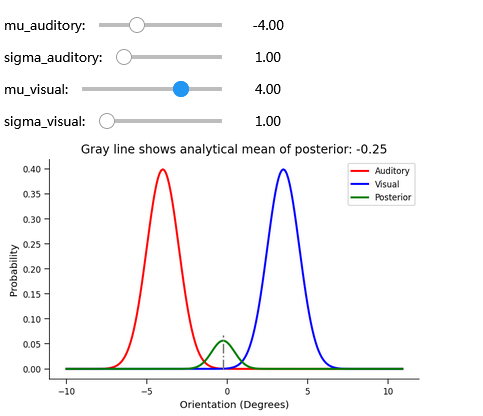
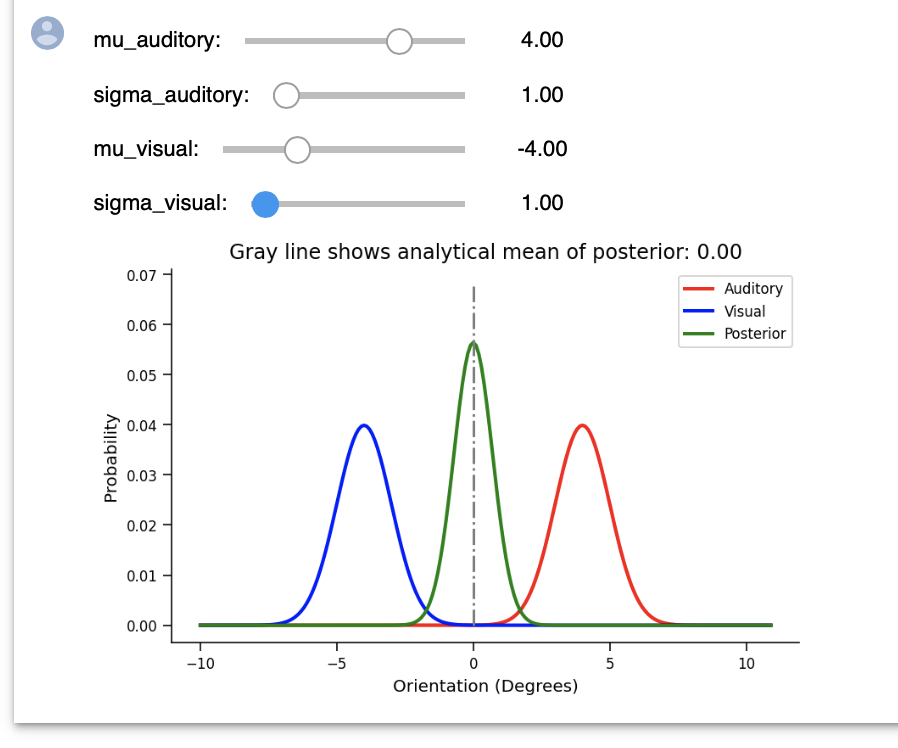
If the two distributions are very far apart: the visual target(+4) is probably not the source of audio, and people hear that the sound comes from the opposite direction (-4). The real location of the sound source lies between these two distributions, when both of their probabilities are low.
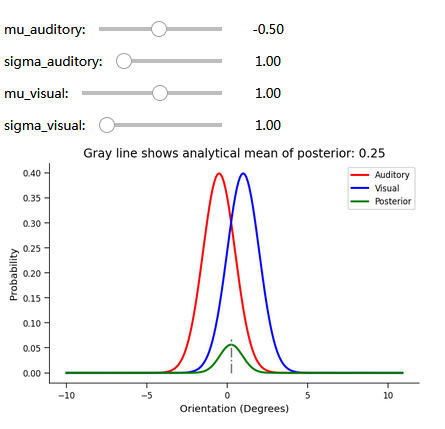
If the two distributions are very close to each other: the visual target(+1) is nearly the right place of sending the sound, and the audio judgment(-0.5) is almost correct, too. The real location distribution is at the overlapping area of these two.
The first phenomenon is interesting… 

The second phenomenon shows that the real location is probably a reinforcement result of the two observations. Visual and audio perceptions could put together to make a more accurate judgment, and people could make a better prediction with two of these inputs - but the brain’s judgment “auditory distribution” is within a certain confidence level, anyway. This shows how the brain works.  BTW, I would expect the posterior integration to be 1, which should seem to be equivalent to other curves in area.