I’m new to MRIQC and I need your help on a little issue with my first run.
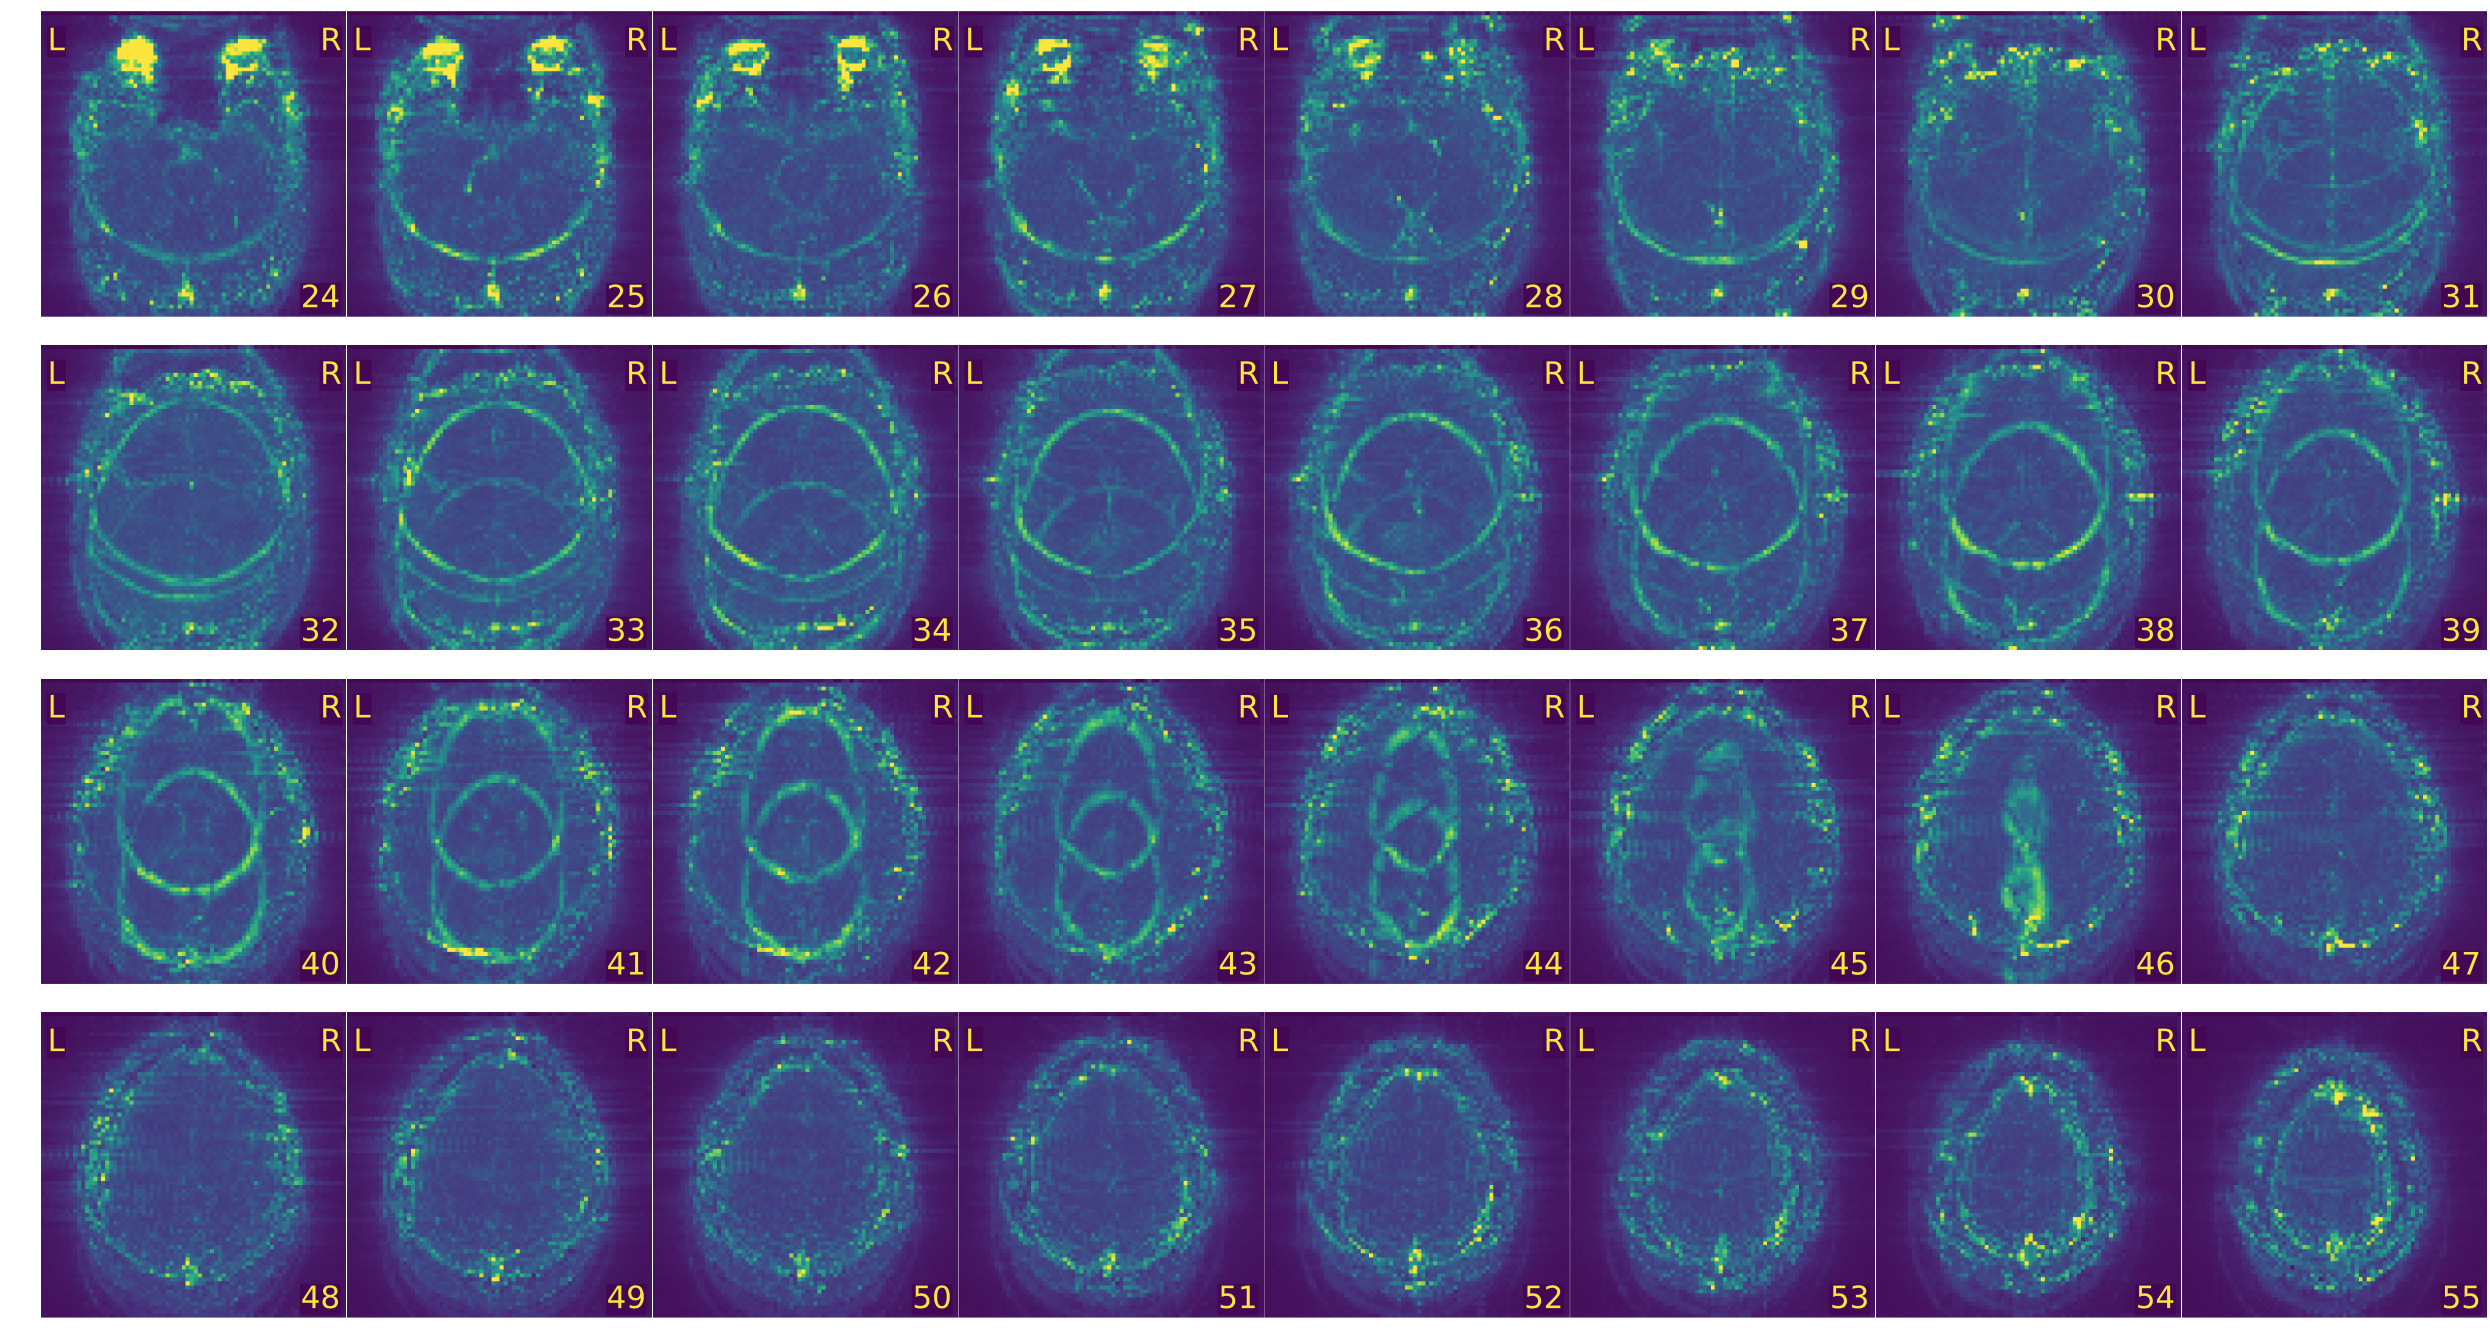
On the standard deviation map of my visual reports for my fMRI, I’m having those weird circles. For some subjects, they are really there and for others they are almost invisible.
Here a screenshot of this issue.
Many thanks for your answers. Indeed, we acquired the data with a multi band acquisition (Multi Band MB2 GRAPPA iPAT2 with TR = 1430).
My concern is that when I am taking a look at the images with a classic viewer (fsleyes) I don’t see the ghosting effect which occurs only in the standard deviation map from mriqc.
That’s why I am a little bit confused …
Please let me know if you have any further question.
It’s normal for some types of artifacts to show up in standard deviation (or tSNR) images much more clearly than single frames - that’s why it’s important to calculate them. I’d guess that the ringing in one direction is from the multiband, and the other from the GRAPPA (which are presumably at right angles to each other).
Regardless, with this level of artifact I’d really consider changing the acquisition parameters (and/or coil, head packing, etc.) and doing more piloting - you want brain structure (big vessels, etc.) to show up brightest in the standard deviation images, not artifacts.
You don’t show the mean EPI image to compare, but I assume that in slices 42-46 the brain fills most of the image, doesn’t it? So the fact that the ghosting artifacts are small “rings” (actually, the outline of the head) means this is signal leaking from more superior slices.
So, it could go away if you use “slice-leak-block” for the SMS reconstruction, in case you are not using it (in general, it is always advised to use it).
Also, what head coil are you using? Maybe a total acceleration factor of 4 (MB 2 x GRAPPA 2) is too high for your specific coil?
@pvelasco thank you very much for your insight
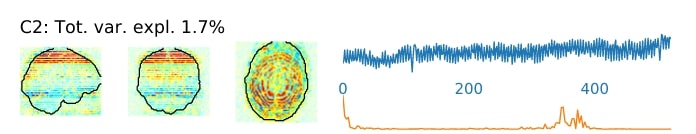
Indeed I think that you are right regarding the signal leaking from superior slices (as it can be seen in the C2 component of the ICA). I am not familiar with the “slice-leak-block” for the SMS reconstruction, but I assume that I cannot be done after the acquisition of the data…
We are trying to extract the “ghosted” components with melodic, but I don’t know to what extent it will work… Again I am surprised not to see anything on the raw images…
Yes, once the raw data (the scanner signal, for each channel) has been discarded, you cannot re-reconstruct the images using a different algorithm. Your approach of using melodic is probably your best shot at cleaning the data.
You probably don’t see it in the raw images because the “rings” --superimposed to the baseline signal from the brain-- are low intensity compared to the signal from the brain. But the signal from which those rings are aliased from (most likely C2) fluctuates a lot over time. So the signal from the places where the rings are has a higher std than neighboring voxels without the ring signal on them. E.g., if your baseline signal in the brain is 100, with a low std (say, 0.1), but you have a signal superimposed to it on some of the voxels of mean 0 and std 1, which fluctuates a lot. Because the size of the superimposed signal for any single volume will be about 1% up or down compared to the voxels where there is no artifact, you won’t see it in an individual image. And, because the mean superimposed signal is 0, you won’t see any rings in the average image. But, because the std is much larger than the std of the baseline signal, you will see it in a STD map. Does it make sense?
Moving forward, I agree with @jaetzel: you should consider changing your acquisition parameters. I would suggest you drop the iPAT and increase the MB factor to 3 or 4 (depending on which head coil you are using). And, if you can, choose the “slice-leak-block” reconstruction.
I just completed the first run of mriqc on some functional data and I would like to get others opinions on the tSNR maps output. I have three different functional sequences (2 active tasks and 1 rest - this is Multiband) and in most of them there is this sort of circle around the brain and in the middle that I have not seen before. The lines are very subtle but in some slices it kind of looks like there are two brains overlapped and given what discussed above I want to make sure that we are not getting some artefacts. For this subject, the maps look very similar across the three different tasks so I attached only one example (from one of the active task) https://drive.google.com/open?id=1Vtv1NHhN0XFRA87NNqW9jmhqgvnFdYgj
Any suggestion would be appreciated. Thank you in advance!
I only just noticed this post, but this looks very much like what I’ve called “crescents”, and what physicists have said are likely due to insufficient fat suppression. Is this a PA acquisition? I have a few examples of them in https://mvpa.blogspot.com/2018/01/holy-crescents-batman.html.
If it is the same artifact, we see them in less than half the people, but they are very stable - if someone has them (or not), they have them (or not) in sessions spread out over months.