Hi everyone!
I was performing a first level analysis for each individual trial on my fmri data prior to a searchlight analysis. I had a check on the corresponding mean z_maps (so the contrast is 1 for a trial and 0 for the rest - I concatenated all z values into one nii.gz files giving me 4D array with x,y,z, and trial number) but this is what I found for my first subject:
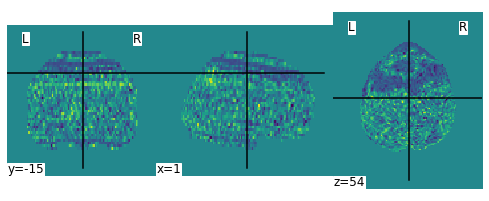
I thought that the pattern looked somewhat weird, so I had a look at the corresponding carpet plot for that subject and trial, that you can find bellow:
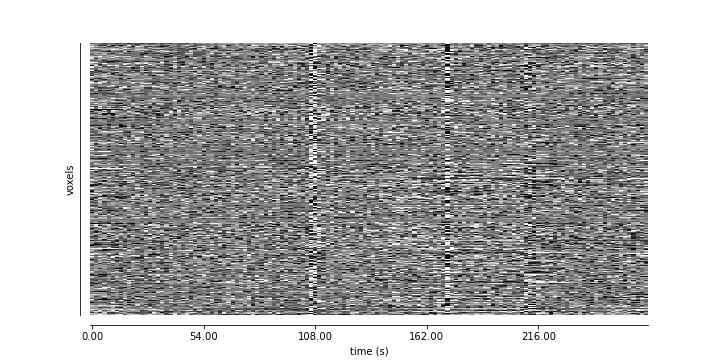
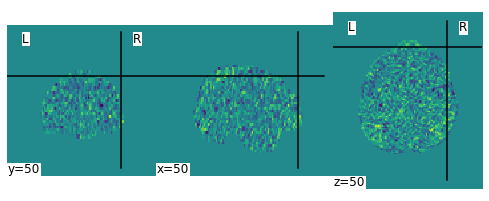
Do you think this image is ‘normal’? It looks to me like there has been some big confound in it, but I cannot seem to find anything really off from the carpet plot (but maybe I have been looking at the wrong place). I also only have this for this particular run and participant, the other mean images I have are looking more like this:
Thanks for your help! 