I am looking at the power spectral density of the preproc_bold.nii.gz files and am getting some weird results.
Usually the PSD of a BOLD fMRI signal looks something like this: (log-log)
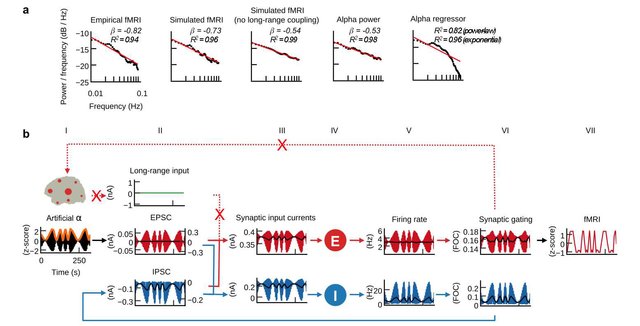
Where we have a high power at low frequency, and a low power at high frequency
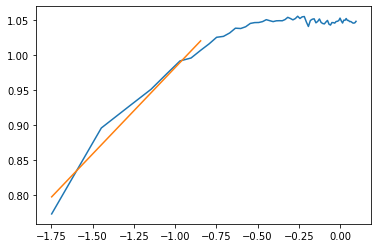
But the PSD for the dHCP preproc_bold.nii.gz files look like this:
You can also see a similar thing on FSLeyes in a single voxel using view → power spectra, and then adjust to log-log plot
This is the opposite of what I usually see in the BOLD fMRI signal… like mirror image along a vertical axis… (flipped left to right w.r.t. frequency)
Is this due to something that was done in the preprocessing?
Anyone have any insight?
Cheers