I m working on producing tractography from mice data acquired from a Bruker small animal MRI machine. In the pastI I have been relatively successful from a Machine in Trento (Italy),https://www.nature.com/articles/s41598-018-37300-4 , now trying the same on a similar machine in Zurich, things are going weird.
First of all it seems the produced bval are too high. In fact it is raising the warning to increase the threshold.
gtab = gradient_table(bvals, bvecs, b0_threshold=150)
Then the tracts are non anatomically correct. I have created the Nifti DWI files, BVEC and BVAL by using Bru2nifti.
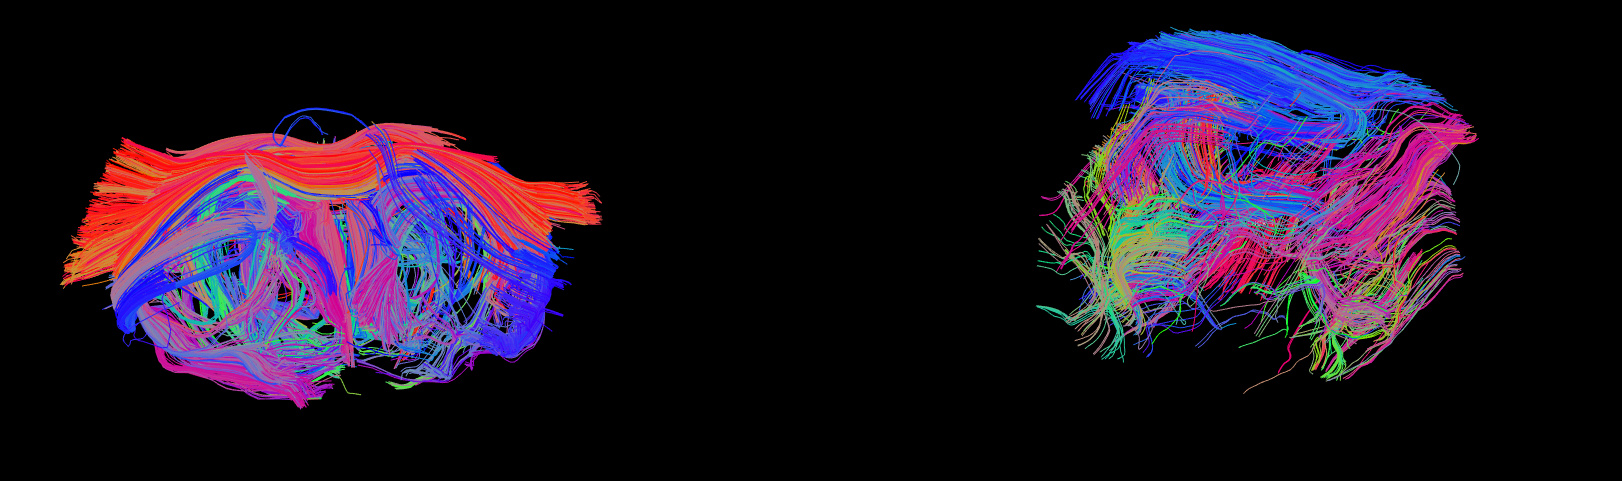
See here a good result in Trackvis from my previous data showing only the longest tracts (Left) and the new data (right).
Here the initial data
Vol: https://drive.google.com/file/d/1AC0ftqFasmTmolT8Ymy2PeNY86jKR-5C/view?usp=sharing
Bvec https://drive.google.com/file/d/1M8tWMN00NEu0mh06A73ndf2Uekh7Ih-u/view?usp=sharing
Bval https://drive.google.com/file/d/1BSWO8kM7L-5yp8A9gaBfXLTkvNUAEatf/view?usp=sharing
my resulting trk file and the code I used
https://drive.google.com/file/d/1CQcVM2PqJih_-05MuFce9e2uIP6aXJ6F/view?usp=sharing
changing FA, angle, and B0_threshold did not change the results
    import dipy
    import numpy as np
    import nibabel as nib
    from nibabel import trackvis as tv
    from dipy.tracking.streamline import set_number_of_points
    from dipy.segment.mask import median_otsu
    from dipy.io import read_bvals_bvecs
    from dipy.core.gradients import gradient_table
    from dipy.reconst.dti import TensorModel
    from dipy.reconst.dti import fractional_anisotropy
    from dipy.reconst.dti import color_fa
    from dipy.reconst.shm import CsaOdfModel
    from dipy.data import get_sphere
    from dipy.reconst.peaks import peaks_from_model
    from dipy.tracking.eudx import EuDX
    from dipy.tracking.utils import density_map
    from dipy.tracking import utils
    import matplotlib.pyplot as plt

    fimg = "Thy1_eddycorrected.nii.gz"

    img = nib.load(fimg)
    data = img.get_data()
    affine = img.get_affine()
    header = img.get_header()
    voxel_size = header.get_zooms()[:3]
    mask, S0_mask = median_otsu(data[:, :, :, 0])
    fbval = "Alphasyn_8_DwEffBval.txt"
    fbvec = "Alphasyn_8_DwGradVec.txt"

    bvals, bvecs = read_bvals_bvecs(fbval, fbvec)
    gtab = gradient_table(bvals, bvecs, b0_threshold=150)
    ten_model = TensorModel(gtab)
    ten_fit = ten_model.fit(data, mask)

    fa = fractional_anisotropy(ten_fit.evals)
    cfa = color_fa(fa, ten_fit.evecs)
    csamodel = CsaOdfModel(gtab, 6)
    sphere = get_sphere('symmetric724')

    pmd = peaks_from_model(model=csamodel,
                           data=data,
                           sphere=sphere,
                           relative_peak_threshold=.5,
                           min_separation_angle=25,
                           mask=mask,
                           return_odf=False)

    #Deterministic tractography
    eu = EuDX(a=fa, ind=pmd.peak_indices[..., 0], seeds=1000000, odf_vertices=sphere.vertices, a_low=0.2,ang_thr=75) #0.1
    affine = eu.affine
    csd_streamlines= list(eu)

    #Remove tracts shorter than 30mm
    #print np.shape(csd_streamlines)
    from dipy.tracking.utils import length
    csd_streamlines=[t for t in csd_streamlines if length(t)>30]

    #Trackvis
    hdr = nib.trackvis.empty_header()
    hdr['voxel_size'] = img.get_header().get_zooms()[:3]
    hdr['voxel_order'] = 'LAS'
    hdr['dim'] = fa.shape
    tensor_streamlines_trk = ((sl, None, None) for sl in csd_streamlines)
    ten_sl_fname = 'tensor_streamlines_ec_FA02_ang75.trk'
    nib.trackvis.write(ten_sl_fname, tensor_streamlines_trk, hdr, points_space='voxel')
    ```