Summary of what happened:
A custom atlas with 36 ROI regions was constructed using the in house segmentation technique. The XCP-D processing was carried with the aid of flag setting option –atlases to indicate the custom atlas utilization.
Command used (and if a helper script was used, a link to the helper script or the command generated):
apptainer run \
--cleanenv \
--bind /home/homesp/Projects \
--bind ${atlas} \
--bind ${DATA}:/data \
--bind ${APP_DERIV_DIR}:/outputs \
--bind ${WORK_DIR}:/work \
${APP} \
/data /outputs participant \
--participant-label ${Subject} \
--fs-license-file ${LIC}/license.txt \
-w /work \
--file-format nifti \
--mode linc \
--datasets thomascort8=${atlas}/thomascort8 \
--atlases THOMASCORT8
Version:
0.10.5
Environment (Docker, Singularity / Apptainer, custom installation):
Apptainer
Data formatted according to a validatable standard? Please provide the output of the validator:
PASTE VALIDATOR OUTPUT HERE
Relevant log outputs (up to 20 lines):
One or more execution steps failed (4). Error details are attached below.

Node Name: xcp_d_0_10_wf.sub_188_wf.postprocess_3_wf.connectivity_wf.connectivity_plot

Node Name: xcp_d_0_10_wf.sub_188_wf.postprocess_1_wf.connectivity_wf.connectivity_plot

Node Name: xcp_d_0_10_wf.sub_188_wf.postprocess_0_wf.connectivity_wf.connectivity_plot

Node Name: xcp_d_0_10_wf.sub_188_wf.postprocess_2_wf.connectivity_wf.connectivity_plot

Traceback (most recent call last):

File "/usr/local/miniconda/lib/python3.10/site-packages/nipype/pipeline/plugins/multiproc.py", line 66, in run_node

result["result"] = node.run(updatehash=updatehash)

File "/usr/local/miniconda/lib/python3.10/site-packages/nipype/pipeline/engine/nodes.py", line 525, in run

result = self._run_interface(execute=True)

File "/usr/local/miniconda/lib/python3.10/site-packages/nipype/pipeline/engine/nodes.py", line 643, in _run_interface

return self._run_command(execute)

File "/usr/local/miniconda/lib/python3.10/site-packages/nipype/pipeline/engine/nodes.py", line 769, in _run_command

raise NodeExecutionError(msg)

nipype.pipeline.engine.nodes.NodeExecutionError: Exception raised while executing Node connectivity_plot.

Traceback:

Traceback (most recent call last):

File "/usr/local/miniconda/lib/python3.10/site-packages/nipype/interfaces/base/core.py", line 401, in run

runtime = self._run_interface(runtime)

File "/usr/local/miniconda/lib/python3.10/site-packages/xcp_d/interfaces/connectivity.py", line 479, in _run_interface

ax = self.plot_matrix(

File "/usr/local/miniconda/lib/python3.10/site-packages/xcp_d/interfaces/connectivity.py", line 350, in plot_matrix

assert corr_mat.shape[0] == len(network_labels)

AssertionError
Screenshots / relevant information:
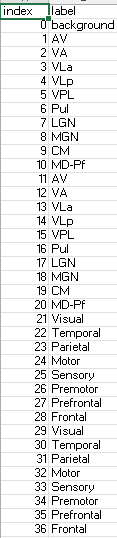
Parcellation Labels
Hi Tsalo,

Thank you.
We were able to generate the Connectivity plots after removing the background label.
But, we don't see the x-labels and y-labels in the plot.
I tried to upload the connectivity plots for reference, but .svg file was not supported here.
As such the x-labels and y-labels depict none.

Suhail