Hi NeuroStars community,
We recently ran XCP-D (v0.7.3) on outputs from fMRIPrep (v23.2.3) to perform post-processing on our dataset. Below is the Singularity command we used:
singularity run --cleanenv \
-B ${BASEDIR}/templates:/home/fmriprep --home /home/fmriprep \
-B ${OUTPUT_DIR}:/out \
-B ${FMRI_DIR}:/fmriprep \
-B ${WORK_DIR}:/work \
-B ${ORIG_FS_LICENSE}:/li \
${SING_CONTAINER} \
    /fmriprep \
    /out \
    participant \
    --participant_label ${SUBJECTS} \
    -w /work \
    --cifti \
    --fs-license-file /li \
    --smoothing 6 \
    --fd-thresh 0 \
    --dummy-scans 3 \
    --notrack
We performed quality control on the fMRIPrep outputs before running XCP-D. However, we’re seeking clarification on how best to interpret the two HTML reports generated by XCP-D:
sub-<label>.htmlsub-<label>_executive_summary.html
We’ve consulted the documentation and the main paper but would appreciate further guidance on the following points:
Questions
NiPreps style report
1. DVARS Interpretation
In some cases, we observed that post-processed DVARS values are slightly higher than those in the pre-processed data.
- Is this expected?
- Should this be considered a red flag?
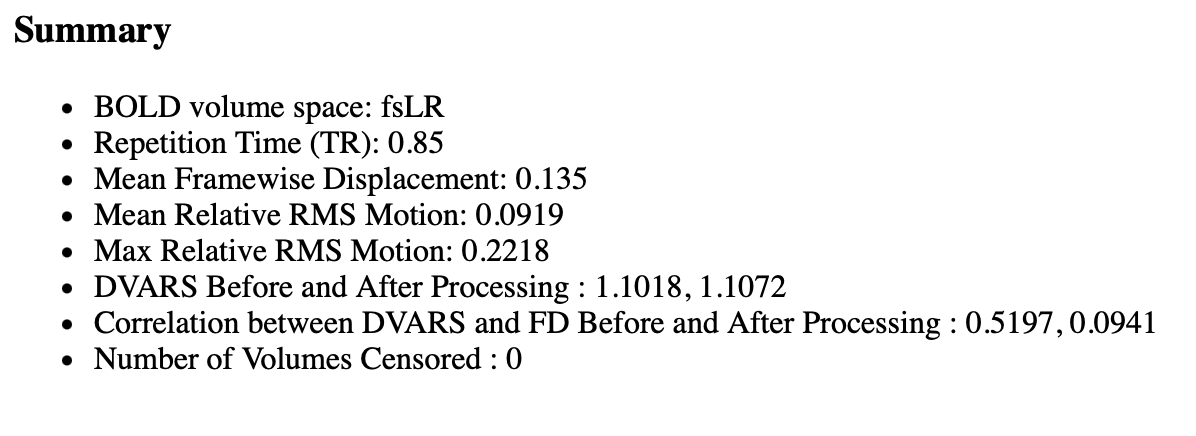
2. FD-DVARS Correlation
In the summary report, we noticed that the correlation between FD and DVARS decreased after post-processing, e.g., from 0.5197 to 0.0941.
- Is it correct to interpret this drop as evidence that the denoising strategy was effective?
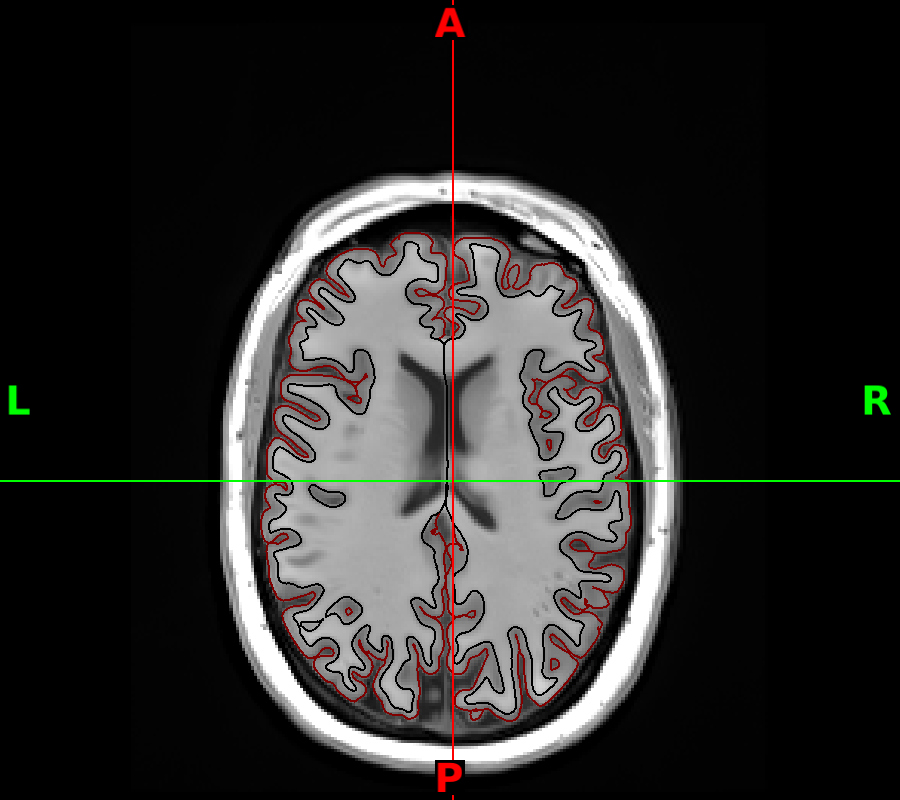
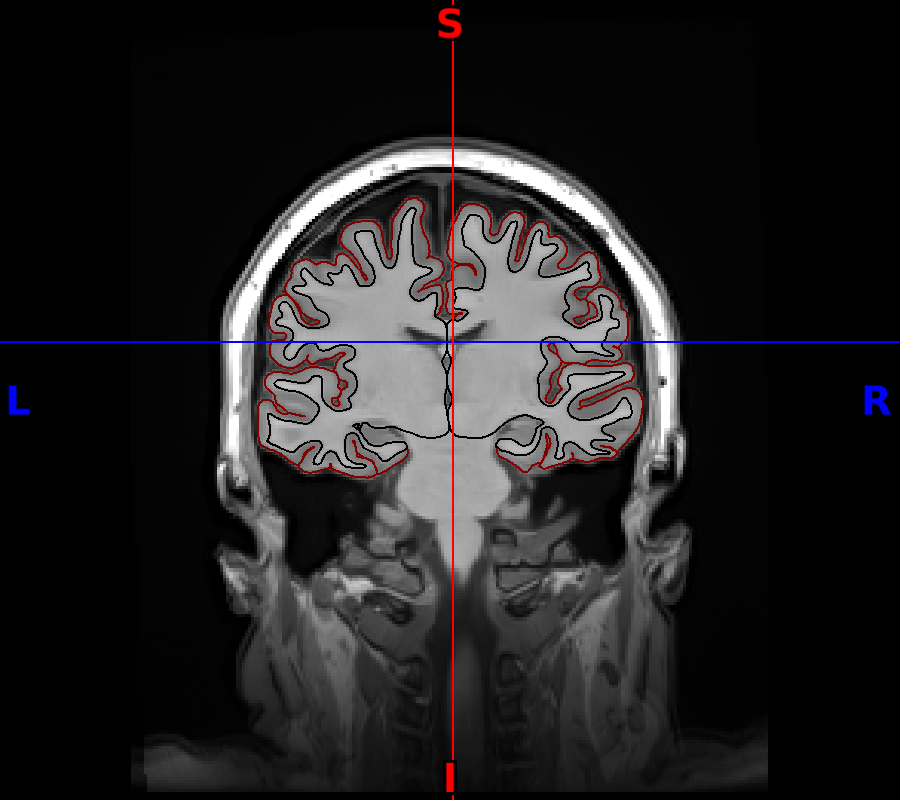
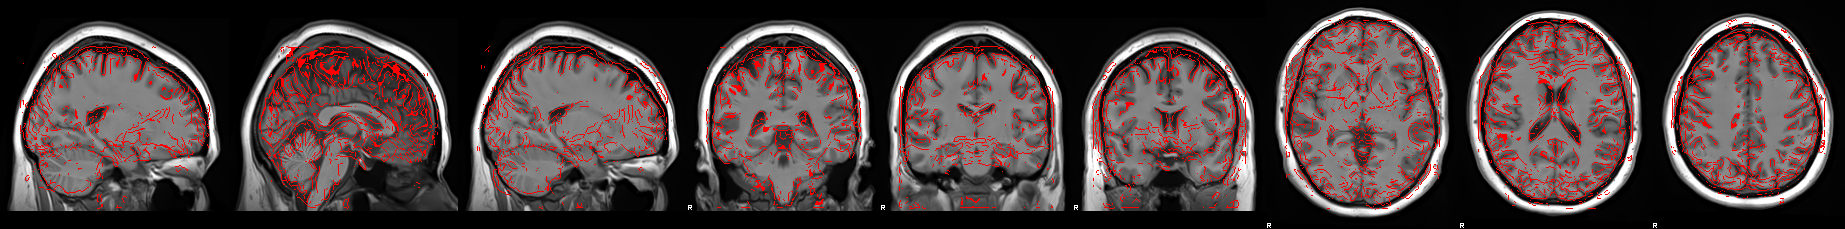
3. Registration Quality
We also reviewed the coregistration between the functional and T1w structural images.
This appear to be a good alignment?
Executive Summary Report
In the sub-<label>_executive_summary.html, we focused on the following:
1. Surface registration quality on the T1w image
This surface map looks good!!!
2. Contour plots showing T1w-to-task/task-to-T1w registration and normalization accuracy
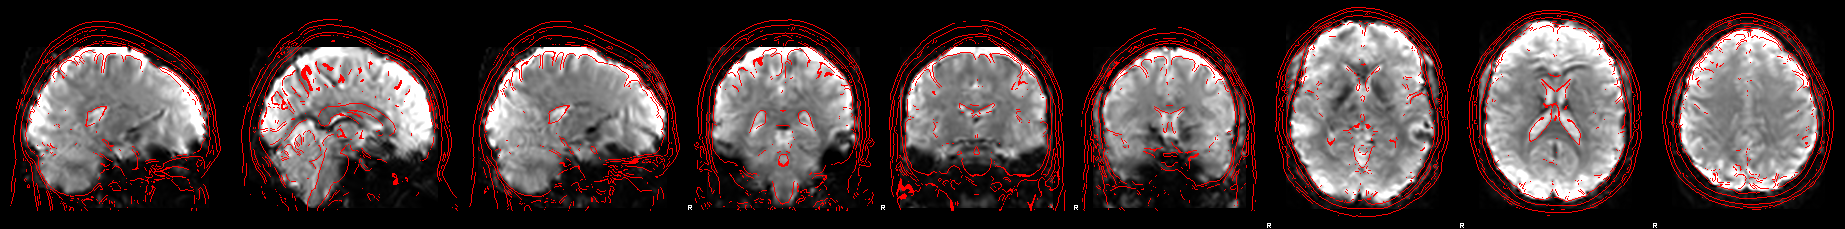
Does the Task-to-T1w contour look inaccurate to you?
3. Carpet plot to inspect pre and post processing denoise strategy
Pre
Post

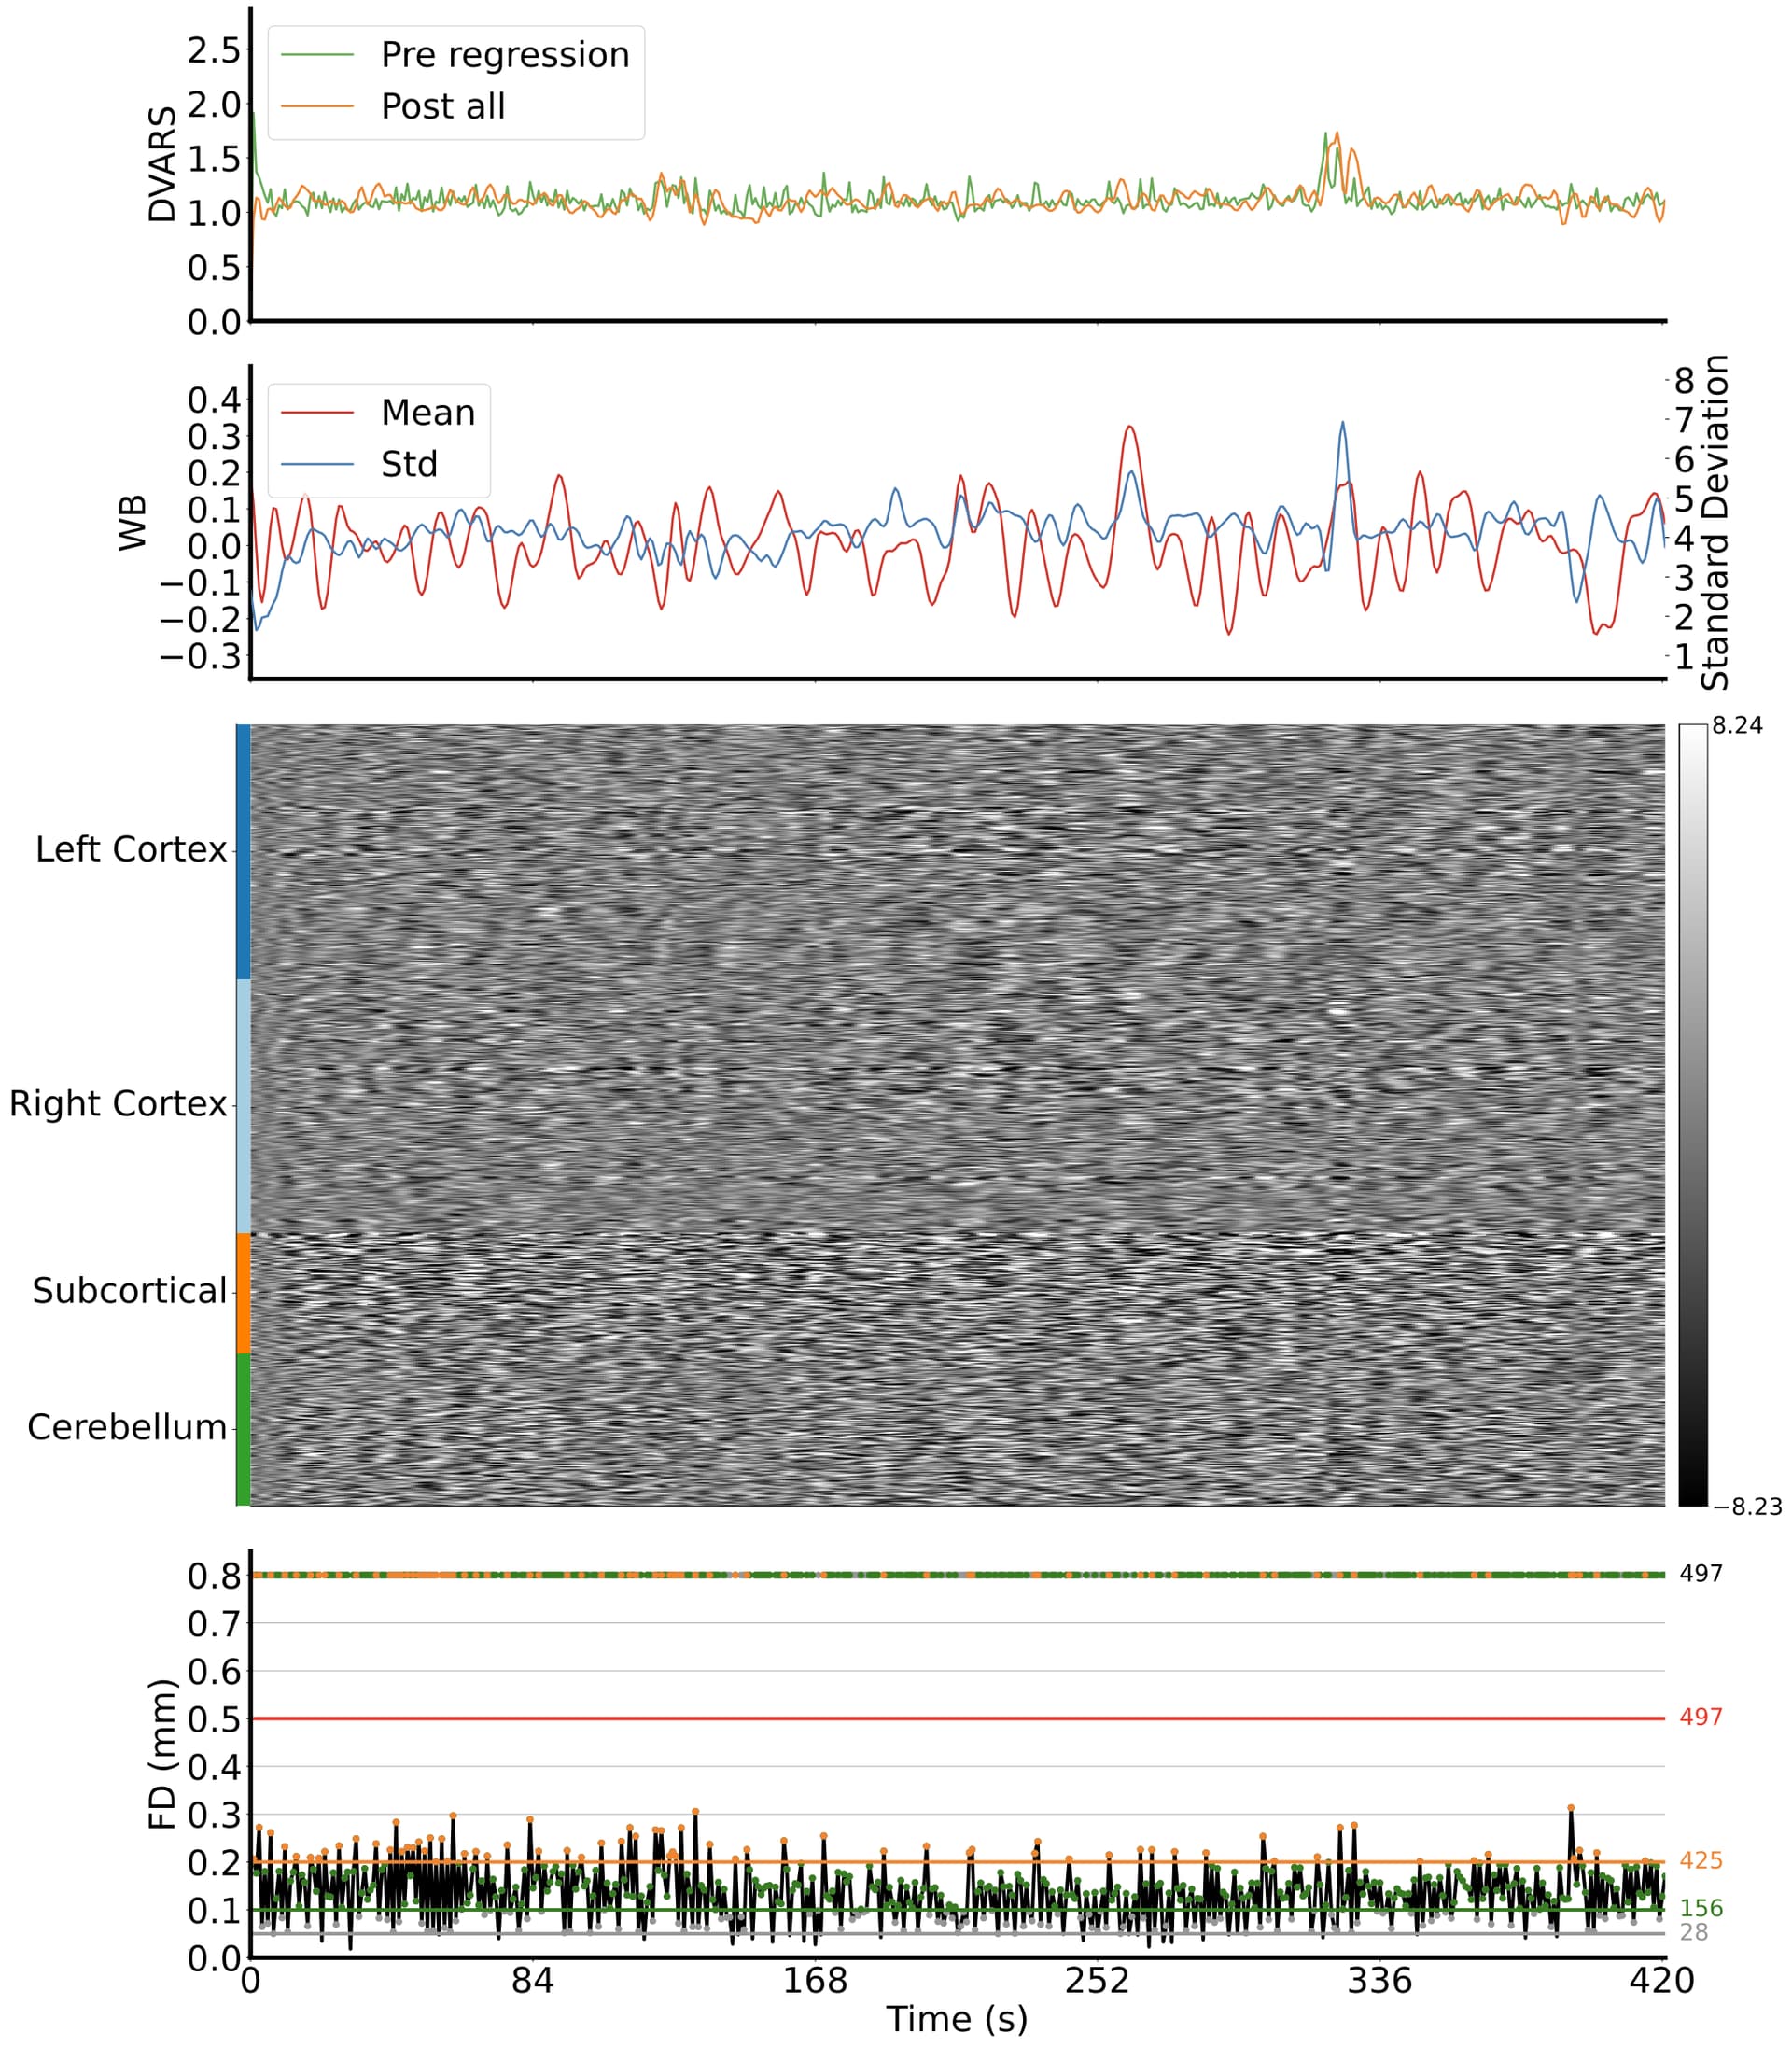
We found the post-processed results to be improved, based on both the Whole Brain time series and the regional BOLD signal plot.
 Final Question: QC Decision Criteria
Can these visualizations and metrics (DVARS, FD-DVARS correlation, coregistration, carpet plots, etc.) be used to make a PASS/FAIL decision for each subject?
- Are there recommended thresholds or standardized guidelines for making these QC decisions?
We appreciate any guidance or community standards that could help us streamline subject-level QC using these XCP-D reports.
Thanks in advance!
Thomas