How to create a connectome with ROIs that are not associated with a parcellation to compute FA values

Hello!

My goal is to compute FA values for tracks between ROIs that are not from an existing parcellation via mrtrix. I have my own ROIs (created from neurosynth and other atlases on fmriprep - I ran my fMRI analysis using these ROIs and would like to use the same ROIs for my structural analyses).

Thus far, I have finished preprocessing the DWI images and have .tck and FOD files from mrtrix outputs as well as other files (see below), and I have my ROIs in individual subject DWI spaces.

Is there a way for me to create a connectome using my own ROIs (without a parcellation)?

outputs I have:
sub-001_ses-1_space-T1w_desc-preproc_space-T1w_desc-tracks_ifod2.tck
sub-001_ses-1_space-T1w_desc-preproc_space-T1w_desc-csfFOD_msmtcsd.txt
sub-001_ses-1_space-T1w_desc-preproc_space-T1w_desc-csfFODmtnormed_msmtcsd.mif.gz
sub-001_ses-1_space-T1w_desc-preproc_space-T1w_desc-gmFOD_msmtcsd.txt
sub-001_ses-1_space-T1w_desc-preproc_space-T1w_desc-gmFODmtnormed_msmtcsd.mif.gz
sub-001_ses-1_space-T1w_desc-preproc_space-T1w_desc-mtinliermask_msmtcsd.nii.gz
sub-001_ses-1_space-T1w_desc-preproc_space-T1w_desc-mtnorm_msmtcsd.nii.gz
sub-001_ses-1_space-T1w_desc-preproc_space-T1w_desc-siftweights_ifod2.csv
sub-001_ses-1_space-T1w_desc-preproc_space-T1w_desc-tracks_ifod2.tck
sub-001_ses-1_space-T1w_desc-preproc_space-T1w_desc-wmFOD_msmtcsd.txt
sub-001_ses-1_space-T1w_desc-preproc_space-T1w_desc-wmFODmtnormed_msmtcsd.mif.gz
sub-001_ses-1_space-T1w_desc-preproc_space-T1w_msmtconnectome.mat

Please let me know if there’s any more information I should provide to help answer my inquiry - thank you!

Hi @fareshte,

You can use tck2connectome. You would need to combine your ROIs into a parcellation-like image, where it is a single image with different intensities for each ROI.

Best,
Steven

Happy to hear that! Thank you!

I looked up how to combine ROIs into a parcellation image and found this: Combining ROIs to form atlas/parcellation

Is that what you would recommend as the best way to go about doing so?

There’s no best way, really. For something simple like this (basically just adding images to each other), many different tools will give you the same output. Whatever works for you!

Hello!
Please let me know if I should start a new topic and/or ask another forum - I have a few questions about my next steps which I thought was related to this thread so figured I could start to follow-up here.

I used fslmaths and the -add flag to combine all my ROIs (thank you). I see that I need to include a lookup table for tck2connectome. I used the Harvard-Oxford atlas as the starting point of my ROIs and then modified them based on neurosynth, so I need to create my own lookup table. I am planning on following the instructions here: https://open.win.ox.ac.uk/pages/fsl/fsleyes/fsleyes/userdoc/customising.html

I am confused about what should go under the and and sections. My first question is in regards to this - could someone clarify what should go within these sections? Should it be the filepaths to the ROI .nii files I created in MNI space? The Harvard-Oxford-cort-prob-2mm that currently exists (but then how do I specify that I have my own ROIs)? Any clarification about how to create my own lookup table would be appreciated, thank you!

Hi @fareshte,

You do not need a lookup table for tck2connectome.

Best,
Steven

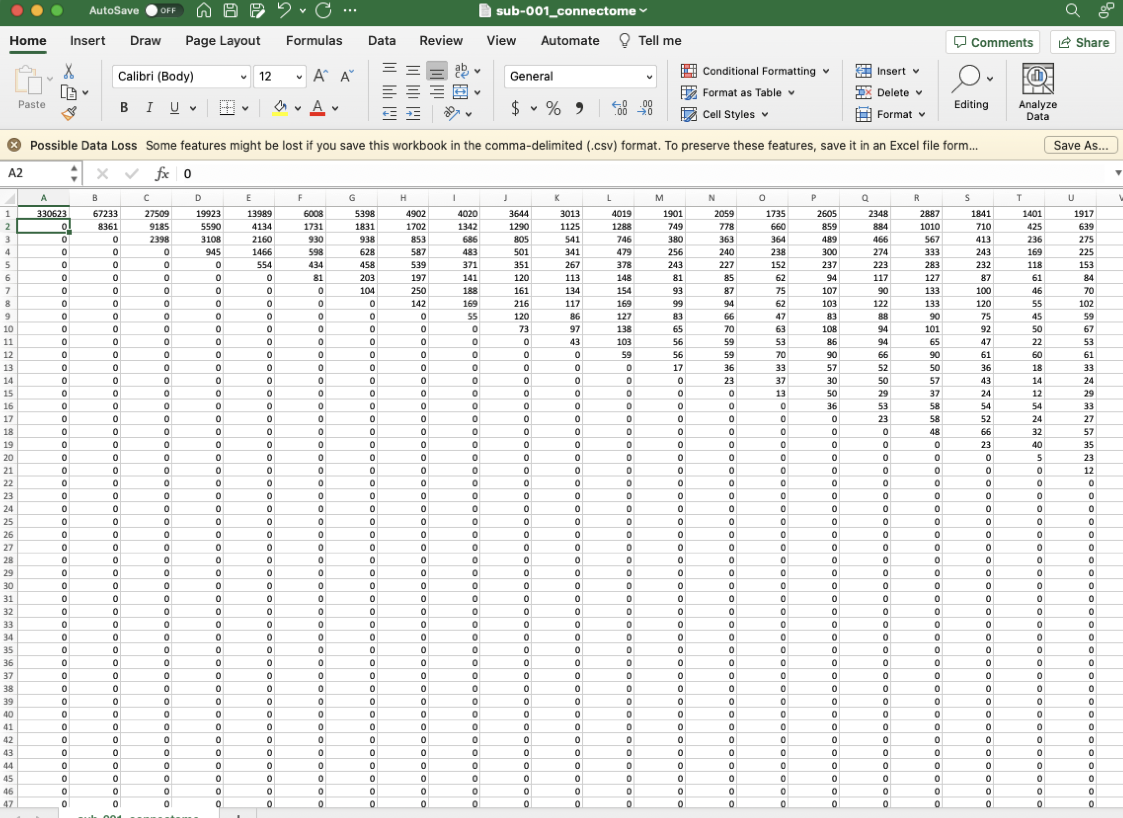
Right, sorry - it doesn’t need one to run, but I asked my question about creating my own lookup table because when I run tck2connectome, I see the following:

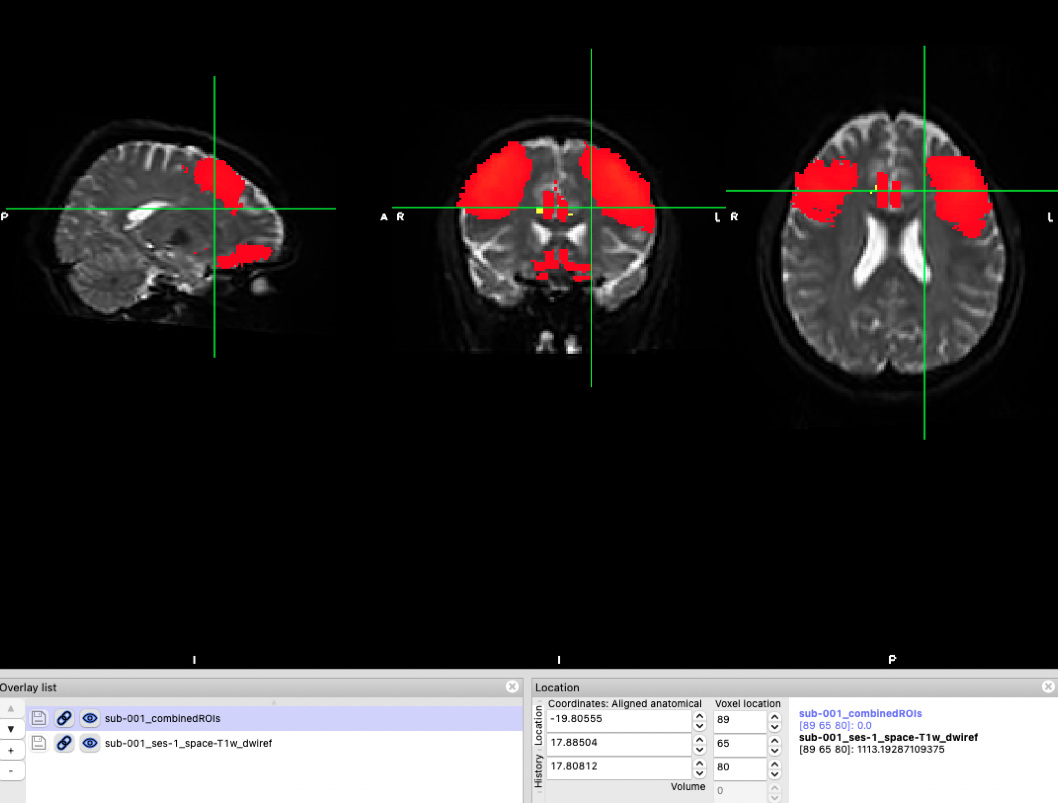
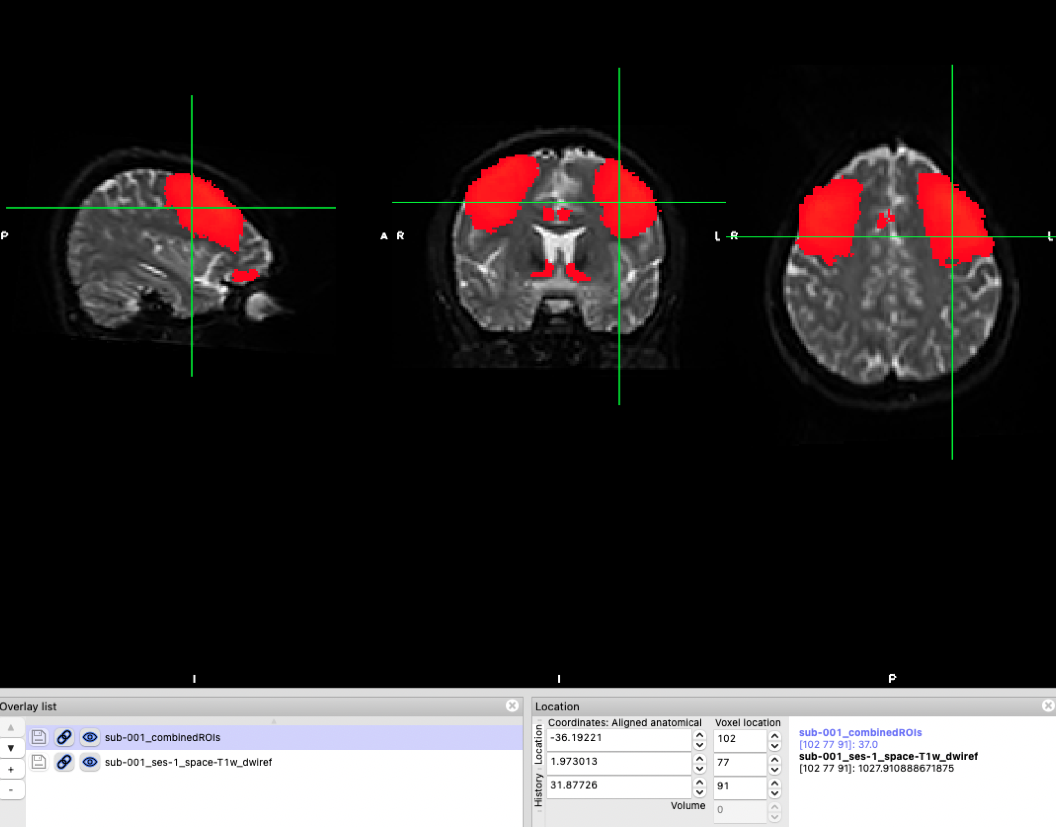
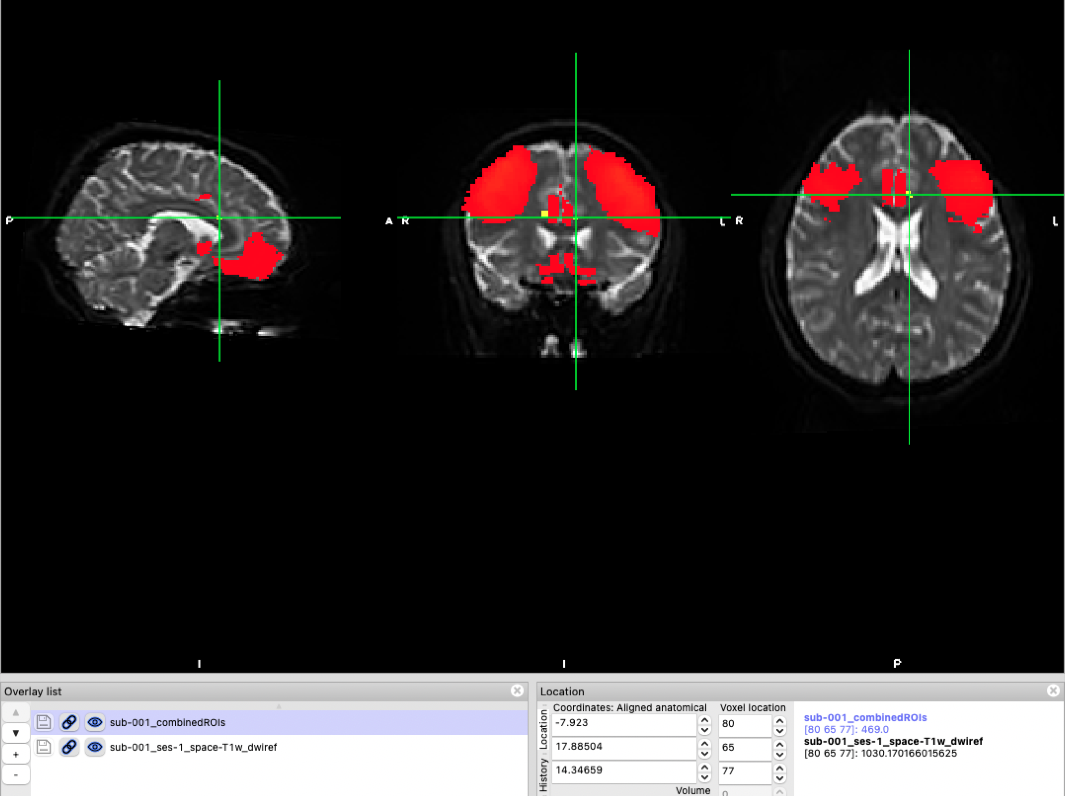
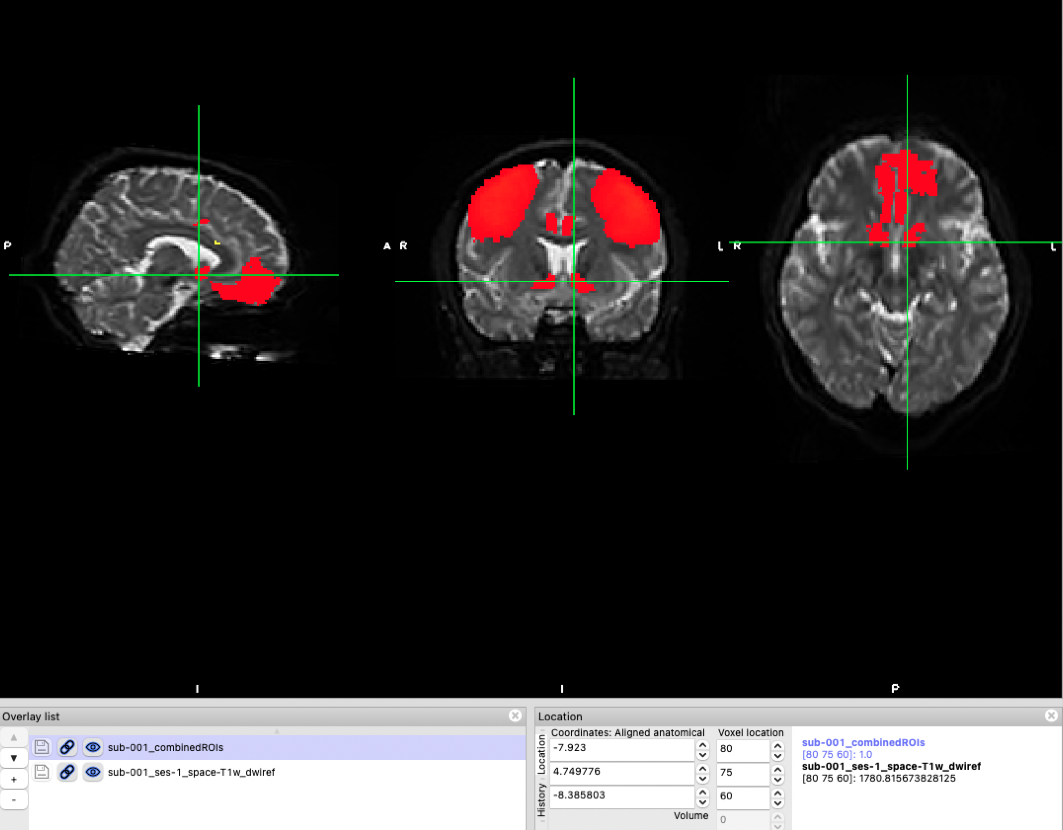
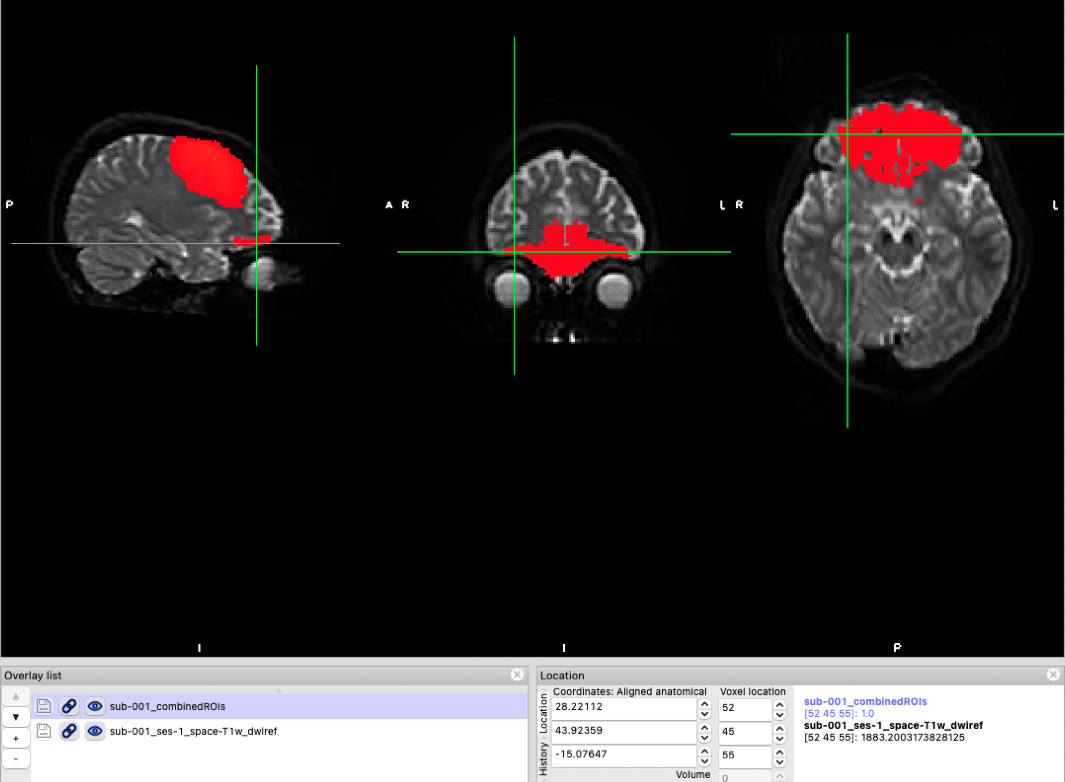
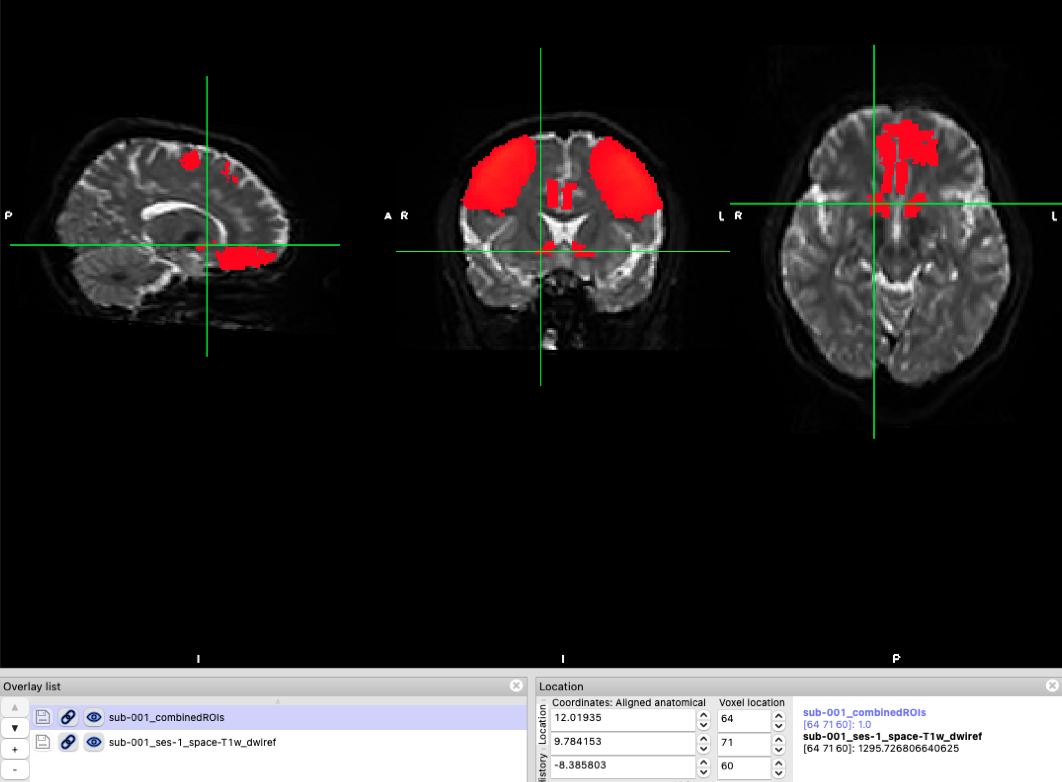
tck2connectome: Image "/Users/neurouser1/Documents/MSFatigue/T1toDWI/sub-001/ses-1/sub-001_combinedROIs.nii.gz" stored with floating-point type; need to check for non-integer or negative values
tck2connectome: [100%] uncompressing image "/Users/neurouser1/Documents/MSFatigue/T1toDWI/sub-001/ses-1/sub-001_combinedROIs.nii.gz"
tck2connectome: [100%] Verifying parcellation image
tck2connectome: [100%] uncompressing image "/Users/neurouser1/Documents/MSFatigue/T1toDWI/sub-001/ses-1/sub-001_combinedROIs.nii.gz"
tck2connectome: [WARNING] The following nodes are missing from the parcellation image:
tck2connectome: [WARNING] 81, 83, 84, 85, 86, 87, 88, 89, 90, 91, 92, 93, 94, 95, 96, 97, 98, 99, 100, 101, 102, 103, 104, 105, 106, 107, 108, 109, 110, 111, 112, 113, 114, 115, 116, 117, 118, 119, 120, 121, 122, 123, 124, 125, 126, 127, 128, 129, 130, 131, 132, 133, 134, 135, 136, 137, 138, 139, 140, 141, 142, 143, 144, 145, 146, 147, 148, 149, 150, 151, 152, 153, 154, 155, 156, 157, 158, 159, 160, 161, 162, 163, 164, 165, 166, 167, 168, 169, 170, 171, 172, 173, 174, 175, 176, 177, 178, 179, 180, 181, 182, 183, 184, 185, 186, 187, 188, 189, 190, 191, 192, 193, 194, 195, 196, 197, 198, 199, 200, 201, 202, 203, 204, 205, 206, 207, 208, 209, 210, 211, 212, 213, 214, 215, 216, 217, 218, 219, 220, 221, 222, 223, 224, 225, 226, 227, 228, 229, 230, 231, 232, 233, 234, 235, 236, 237, 238, 239, 240, 241, 242, 243, 244, 245, 246, 247, 248, 249, 250, 251, 252, 253, 254, 255, 256, 257, 258, 259, 260, 261, 262, 263, 264, 265, 266, 267, 268, 269, 270, 271, 272, 273, 274, 275, 276, 277, 278, 279, 280, 281, 282, 283, 284, 285, 286, 287, 288, 289, 290, 291, 292, 293, 294, 295, 296, 297, 298, 299, 300, 301, 302, 303, 304, 305, 306, 307, 308, 309, 310, 311, 312, 313, 314, 315, 316, 317, 318, 319, 320, 321, 322, 323, 324, 325, 326, 327, 328, 329, 330, 331, 332, 333, 334, 335, 336, 337, 338, 339, 340, 341, 342, 343, 344, 345, 346, 347, 348, 349, 350, 351, 352, 353, 354, 355, 356, 357, 358, 359, 360, 361, 362, 363, 364, 365, 366, 367, 368, 369, 370, 371, 372, 373, 374, 375, 376, 377, 378, 379, 380, 381, 382, 383, 384, 385, 386, 387, 388, 389, 390, 391, 392, 393, 394, 395, 396, 397, 398, 399, 400, 401, 402, 403, 404, 405, 406, 407, 408, 409, 410, 411, 412, 413, 414, 415, 416, 417, 418, 419, 420, 421, 422, 423, 424, 425, 426, 427, 428, 429, 430, 431, 432, 433, 434, 435, 436, 437, 438, 439, 440, 441, 442, 443, 444, 445, 446, 447, 448, 449, 450, 451, 452, 453, 454, 455, 456, 457, 458, 459, 460, 461, 462, 463, 464, 465, 466, 467, 468
tck2connectome: [WARNING] (This may indicate poor parcellation image preparation, use of incorrect or incomplete LUT file(s) in labelconvert, or very poor registration)
tck2connectome: [100%] Constructing connectome
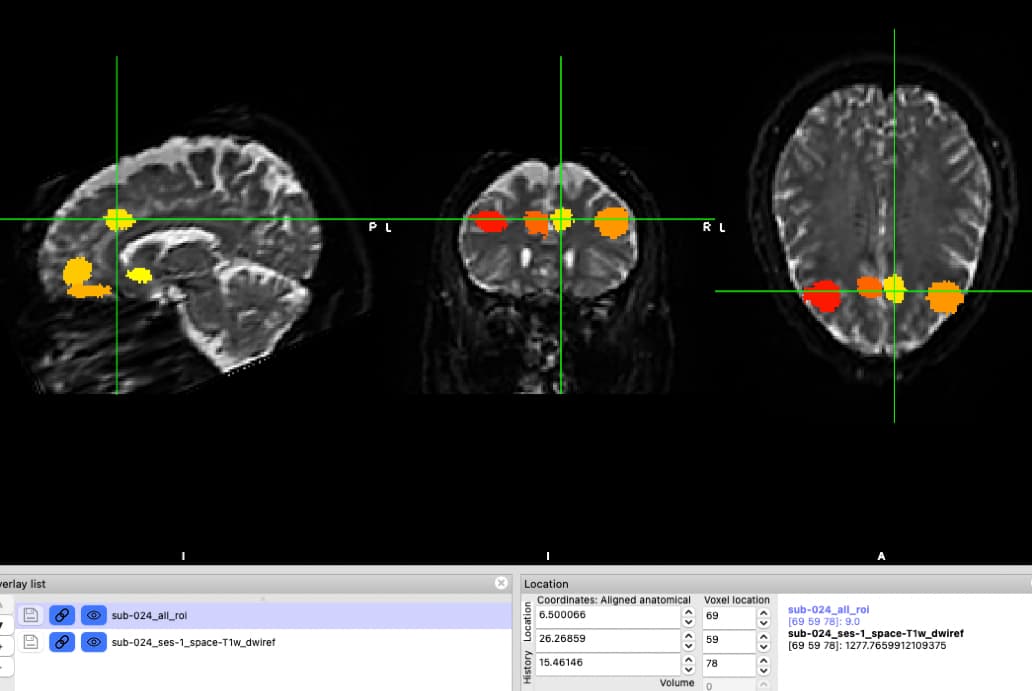
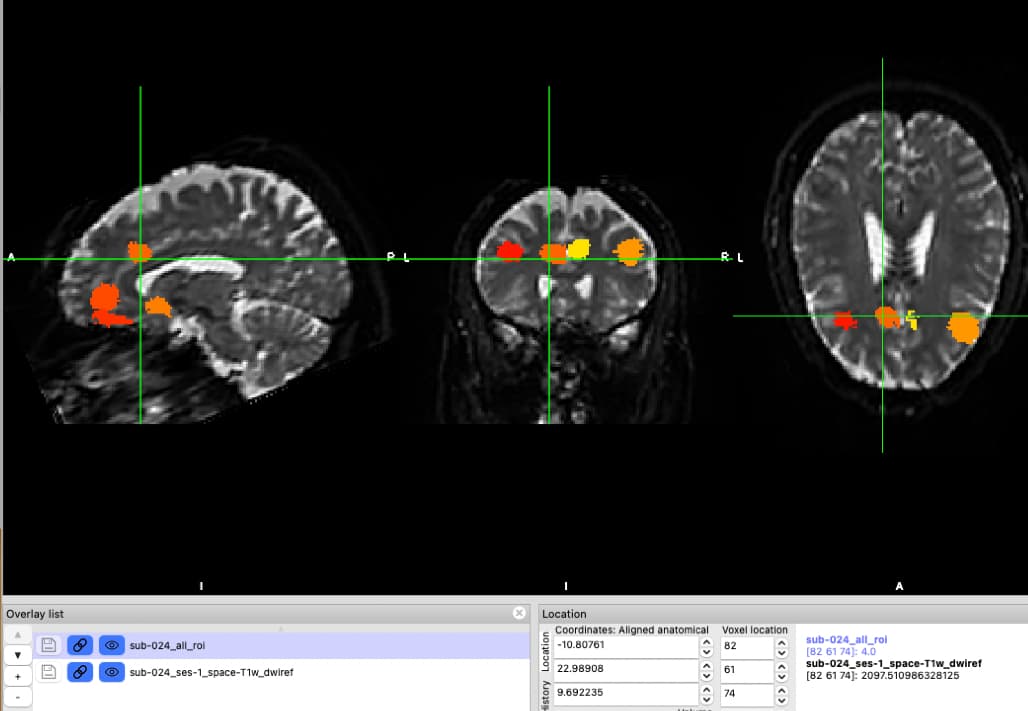
tck2connectome: [WARNING] The following nodes do not have any streamlines assigned:
tck2connectome: [WARNING] 75, 78, 79, 82
tck2connectome: [WARNING] (This may indicate a poor registration)

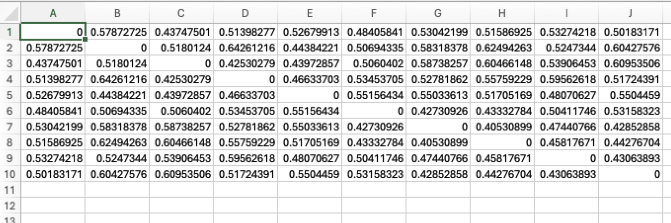
My understanding is that if I want to assign streamlines, then I’d need to create a lookup table? Otherwise, I’m not sure what the output columns represent? Let me know if I can/should provide more information - sorry, am very new to this!

Please share the commands you used to create the parcellation run tck2connectome.

You shouldn’t need a lookup table, tck2connectome can just produce what streamlines connect to what intensity ROIs.

Are your parcellations in DWI space?

The commands I used for subject 001.

tck2connectome \
/Users/neurouser1/Documents/MSFatigue/qsiprep_mrtrix/qsirecon/sub-001/ses-1/dwi/sub-001_ses-1_space-T1w_desc-preproc_space-T1w_desc-tracks_ifod2.tck \
/Users/neurouser1/Documents/MSFatigue/T1toDWI/sub-001/ses-1/sub-001_combinedROIs.nii.gz \
/Users/neurouser1/Documents/MSFatigue/sub-001_connectome.csv

I converted each ROI to each subject’s individual DWI space and then combined those ROIs using fslmaths: fslmaths L.ACC_sub-001_dwispace.nii.gz -add L.DLPFC_sub-001_dwispace.nii.gz -add L.NAcc_sub-001_dwispace.nii.gz -add L.OFC_sub-001_dwispace.nii.gz -add L.vmPFC_sub-001_dwispace.nii.gz -add R.ACC_sub-001_dwispace.nii.gz -add R.DLPFC_sub-001_dwispace.nii.gz -add R.NAcc_sub-001_dwispace.nii.gz -add R.OFC_sub-001_dwispace.nii.gz -add R.vmPFC_sub-001_dwispace.nii.gz sub-001_combinedROIs

And here’s a sample of the output - how do I know what the intensity of the ROIs are?

Are all of these inputs non-overlapping binary masks? If so, wouldn’t the combined ROI image just be a value of 1 everywhere? Can you show a picture of the combined ROI mask with something that can show the different intensities (e.g., fsleyes)? Also do you have a visualization that confirms the DWI and parcellation are aligned?

The first column/row should be for lowest intensity, second column/row for second lowest, etc.

(might have to confirm this later, but should be something like this)

Ah, I think you’re right. It’s odd - I thought at first that each ROI had a value of 1 but some of the ROIs when I click on it are other values (see screenshots below):
I may not be looking at the right thing to see intensity though but I think it’s the number by the coordinates.

Also, this is the combined ROIs on top of the subject’s DWI reference image to confirm that they are aligned/in the same space!

I’m not sure what’s going on with the intensities - sometimes it looks like it’s all 1’s no matter which ROI I click and then other times they’re different?

Okay, I’m wondering if I’m seeing the value 1 across some of the ROIs but not others because those are the ROIs that have some overlap. Each ROI is a binary mask but they are not fully non-overlapping.

Hi @Steven!
So, I officially have binary non-overlapping masks (my ROIs) and as you previously said, the combined ROI image just has a value of 1 everywhere. I’ve tried to find the answer to the following question with no luck (found the question has been asked before but no answer), so I am wondering if you might know –

Do you know how to use fslmaths to combine ROIs, so that each one has a different intensity (e.g., 10 ROIs, with intensities 1-10) so that I can then use tck2connectome? Or do I need another method of combining ROIs?

Thank you!

You could in theory do it in bash by making a loop over fslmath but I bet it would be easier to do it with in python with nilearn. Without knowing how your files are organized I cannot give you an exact script but I bet this function will be very helpful: nilearn.image.math_img - Nilearn

Best,
Steven

Oh nice, thank you! I’ll try using the function you linked!

hi @Steven - i’m back :slight_smile:
thanks for letting me know about nilearn! i used it to create a different intensity for each of my 10 ROIs (from 1-10).

I wanted to cross-check my steps with you from that point because my results are not what we’d have expected (e.g., FA values between right DLPFC to left dACC are higher than right DLPFC to right dACC – within-hemisphere tracts versus across-hemisphere tracts) so I’m combing through all my steps to double-check.

after creating a combined_ROIs image, i moved the combined ROIs I created from T1 space MNI to DWI space so each of subject’s ROIs were in their dwispace (using each subject’s dwiref.nii.gz DWI image as the reference image from qsiprep output).

I double-checked that each subject’s ROIs in dwispace had the same intensity values (i.e., left DLPFC = 1, left OFC = 2, left vmPFC =3, left dACC = 4, left NAcc = 5, right DLPFC =6, right OFC = 7, etc…)


I then ran the following “dwi2othermetrics” script to calculate FA values

for sub in $list; do

dwi2tensor -fslgrad /Users/neurouser1/Documents/MSFatigue/qsiprep_out/qsiprep/${sub}/ses-1/dwi/*_dwi.bvec \
/Users/neurouser1/Documents/MSFatigue/qsiprep_out/qsiprep/${sub}/ses-1/dwi/*_dwi.bval \
-force /Users/neurouser1/Documents/MSFatigue/qsiprep_out/qsiprep/${sub}/ses-1/dwi/*dwi.nii.gz \
/Users/neurouser1/Documents/MSFatigue/tck2connectome_out/${sub}/${sub}_dwi2tensor.mif

tensor2metric -force -fa /Users/neurouser1/Documents/MSFatigue/tck2connectome_out/${sub}/${sub}fa.nii.gz \
/Users/neurouser1/Documents/MSFatigue/tck2connectome_out/${sub}/${sub}_dwi2tensor.mif

tcksample -force /Users/neurouser1/Documents/MSFatigue/qsiprep_mrtrix/qsirecon/${sub}/ses-1/dwi/${sub}_ses-1_space-T1w_desc-preproc_space-T1w_desc-tracks_ifod2.tck \
/Users/neurouser1/Documents/MSFatigue/tck2connectome_out/${sub}/${sub}fa.nii.gz \
/Users/neurouser1/Documents/MSFatigue/tck2connectome_out/${sub}/${sub}_FA.csv -stat_tck mean

tck2connectome -force -symmetric -zero_diagonal /Users/neurouser1/Documents/MSFatigue/qsiprep_mrtrix/qsirecon/${sub}/ses-1/dwi/${sub}_ses-1_space-T1w_desc-preproc_space-T1w_desc-tracks_ifod2.tck \
/Users/neurouser1/Documents/MSFatigue/combinedROIs/${sub}_all_roi.nii.gz \
/Users/neurouser1/Documents/MSFatigue/tck2connectome_out/${sub}/${sub}_zerodiagprobFAconnectome.csv \
-scale_file /Users/neurouser1/Documents/MSFatigue/tck2connectome_out/${sub}/${sub}_FA.csv -stat_edge mean

done

I then ran tck2connectome to calculate the FA values between ROIs:

tck2connectome \
/Users/neurouser1/Documents/MSFatigue/qsiprep_mrtrix/qsirecon/sub-001/ses-1/dwi/sub-001_ses-1_space-T1w_desc-preproc_space-T1w_desc-tracks_ifod2.tck \
/Users/neurouser1/Documents/MSFatigue/T1toDWI/sub-001/ses-1/sub-001_combinedROIs.nii.gz \
/Users/neurouser1/Documents/MSFatigue/sub-001_connectome.csv

this is an example output:
Screen Shot 2024-03-24 at 9.54.55 AM

If all the above steps look okay to you - I’m wondering whether I’m interpreting the tck2connectome output file “_zerodiagprobFAconnectome.csv” correctly?
Is it organized such that the first column corresponds to the lowest intensity ROI (in my case, left DLPFC), the second column corresponds to the second lowest (in my case, left OFC), etc… ?
For example, FA value between left DLPFC (intensity =1 so 1st column) and left OFC (intensity =2 so 2nd row) = .57872725?

Any insight/thoughts you have will be so appreciated. Thank you for your time!!

Hi @fareshte,

The corpus callosum does have high FA, which could explain why inter-hemispheric connections have high FA relative to intra-hemispheric connections.

This all looks okay.

That should be the case.

I would make sure that you’ve visualized the streamlines such that the connections you are getting between the ROIs look like you expect them to. Visualizing them over the FA map would be nice too, as a QC check for the FA map and to see why some connections might have higher/lower FA. You can get these pairwise streamlines by running connectome2tck.

Best,
Steven

Thanks so much @Steven! I’ll visualize as a QC check as suggested.
And that’s helpful to hear re: inter- vs intra-hemispheric connections.