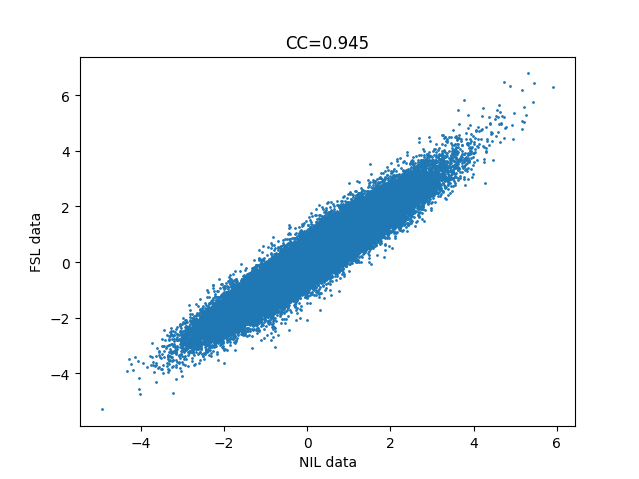
I’m attempting to demonstrate to students that identical analyses can be accomplished with different software. I’m trying to achieve (nearly identical) output from FEAT and nilearn, but am failing quite spectacularly (see attached image of correlation between t-statistic of all voxels of each, for the simple contrast of one condition).
I’m attaching the ‘best’ result I have been able to accomplish, which is a pearson’s r (CC) of 0.945. Considering this is simply the t-statistic of each voxel’s beta-weight for the given contrast (congruent), I am surprised, especially since the variance is symmetric for high and low t-statistic voxels.
Note the input data to both the NILEARN and FSL FEAT is identical BOLD volume series, precomputed by FMRIprep with default parameters. FMRIprep will have motion corrected but of course nuisance noise will still be present.
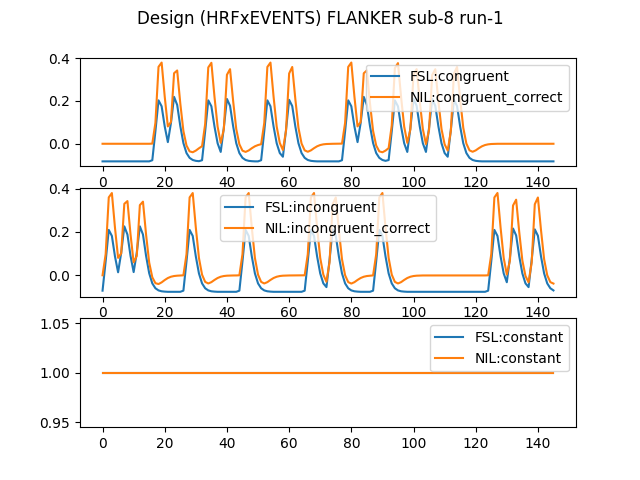
I expect the issue is that there are differen options versus built-in aspects in each software. One thing I suspect but can not confirm is that in the design matrix for NILEARN there is a “constant” (i.e. a bias term) column, which does not seem to be present in the design matrix of FSL, but it may simply not be showing it. I can not figure out how to get rid of it in NILEARN though.
I’m running a simple GLM in FSL FEAT (on the “flanker” task example from andysbrainbook: Chapter 5: Creating Timing Files — Andy's Brain Book 1.0 documentation).
This is just for run-1 of sub-8.
########## FEAT SETTINGS #########################
I disable EVERYTHING possible in FEAT:
MISC: Everything on the “misc” page is set to 0 (noise level, threshold, high pass filter, etc.) It is not clear whether this affects the GLM since it says it only relates to the efficiency calculation, but I have found it changes results sometimes.
DATA: High-pass filter cutoff is 0
STATS: Use FILM prewhitening is ON (This seems to by default apply an AR(1) model to the timecourse of each voxel, which it seems that NILEARN does by default as well. And since this can not be disabled in NILEARN I left it here in FEAT).
(FULL MODEL SETUP: 2 EVs, all options for the EV are disabled, I.e. add temporal derivative and apply temporal filtering are FALSE. This should not matter since we do not apply any temporal filtering to the BOLD signal).
POST-STATS: irrelevant, we already fail to achieve identical STATS (e.g. t-statistic) computed between NILEARN and FSL-FEAT. So the next step of clustering/thresholding will fail as well.
############# NILEARN SETTINGS ###################
mypath='/home/riveale/richard_home/git/fsl_tutorial_glm/fmriprep_results_flanker/sub-08/func/';
rawpath='/home/riveale/richard_home/git/fsl_tutorial_glm/raw_flanker/ds000102/sub-08/func/';
subject8_run1_f = os.path.join(mypath, 'sub-08_task-flanker_run-1_space-MNI152NLin2009cAsym_desc-preproc_bold.nii.gz');
subject8_run1_ev = os.path.join(rawpath, "sub-08_task-flanker_run-1_events.tsv");


df=pd.read_csv(subject8_run1_ev, sep = '\t');
## Exclude incorrect trials and only keep the three relevant columns as specified by NILEARN for building the regressors (predictors) matrix.

df = df[ df.correctness == 'correct' ];
df = df[ ['onset', "duration", "trial_type"] ];

glmparams=dict(t_r=2,
               slice_time_ref=0.5, #REV: fmriprep adjusts all slice times to the middle slice in each T_R.
               noise_model='ar1',
               standardize=False,
               signal_scaling=False,  #REV: (0,1) is grand mean scaling, 0 is just normal, False is none.
               hrf_model="spm",
               drift_model=None,
               high_pass=0,
               verbose=3,
               mask_img=False, #Do not mask (default is None, which uses default data from BOLD img 4d volumes).
               );


fmri_glm = FirstLevelModel( **glmparams );
fmri_glm = fmri_glm.fit(subject8_run1_f, df);
n_regressors = fmri_glm.design_matrices_[0].shape[1];
cong_contrast = np.zeros(n_regressors);
cong_contrast[0] = 1;
cong_z_map = fmri_glm.compute_contrast(cong_contrast, stat_type='t', output_type="z_score");
cong_z_map.to_filename("cong_raw_t_contrast_map.nii.gz")