I have analysed two different fMRI datasets using both Nilearn and SPM and both results are very different from each other (meaning dataset 1 Nilearn results and dataset 1 SPM results are vey different from each other etc). Has anyone else experienced this/knows why this may be?
For Dataset 1:
The only difference was that I had used fMRIPrep preprocessed data for Nilearn and SPM for SPM (tried to match the preprocessing as much as possible). The other univariate steps were the same. Í thought this might have played a role on the different second level results but didn’t think it would be massive.
For Dataset 2:
For both I used fMRIPrep preprocessed data (did the gunzipping etc steps accordingly for SPM) and then did the same univariate steps. My results were again very different from each other.
I know that SPM has it’s own way of thresholding but I did not apply any thresholding at first and tried to keep everything else as equal as possible.
I have heard from other labs that they have also encountered this. Did anyone else come across this issue and figure out what may cause the differences?
Thank you for your response and the references Of course I would expect to see some differences, but my results were basically completely different that I hadn’t expected the extent of the difference to be this much. Then this just raises the question; which one is the right one to use? The “better” one doesn’t imply it’s validity but naturally I would like to see “better” results of course…
I am so lost at this point, I was trying to avoid SPM (as I prefer coding in Python) but now I don’t know how to continue
I trust you did everything you could to make the two pipelines comparable, but it is hard to evaluate differences in the software outcomes without seeing some code. In any case, If I were in your position, I would use Nilearn.
I also prefer Python to MATLAB
Nilearn is open source and is actively being developed by a helpful community
A Pythonic Nilearn workflow can be written more linearly than SPM batch configs, so it is easier for others to understand your code and process if/when it is shared, which would work in favor of reproducibility.
Thank you very much for your response. I also agree that the Pythonic Nilearn workflow is much more easier to understand and also easier to reproduce.
The first dataset had much better results with SPM, so I ended up using SPM first level output to further do Searchlight analysis with Nilearn whereas doing everything with Nilearn would’ve made it much more convenient.
I might just test it more using basic datasets and see whether the differences are just as big.
Hi @Merve, it could be interesting to hear about the specific ways in which the two sets of results differed. For a couple of examples, was this something like “the beta values in pipeline B were half as large as the values in pipeline A”, or “pipeline A led to a significant effect in ROI Z, but not pipeline B”, or “the correlation between the z-stat maps in the two pipelines was 0.1”? Curious even to hear about the specifics for even the simpler dataset that you test. Paired with the code sample mentioned by @Steven, those specifics might help clarify whether one set is more trustworthy than another.
to make things more comparable maybe use the same preprocessing (fmriprep) - the strategy you used for dataset 2. As far I know there are some pre-preprocessing steps in frmiprep that SPM cannot even do.
try to base your pipeline selection on datasets or results that is independent of the results you are actually asking questions about otherwise you are entering “p-hacking” territory (using the results of your analysis to decided which analysis you run): maybe you can do that on some “positive control” condition (for example: button presses activate motor cortex)
note that the differences between software is in itself interesting and may be worth reporting as it speaks to the computational robustness (same data - different methods) of a given result (though it does not make for easy story telling)
Another debugging suggestion is to narrow/simplify the comparison as much as possible, and use as strong as effect (a “positive control analysis”) as possible for the comparison. For example, if the task used button-presses or some other motor response, that should be clearly detectable in individual participants’ data. (MVPA Meanderings: DMCC55B supplemental as tutorial: positive control "ONs"-style timecourses and related posts have some examples of these sorts of analyses.)
Positive control analyses like this should be qualitatively very similar across preprocessing and analysis pipelines; e.g., sub1 has much clearer activity than sub2 in both cases; parcel #5 has a clear task response in most participants but parcel #10 does not. I would not expect exact voxel-level matching of estimates, but these sorts of “big picture” results should be very consistent.
Thank you very much for all your help and input and I apologise for my late response.
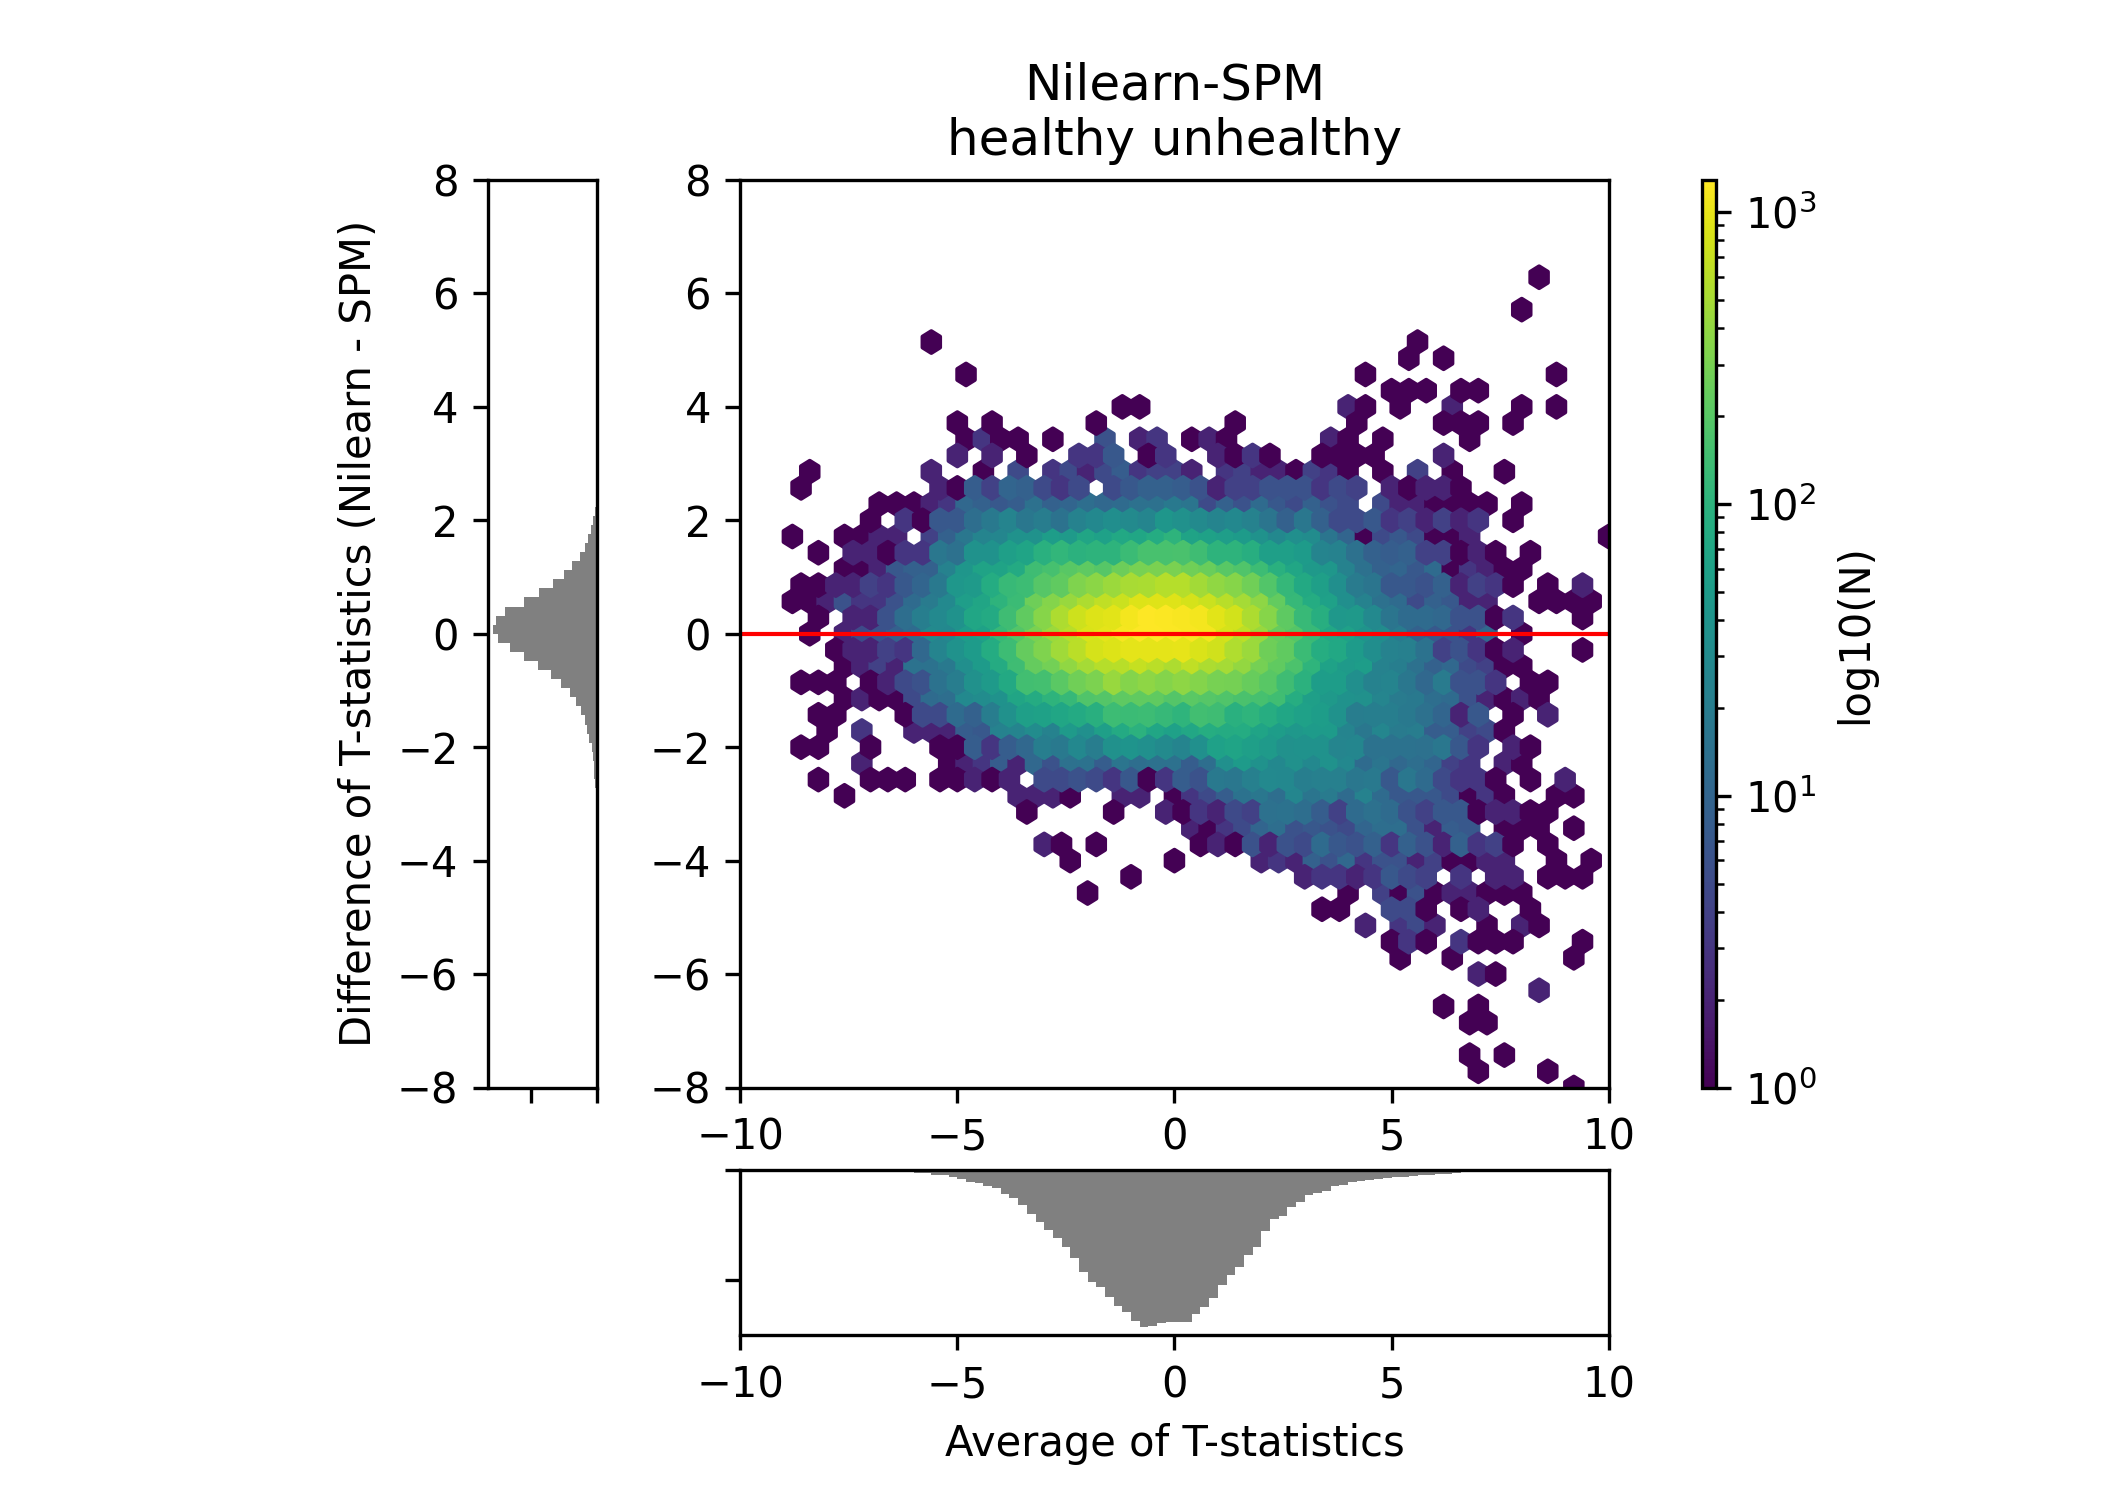
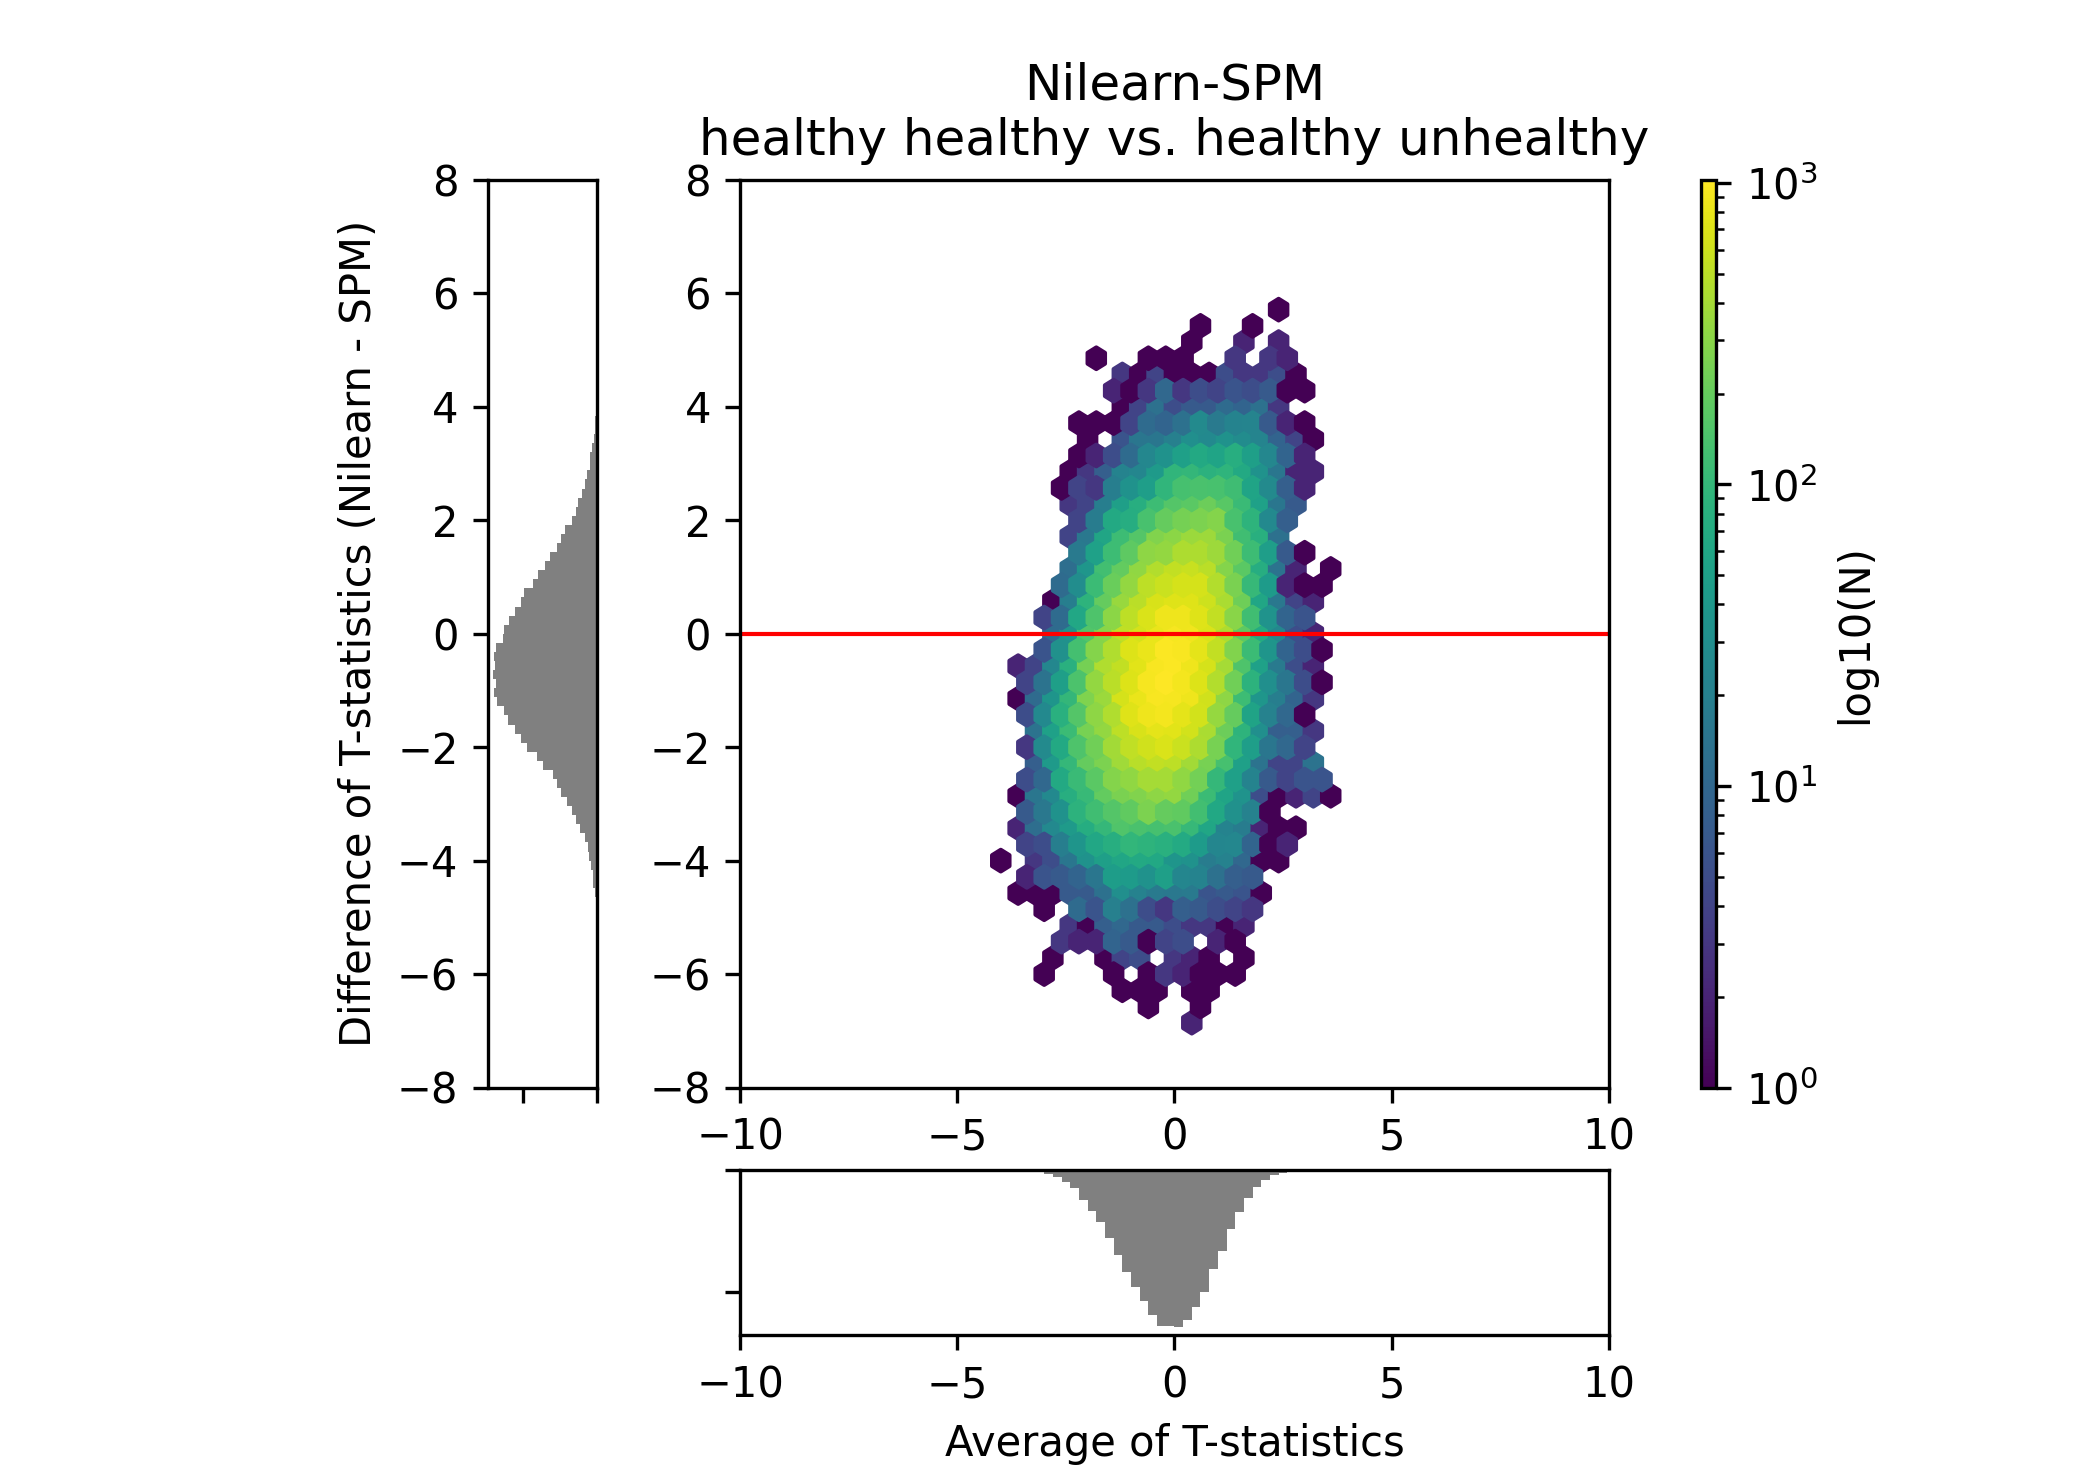
I have carried out a basic one sample t test for one condition and compared the softwares with a bland-altman plot. The stat map plots were already looking similar when comparing it this way but the bland altman plots also confirmed it (e.g. the one below has pearson r= 0.92)
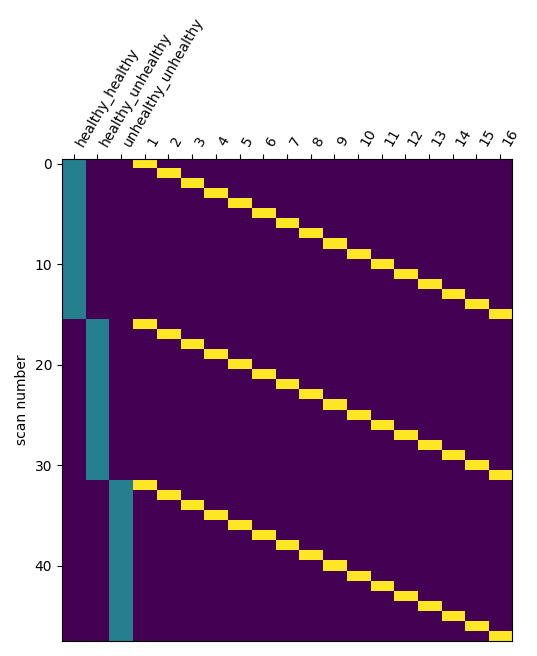
I think it does, because your design matrix is rank deficient. Nilearn does not handle that properly and properly outputs erroneous results.
You can for instance remove one of the first three regressors.
Best,
Bertrand