After multi-echo sequence upgrade, all components rejected by tedana: what's wrong with the data?

Summary of what happened:

Our scanner (GE Discovery MR750) was upgraded several months ago, and now instead of a custom multi-echo pulse sequence made by our former MR physicist, we have a GE-made hyperband multi-echo work-in-progress sequence. When I denoise my old data with tedana (0.0.12), it works great. When I denoise my new data from the very same task (same TR, voxel size is smaller due to hyperband), virtually all components are rejected every time, even those that are obviously BOLD. The same is true for a colleague of mine, collecting data from a totally different task - obvious BOLD components are rejected.

The rho/kappa values look almost “reversed”. We initially assumed that the DICOM headers were causing this problem, but after looking them over many times we can’t find the source of the issue (see table below). We are using dcm2niix to convert to NIFTI and catenate the echoes. Looking at the raw echoes, they seem to be as expected (see screenshot below). We have checked over the echo times many times. All the analysis code is the same as before and it works beautifully on data from this same task gathered before the pulse sequence upgrade. Obviously something in the data format is causing this problem but we just can’t think what it might be.

DV24 (old sequence) DV29 (ME-WIP, new sequence)
72 x 72 128 x 128
3 mm x 3 mm x 3 mm 1.7 mm x 1.7 mm x 2 mm
No hyperband Hyperband
13.6 ms / 12.3 ms min echo 14, 27, 40 ms
Pixel Bandwidth: 6944.44 Pixel Bandwidth: 3906.25
FOV 216 mm FOV 215.0016 mm

Command used (and if a helper script was used, a link to the helper script or the command generated):

   afni_proc.py                                                                                                                        \
             -subj_id ${sub}                                                                                                            \
             -script ${preproc_output}/proc.${sub}_${task}_${run}                                                                       \
             -out_dir ${sub}_${task}_${run}.results                                                                                     \
             -copy_anat ${data_folder}/HUMAN_EBR-${sub}/${anat_scan_num}/MPRAGE.nii                                         \
             -anat_has_skull yes                                                                                                        \
             -dsets_me_run ${data_folder}/HUMAN_EBR-${sub}/${scan_num}/*e*.nii                                                \
             -echo_times 14 27 40                                                                                                         \
             -blocks despike tshift align tlrc volreg mask combine scale regress                                                               \
             -radial_correlate_blocks tcat volreg                                                                                       \
             -tcat_remove_first_trs 2                                                                                                   \
             -tlrc_base ${data_folder}/MNI_caez_N27+tlrc.BRIK                                                                           \
             -volreg_align_to MIN_OUTLIER                                                                                               \
             -volreg_align_e2a                                                                                                          \
             -volreg_tlrc_warp                                                                                                          \
             -mask_epi_anat yes                                                                                                         \
             -combine_method m_tedana                                                                                                \
             -html_review_style pythonic

tedana -d pb03.$subj.r$run.e*.volreg+tlrc.HEAD
-e $echo_times
–mask mask_epi_anat.$subj+tlrc.HEAD
–out-dir tedana_r$run --convention orig

Version:

0.0.12

Environment (Docker, Singularity, custom installation):

tedana is called from within AFNI by various bash scripts, and is generally working fine for data that is not generated by our new sequence

Relevant log outputs (up to 20 lines):

(The last of many re-attempts at ICA)

INFO ica:tedica:85 ICA with random seed 51 converged in 47 iterations
INFO tedana:tedana_workflow:671 Making second component selection guess from ICA results
INFO collect:generate_metrics:123 Calculating weight maps
INFO collect:generate_metrics:132 Calculating parameter estimate maps for optimally combined data
INFO collect:generate_metrics:145 Calculating z-statistic maps
INFO collect:generate_metrics:155 Calculating F-statistic maps
INFO collect:generate_metrics:165 Thresholding z-statistic maps
INFO collect:generate_metrics:172 Calculating T2* F-statistic maps
INFO collect:generate_metrics:179 Calculating S0 F-statistic maps
INFO collect:generate_metrics:187 Counting significant voxels in T2* F-statistic maps
INFO collect:generate_metrics:193 Counting significant voxels in S0 F-statistic maps
INFO collect:generate_metrics:200 Thresholding optimal combination beta maps to match T2* F-statistic maps
INFO collect:generate_metrics:206 Thresholding optimal combination beta maps to match S0 F-statistic maps
INFO collect:generate_metrics:213 Calculating kappa and rho
INFO collect:generate_metrics:222 Calculating variance explained
INFO collect:generate_metrics:228 Calculating normalized variance explained
INFO collect:generate_metrics:236 Calculating DSI between thresholded T2* F-statistic and optimal combination beta maps
INFO collect:generate_metrics:247 Calculating DSI between thresholded S0 F-statistic and optimal combination beta maps
INFO collect:generate_metrics:257 Calculating signal-noise t-statistics
INFO collect:generate_metrics:295 Counting significant noise voxels from z-statistic maps
INFO collect:generate_metrics:306 Calculating decision table score
INFO tedica:kundu_selection_v2:138 Performing ICA component selection with Kundu decision tree v2.5
WARNING tedica:kundu_selection_v2:213 No BOLD-like components detected. Ignoring all remaining components.
WARNING tedana:tedana_workflow:701 No BOLD components found, but maximum number of restarts reached.
WARNING tedana:tedana_workflow:773 No BOLD components detected! Please check data and results!
INFO io:denoise_ts:374 Variance explained by decomposition: 59.33%
INFO io:write_split_ts:439 Writing low-Kappa time series: /export/home/shared/aclab-fmri/Studies/33_MOTIP2018/MRI_data/PREPROCESSED/results/512_newPI_2.results/tedana_r01/lowk_ts_OC.nii.gz
INFO io:write_split_ts:446 Writing denoised time series: /export/home/shared/aclab-fmri/Studies/33_MOTIP2018/MRI_data/PREPROCESSED/results/512_newPI_2.results/tedana_r01/dn_ts_OC.nii.gz
INFO io:writeresults:498 Writing full ICA coefficient feature set: /export/home/shared/aclab-fmri/Studies/33_MOTIP2018/MRI_data/PREPROCESSED/results/512_newPI_2.results/tedana_r01/ica_components.nii.gz
INFO tedana:tedana_workflow:889 Making figures folder with static component maps and timecourse plots.
INFO io:denoise_ts:374 Variance explained by decomposition: 59.33%
INFO tedana:tedana_workflow:918 Generating dynamic report
INFO tedana:tedana_workflow:921 Workflow completed
end

Screenshots / relevant information:

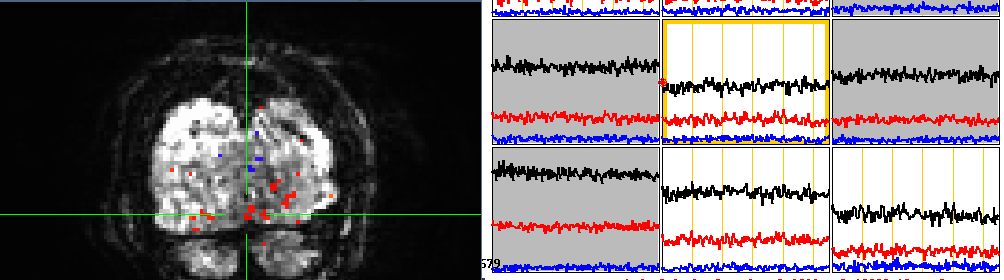
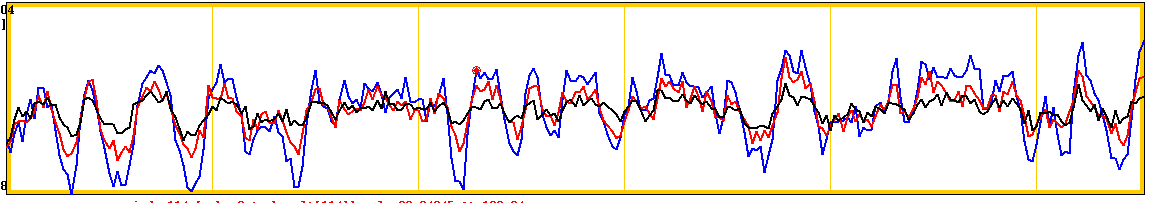
Echoes 1(top), 2(middle), 3(bottom) in raw data converted from DICOM to NIFTI using dcm2niix
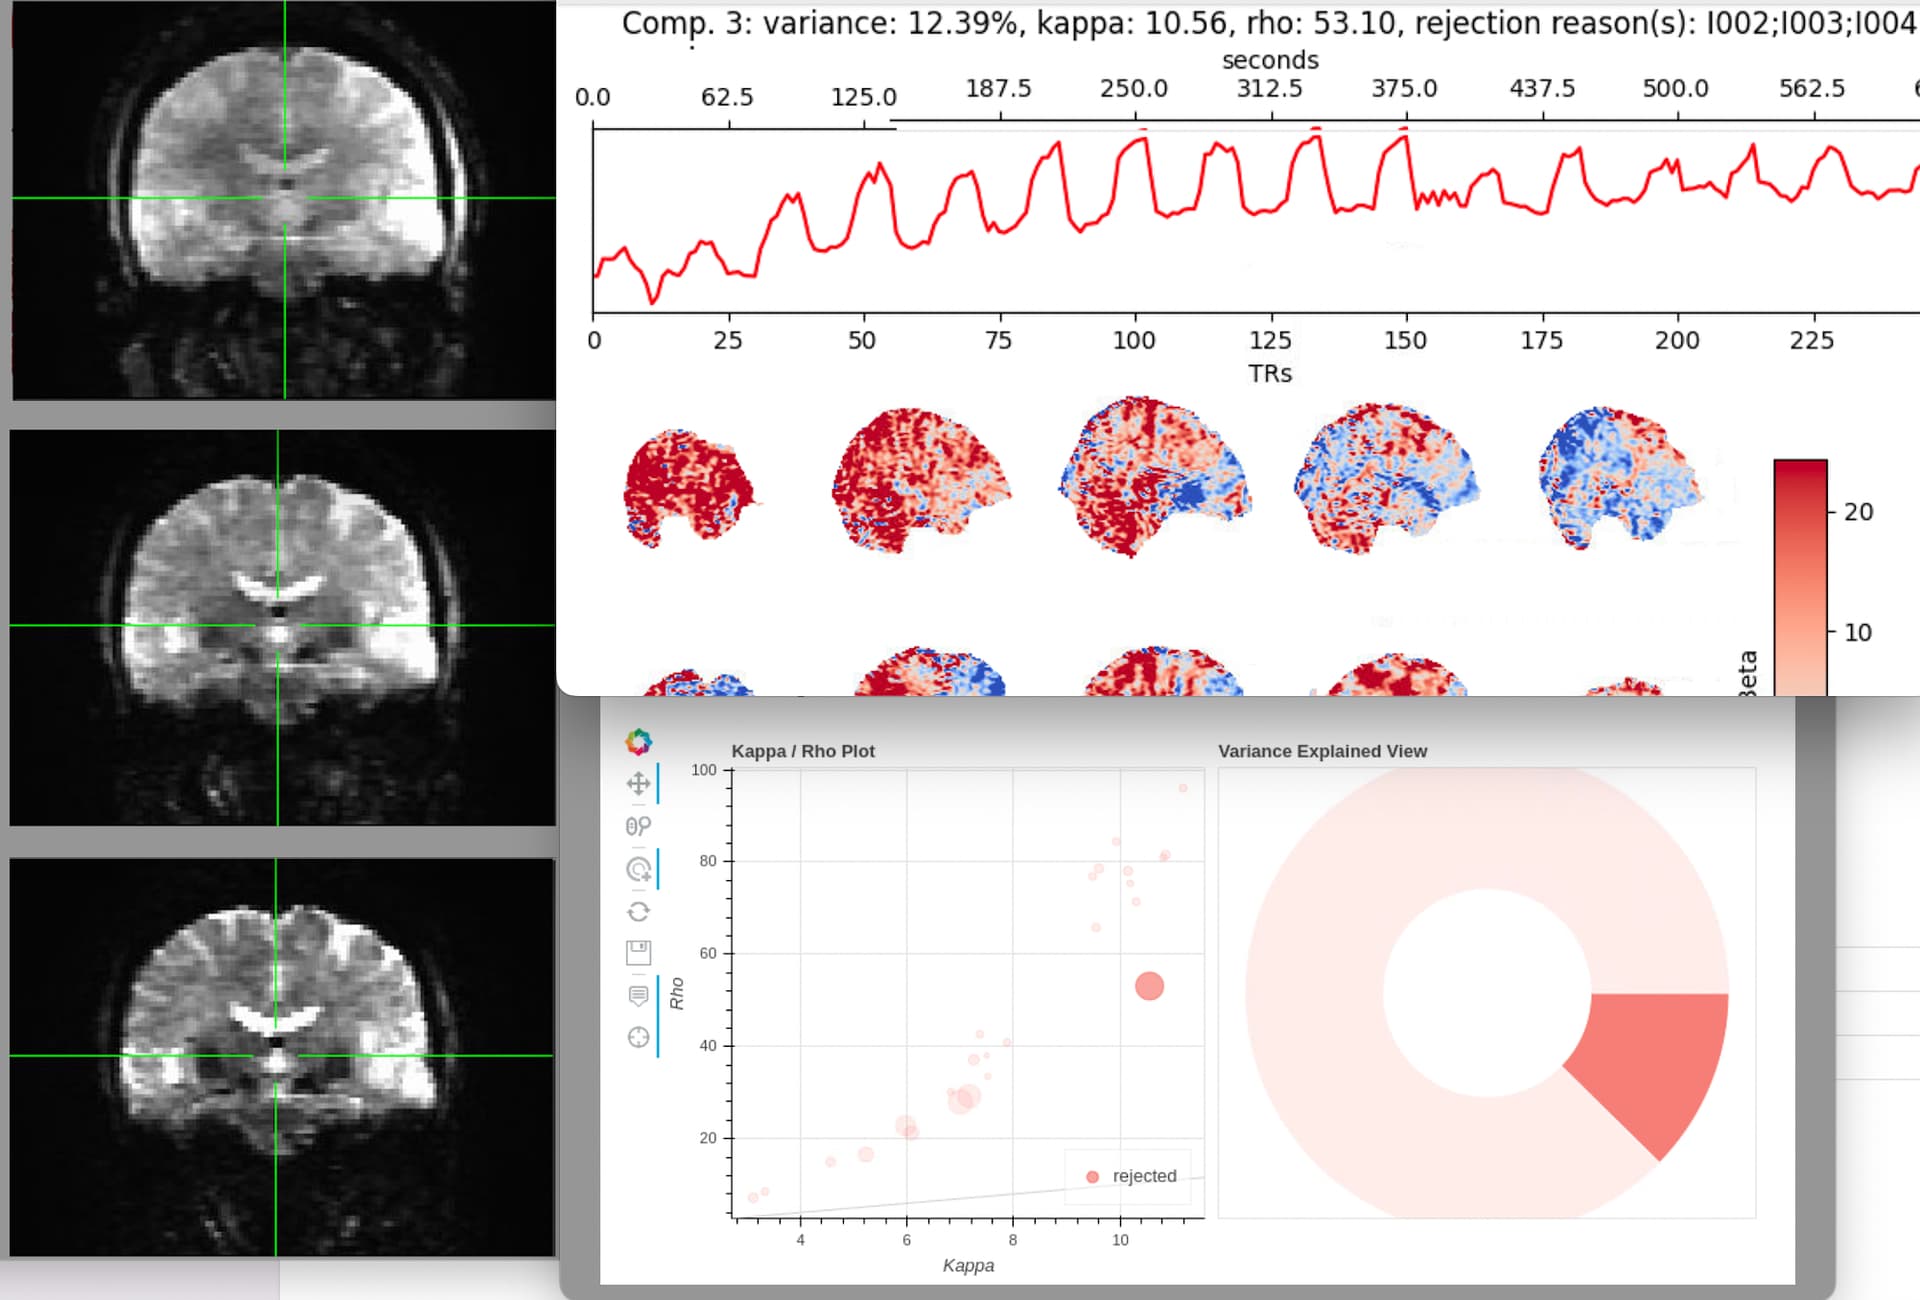
Rejected component showing BOLD signal from block design task

This is an interesting (and unfortunate) problem. It may require sharing data so I can take a closer look at things (like one run, 3 echoes, preprocessed), but my first guess would be that there is some scaling on the dicoms that is altering the relationship between the echoes, causing issues with the echo-time dependence. Can you confirm that the voxels in each timeseries have very different means?

Here for example, I have 3 echoes, and I’m plotting the timeseries of some voxels for each echo, TE1 is black, and has the highest mean, while TEs 2 and 3 (red, blue) are much less. This is after afni processing - these are the volreg datasets.

Plotting multiple with AFNIs Graph → Opt → Tran 1D → Dataset #N

in a related way, you can scale your data to percent signal change and see if the echoes behave like you might expect. Here I’ve found a different voxel and I’m showing the volreg data after scaling to percent signal change units

You can easily see that the magnitude of the effect increases over echo times, with the blue curve showing the largest fluctuations (despite being the echo (TE3) with the lowest signal before). This is the critical TE dependence effect that tedana depends on. Many voxels are not this clear, most even, but if you can poke around you should be able to find one that looks pretty good.

My quick PSC conversion done like so:

# create mean for each echo
3dTstat -mean -prefix mean_e01 pb02.sub-s2_mbme.r01.e01.volreg+orig.HEAD 
3dTstat -mean -prefix mean_e02 pb02.sub-s2_mbme.r01.e02.volreg+orig.HEAD 
3dTstat -mean -prefix mean_e03 pb02.sub-s2_mbme.r01.e03.volreg+orig.HEAD


# subtract mean and divide, multiple by 100 - now in percent signal units. 

3dcalc -a mean_e01+orig -b pb02.sub-s2_mbme.r01.e01.volreg+orig.HEAD -expr '((1-b)/a)*100' -prefix psc_e01 
3dcalc -a mean_e02+orig -b pb02.sub-s2_mbme.r01.e02.volreg+orig.HEAD -expr '((1-b)/a)*100' -prefix psc_e02 
3dcalc -a mean_e03+orig -b pb02.sub-s2_mbme.r01.e03.volreg+orig.HEAD -expr '((1-b)/a)*100' -prefix psc_e03

Edit1: Out of curiosity, what was the task? and full disclaimer - I’m not a GE user, I’m just guessing here that there could be some scaling applied to the data as it comes out of the scanner.

Edit2: I keep thinking of things - the data look very …unform in intensity. Could be completely wrong - but was there any filtering applied, anything to normalize the values across the volumes?

Thank you so much. I really appreciate your replies, and I did not know about that graphing tool! Always happy to learn a new AFNI trick!

The raw echoes of my problematic new data look great. Red is 1, blue is 2, green is 3 - left panel.

But here’s what AFNI is feeding tedana after the volreg block, on the right panel. It’s all messed up, with the 2rd echo having the highest values, and the third sometimes in the middle. (I’m honestly not sure why the black curve shows up separately; ignore for now I guess.)

I confirmed that this is NOT the case for the pre-upgrade data that is coming through tedana successfully. At the same step in processing, right after the volreg block, the data looks as expected with the red (1st echo) curve being the highest, then blue, then green. I can’t upload another screenshot due to the 1-image limit. It’s hard to imagine what has happened to cause this, since it’s literally the exact same afni_proc.py options in both cases…

In case it’s relevant I’ll add that we know the new data has 32-bit encoding, whereas previous data had 16-bit encoding. I’m sort of imaging some kind of arithmetic error as a result of that… EDIT: nevermind, our MR physicist just told me he realized it’s converted to 16bit before export, so that is not the problem.

Edit: to answer your questions, it’s a block design task in which the participant is shown two colors, each filling half the screen, and must very quickly decide (trial length 650ms) which side of the screen shows their target color, which they are reminded of at the beginning of each 20s block. They respond using a button box. Between each block there is 20s of rest with a fixation cross. The task has 2 runs; in the first run the target colors are always the same and in the second run we confuse them by making previous target colors distractors. It measures the phenomenon “proactive interference”.

And if there’s any filtering or normalization, we don’t know about it - the data is being treated identically to our old data - but we’re confused too.

Very relevant update: I found (one of) the problem(s). It looks like the raw echoes are being loaded into AFNI in a scrambled order right before the first block (tcat). I don’t know why yet (I’m specifying a folder, not individual echoes, and this step has worked in the past), but I will figure it out, and that’s almost certainly the problem here, so I didn’t want anybody to waste time diving into more mysterious solutions just yet. I have some other tasks that also aren’t finding BOLD components, and this problem does not seem to exist in that data, nor in my colleague’s, so we may have two issues, but for now, one of them seems to be sorted.

2 Likes

That’ll definitely cause some trouble. I would think the way you are doing it (enii) would sort, but sometimes things get tricky.

We’ve also made several updates to tedana since version 0.0.12 - not sure if that will help with your other problems, but it is probably worth updating. Good luck!

(as for the black curve - the graph view will always show your underlay in black - so in the first panel, you had some underlay, then added 3 datasets to view - and one of those was the same as the underlay - in the 2nd panel, you’ve selected 3 new ones - but the underlay was still there. so definitely nothing to worry about).

1 Like

Depending how you set up afni_proc, it’s possible that it’s reading in the files in alphabetical order and the file names from the new scanner are alphabetized out of echo order. Not sure this is the issue, but figured I’d mention.

Yep, that was basically it. Fixed now, and I wrote a new script to rename the echoes in a better way.

I’m now getting 3 accepted components out of 34. That’s definitely on the low side compared to what I’m used to, but much better!!

1 Like

Going from a voxel size of (3 x 3 x 3 mm) to (1.7 x 1.7 x 2 mm) is a -78% relative SNR change.
My personal experience : with such higher thermal noise, TEDANA will struggle decomposing the signal.