Not sure if this is the right place to ask, but still. What do people use to draw and label retinotopic maps based on functional (polar angle + eccentricity) and anatomical data? In our lab we use TkSurfer but it is quite outdated, so I was wondering if there are newer & better free tools available.
1 Like
Hey @achetverikov,
did you check pycortex already? As you can guess by the name it’s implemented in python and additionally freely available from the project’s github page, with the installation and setup process described here. I think it’s very neat and might just do what you want. There’s even a cool retinotopy demo you can check.
HTH, best, Peer
1 Like
thanks, it’s on my list!
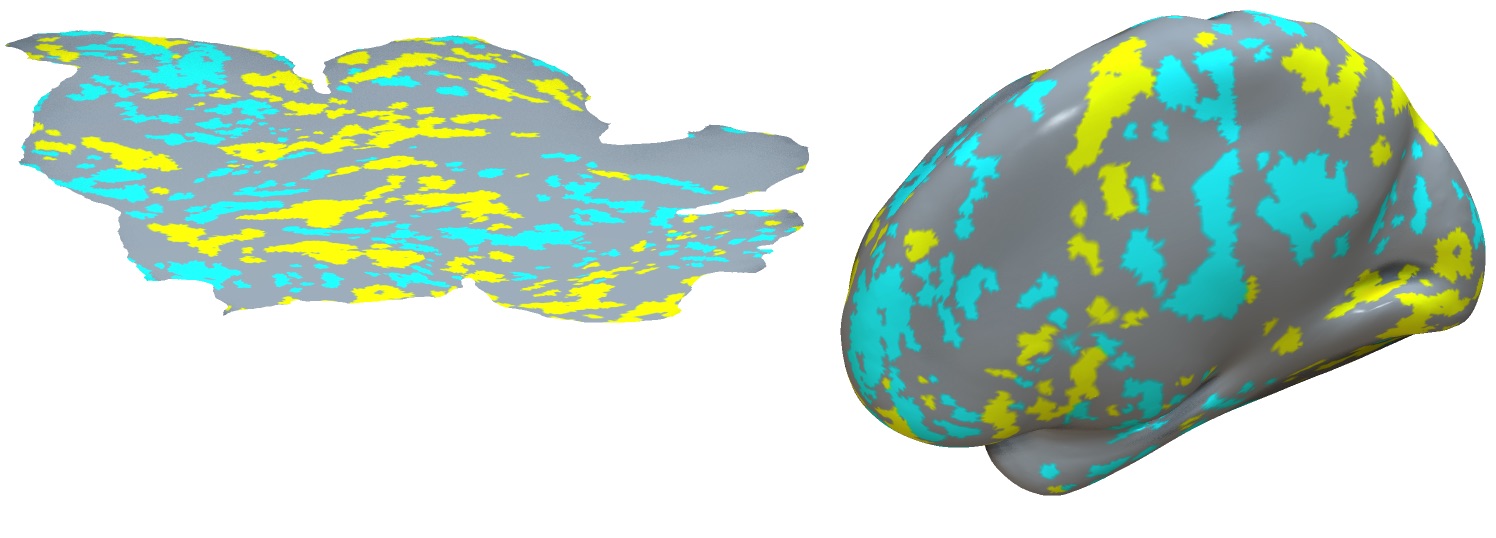
What format are your maps saved in. Is your data using a format supported by Surfice:e.g. GIfTI, FreeSurfer or a similar? If so you can visualize your data using Surfice - either via the user interface or by selecting the Advanced/Scripting language.
This script generates the attached image from the sample dataset included with Surfice.
This is the script using the inbuilt scripting language:
BEGIN
resetdefaults();
meshload('Human.colin.Cerebral.R.VERY_INFLATED.71723.surf.gii');
overlayload('Human.colin.R.activations.label.gii');
savebmp('inflated.png');
meshload('Human.colin.Cerebral.R.FLAT.CartSTD.71723.surf.gii');
overlayload('Human.colin.R.activations.label.gii');
savebmp('flatmap.png');
END.
Assuming you have Python installed, you could write this same script as:
import gl
gl.resetdefaults()
gl.meshload('Human.colin.Cerebral.R.VERY_INFLATED.71723.surf.gii')
gl.overlayload('Human.colin.R.activations.label.gii')
gl.savebmp('inflated.png')
gl.meshload('Human.colin.Cerebral.R.FLAT.CartSTD.71723.surf.gii')
gl.overlayload('Human.colin.R.activations.label.gii')
gl.savebmp('flatmap.png')
Note if you are unfamiliar with the scripting commands you can select them from the ‘Insert’ menu - the selected function is inserted into your code and a description of the function appears in the lower portion of the scripting window.
1 Like
thanks! will check it out. Does it allow to actually draw the labels and ROI boundaries?
If you have the ROI boundaries as a separate GIfTI file (the ‘label’ file in the example below) you can overlay this as an additional overlay to display that as well. You can adjust the transparency and order of the overlays if you want to mix the colors of the ROI boundary and your statistical map.
It does not insert a text legend for the labels. You could either add this in with your favorite graphics editor or update Surfice to do so (and issue a pull request so you can share your results). The GIfTI format does allow named labels, but this is not a feature of other formats, so I think this feature would limit your input formats.
import gl
gl.resetdefaults()
gl.meshload('Human.colin.Cerebral.R.FLAT.CartSTD.71723.surf.gii')
gl.overlayload('Human.colin.R.activations.label.gii')
gl.overlayload('Human.colin.R.FUNCTIONAL.71723.func.gii')OK, I see, but what I meant is not overlaying existing ROIs, but actually drawing their borders by hand on inflated or flattened surface, like you can do in TkSurfer.