Bandpass filtering: different outputs from FSL and nipype custom function

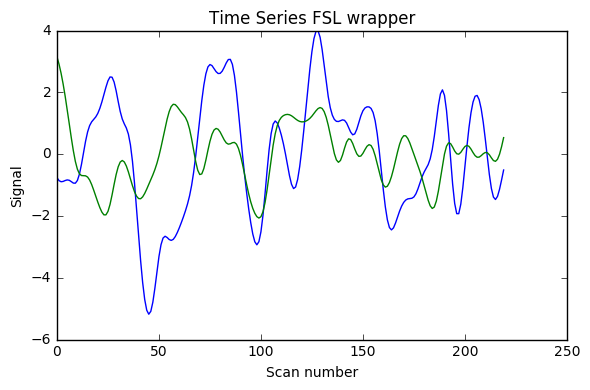
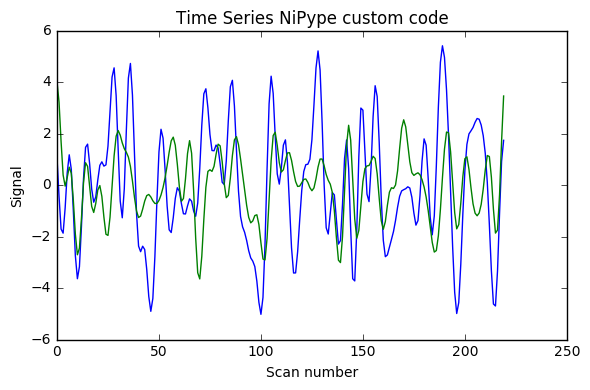
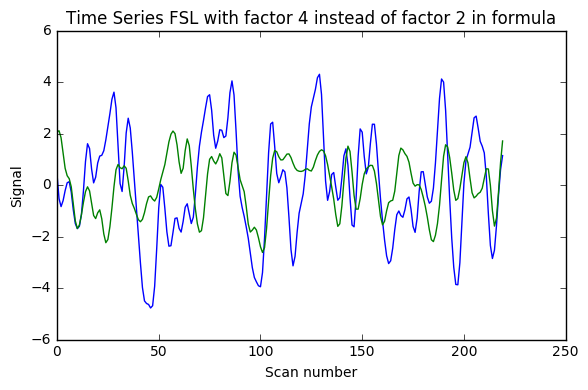
I implemented [0.008, 0.08] Hz band-pass filtering with both the FSL wrapper (with sigma = 1 / (2 * TR * cutoff_freq) as indicated here) and adapting for Python 3 the nipype code shown in this example (function bandpass_filter), using the code below. As can be seen in the image the results are very different (with what seems something like a factor 2 too much somewhere). Would anyone have suggestions why? (I double-checked that running the FSL command line gave the same results as the FSL wrapper below)

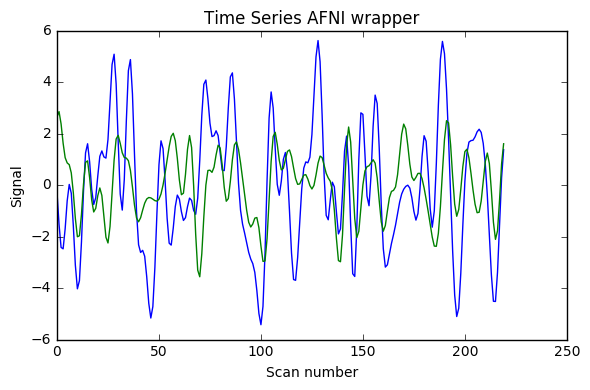
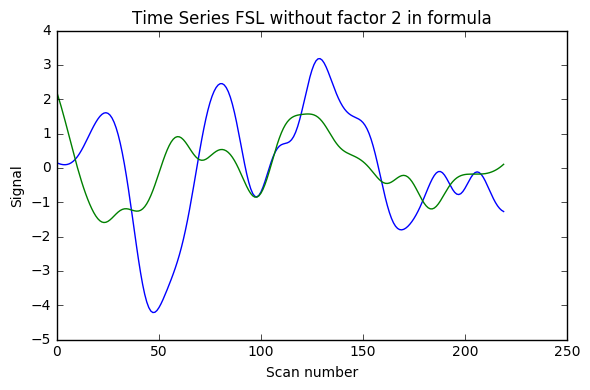
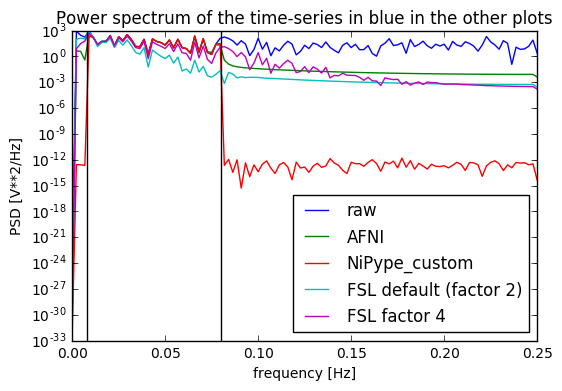
Update 1: I also added AFNI wrapper output which is very similar to nipype custom code, and FSL calculations without factor 2, and with factor 4 instead of 2.

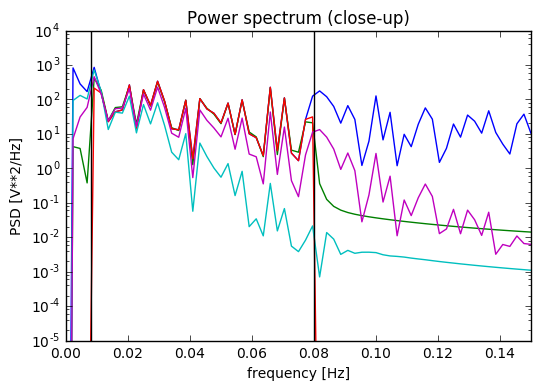
Update 2: I added at the very end a plot of the power spectrum of the time series, and it seems only NiPype custom function does what is intended.

HP_freq = 0.008
LP_freq = 0.08

### FSL
from nipype.interfaces.fsl import TemporalFilter
TF = TemporalFilter(in_file=in_file, out_file=out_file, 
                    highpass_sigma = 1 / (2 * TR * HP_freq),
                    lowpass_sigma = 1 / (2 * TR * LP_freq))
TF.run()

### Nipype custom example
    import os
    import numpy as np
    import nibabel as nb
    sampling_rate = 1./TR
    img = nb.load(in_file)
    timepoints = img.shape[-1]
    F = np.zeros((timepoints))
    lowidx = timepoints // 2 + 1 # "/" replaced by "//"
    if LP_freq > 0:
        lowidx = int(np.round(LP_freq / sampling_rate * timepoints)) # "np.round(..." replaced by "int(np.round(..."
    highidx = 0
    if HP_freq > 0:
        highidx = int(np.round(HP_freq / sampling_rate * timepoints)) # same
    F[highidx:lowidx] = 1
    F = ((F + F[::-1]) > 0).astype(int)
    data = img.get_data()
    if np.all(F == 1):
        filtered_data = data
    else:
        filtered_data = np.real(np.fft.ifftn(np.fft.fftn(data) * F))
    img_out = nb.Nifti1Image(filtered_data, img.get_affine(),
                             img.get_header())
    img_out.to_filename(out_file)

### AFNI
from nipype.interfaces import afni
bandpass = afni.Bandpass(in_file=in_file, highpass=0.008, lowpass=0.08, 
                         despike=False, no_detrend=True, notrans=True, 
                         tr=2.0, out_file=out_file)

### FSL without factor 2 in formula

### FSL with factor 4 instead of factor 2 in formula

FSLnipypeAFNIFSL_withoutfactor2FSL_withfactor4power_spectrumpower_spectrum_closeup

3 Likes

FSL’s temporal filter is not well suited for anything other than high pass filtering. IIRC, it is implemented as a gaussian filter.

The bandpass filter code uses FFT based filtering. While the filter is ideal in this case, since it is constructed in the frequency domain, the FFT transformation is not. Since a compact representation in the Fourier domain can only come from an infinite time series signal.

The easiest way to empirically test the code, would be to create a white noise time series, run it through both approaches and look at the power spectrum or even the spectrum or spectrogram of the output.

@satra thanks a lot for the answer. I will do the experiment you suggest (although I cannot just now).

From the updated post which includes the output from FSL run with a factor 2 (expected to be correct) and a factor 4 (not expected correct) it seems the latter is very similar to AFNI and nipype filter code outputs (and should have a very similar spectrum to these).

Could it be possible that FSL bandpass filtering should be run with a factor around 4 instead of 2?

The experiment will probably answer this question and I’ll do it when I have a bit more time.

@satra In the end I just did the power spectrum calculations (cf second post update). It seems Nipype custom function does the best job, followed by AFNI which does not reduce the unwanted frequencies as strongly.

Would you say that the output by AFNI have some advantages due to the smoother cut-off (e.g. to avoid Gibbs artifacts), or that the nipype custom function be preferred for its stronger frequency discrimination in that particular example?

@michael - afni is doing a pretty good job here. i would probably think it would be hard to find differences between the two (afni and nipype). if the number of samples is large, like HCP, i would probably be ok with the nipype one, however, for fewer samples, the smoothness of afni may help.

FYI: https://github.com/nipy/nipype/pull/2915

Hi Michael~ I am wondering whether you can tell me how to set up in_file and out_file when using afni.bandpass. I tried to use this function to do bandfilter after TSNR for rs-fmri datasets.

Here is part of code to run band filter.

from nipype.interfaces.afni import Bandpass
out_file=’/home/work_preproc/’
bandpass=Node(Bandpass(despike=False,highpass=0.01,lowpass=0.1,no_detrend=True,out_file=out_file),name=‘Bandfilter’)
preproc.connect([(detrend,bandpass,[(‘detrended_file’,‘in_file’)])])

I got the follow error:

{‘node’: work_preproc.Bandfilter.a0.b191,
‘traceback’: [‘Traceback (most recent call last):\n’,
’ File “/home/anaconda3/lib/python3.7/site-packages/nipype/interfaces/base/core.py”, line 482, in aggregate_outputs\n setattr(outputs, key, val)\n’,
’ File “/home/anaconda3/lib/python3.7/site-packages/nipype/interfaces/base/traits_extension.py”, line 317, in validate\n value = super(File, self).validate(objekt, name, value, return_pathlike=True)\n’,
’ File “/hom/anaconda3/lib/python3.7/site-packages/nipype/interfaces/base/traits_extension.py”, line 141, in validate\n self.error(objekt, name, str(value))\n’,
’ File “/home/anaconda3/lib/python3.7/site-packages/traits/trait_handlers.py”, line 236, in error\n object, name, self.full_info(object, name, value), value\n’,
“traits.trait_errors.TraitError: The ‘out_file’ trait of an AFNICommandOutputSpec instance must be a pathlike object or string representing an existing file, but a value of ‘/home/bandfilter+orig.BRIK’ <class ‘str’> was specified.\n”,
‘\nDuring handling of the above exception, another exception occurred:\n\n’,
‘Traceback (most recent call last):\n’,
’ File “/home/anaconda3/lib/python3.7/site-packages/nipype/pipeline/plugins/multiproc.py”, line 69, in run_node\n result[‘result’] = node.run(updatehash=updatehash)\n’,
’ File “/home/anaconda3/lib/python3.7/site-packages/nipype/pipeline/engine/nodes.py”, line 479, in run\n result = self._run_interface(execute=True)\n’,
’ File “/home/anaconda3/lib/python3.7/site-packages/nipype/pipeline/engine/nodes.py”, line 585, in _run_interface\n return self._run_command(execute)\n’,
’ File “/home/anaconda3/lib/python3.7/site-packages/nipype/pipeline/engine/nodes.py”, line 678, in _run_command\n result = self._interface.run(cwd=outdir)\n’,
’ File “/home/anaconda3/lib/python3.7/site-packages/nipype/interfaces/base/core.py”, line 384, in run\n outputs = self.aggregate_outputs(runtime)\n’,
’ File “/home/anaconda3/lib/python3.7/site-packages/nipype/interfaces/base/core.py”, line 487, in aggregate_outputs\n raise FileNotFoundError(msg)\n’,
“FileNotFoundError: No such file or directory ‘/home//research/bandfilter+orig.BRIK’ for output ‘out_file’ of a Bandpass interface\n”]}

I bet it is problem of out_file but realy do not know how to fix it.
Thank you for any help!

sorry for the ignorance, but what does TR stand for?

For MRI, TR refers to the Repetition Time. For fMRI and resting-state this is the sampling rate, So a 10 minute fMRI acquisition with a TR of 1.0s will have 600 volumes. The sampling rate will determine the Nyquist Frequency. The TR also impacts the image contrast and signal-to-noise (longer TRs allow more T1 recovery, hence more signal per image, albeit with fewer images in a given time).

1 Like