Checkerboard artifacts in mouse model nilearn CanICA analysis

Hello,

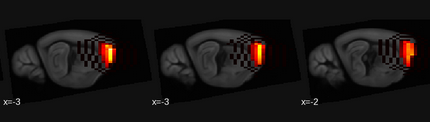
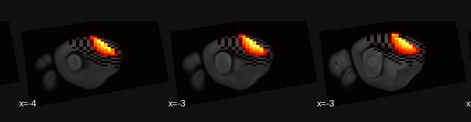
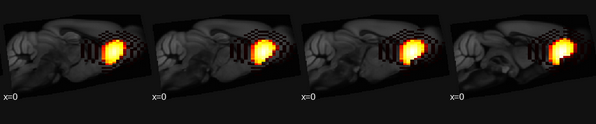
I’m seeking assistance with a persistent issue I’m encountering while performing ICA on mouse brain rs-fMRI data. Despite my efforts, checkerboard artifacts continue to appear around the components, and I’m unsure of the best approach to eliminate these artifacts.

For context, I’ve employed a standard preprocessing pipeline that includes slice timing correction, bias correction, motion correction, spike sorting, segmentation, normalization to the Allen Institute atlas, and initial smoothing with a 4x3x2 voxel kernel (I intentionally applied this initial smoothing to minimize the need for further smoothing during ICA), filtering in the range [0.01; 0.22].

I’ve used the CanICA algorithm from nilearn with the following parameters:

canica = CanICA(mask=mask, n_components=Ncomponent, memory="nilearn_cache", memory_level=2, verbose=0, random_state=0, detrend=False, threshold='auto', standardize=True, n_init=10, low_pass=None, high_pass=None, mask_strategy="background", n_jobs=1)

I would greatly appreciate any suggestions!
Screenshot from 2023-11-22 11-49-36
Screenshot from 2023-11-22 11-49-12
Screenshot from 2023-11-22 11-48-47

I don’t know if this will be helpful at all, but those look like interpolation artifacts that arise from high order (or sinc/Fourier) based interpolation methods. I wouldn’t expect those to come out from a PCA/ICA step, but if these components are transformed after they are made its possible I think.

Are those values, in the black rings, very low intensity numbers? How are you viewing the images? Is there any sort of interpolation involved in producing these images?

Thank you for your prompt response. The voxel values in the black areas are approximately -0.02 when visualizing the components using tools like mrview. The images above were generated using the plot_stat_map function from the nilearn library, with the following parameters:
plot_stat_map(cur_img, bg_img=atlas, display_mode="mosaic", title="Comp %d" % (i+1), cut_coords=12, colorbar=False)
To the best of my knowledge, there is no explicit interpolation applied during the generation of these images…

That value makes me think its interpolation related, but I struggle to see how it could have occurred. I’m not familiar with the code that was used - and even if motion correction or normilization was performed with some fourier-type inerpolation, i don’t imagine it would show up in component maps (but could be wrong). I’m at a bit of a loss.