Checkerboard pattern in fMRIPrep tSNR output images

Summary of what happened:

Hello,

I am trying to select a sequence for a new experiment at 7T. We have two options: a single echo (SE) sequence and a multiecho sequence (ME). The SE has 1.2 mm isotropic voxels and the ME has 1.5mm isotropic voxels. I have preprocessed the raw images with fmriprep in native, T1w, MNI152NLin6Asym-res1, and MNI152NLin6Asym-res2. The images themselves look ok, but I am noticing a strange checkerboard pattern (most evident in the coronal view) in their tSNR:

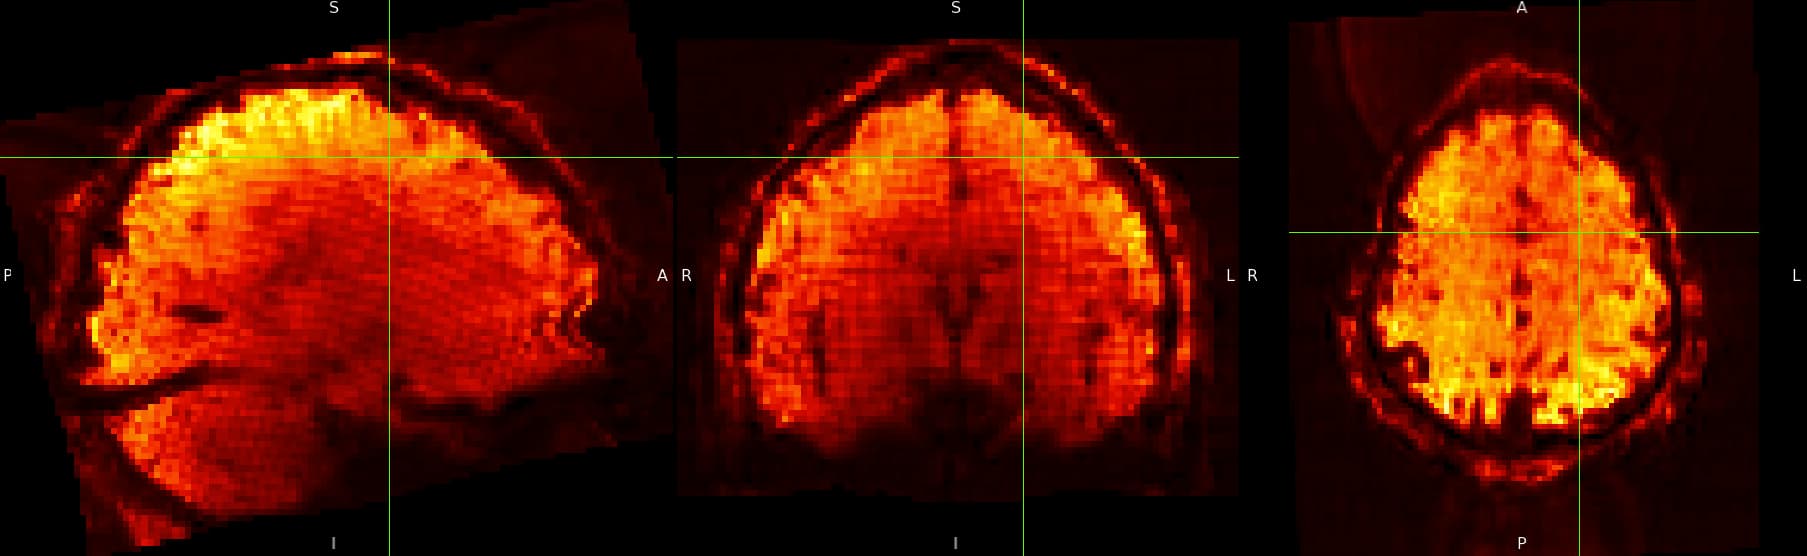
SE sequence in MNI152NLin6Asym-res1

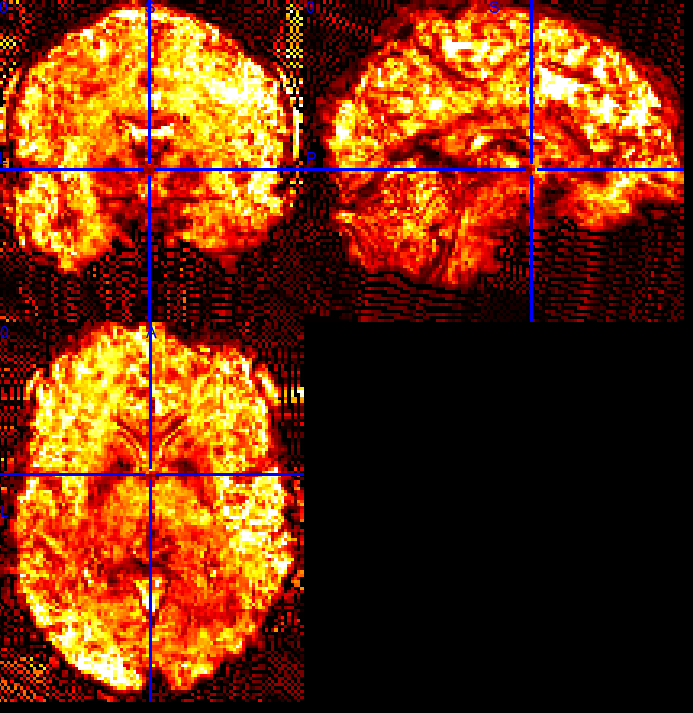
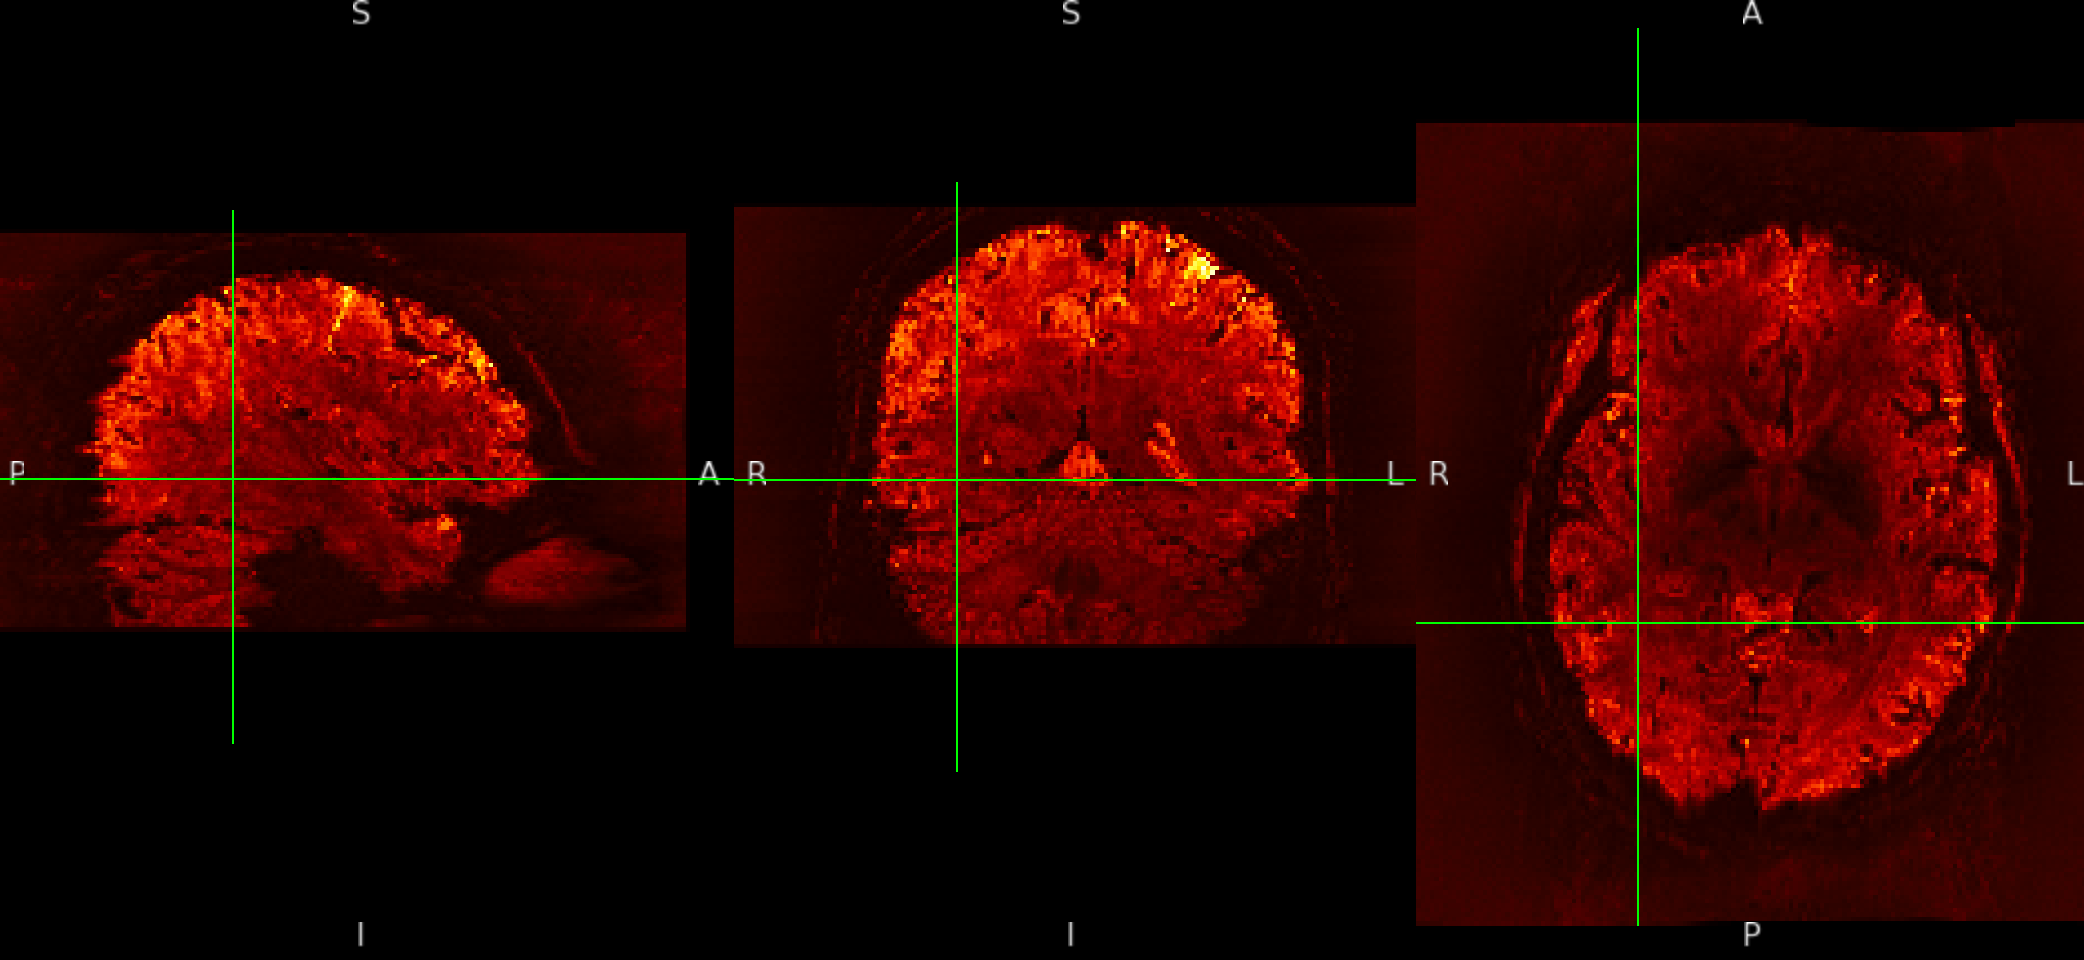
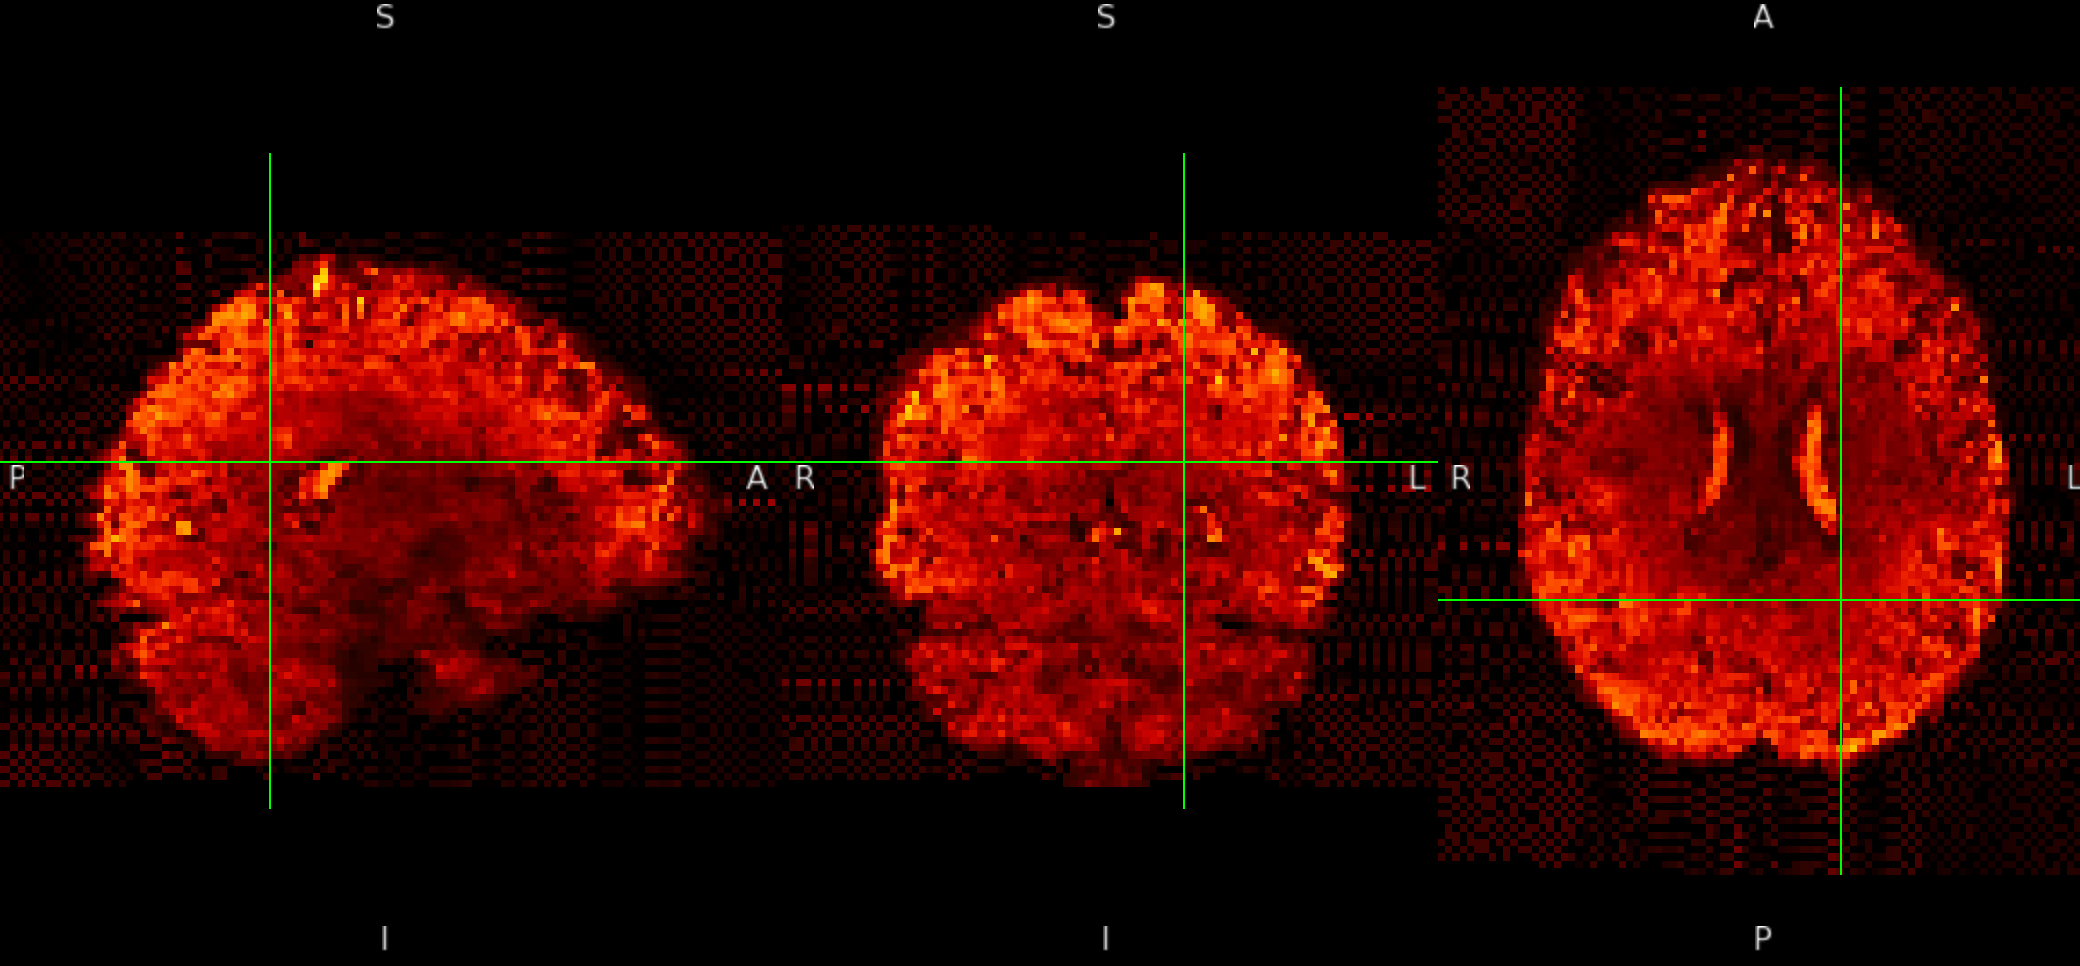
ME sequence in MNI152NLin6Asym-res1

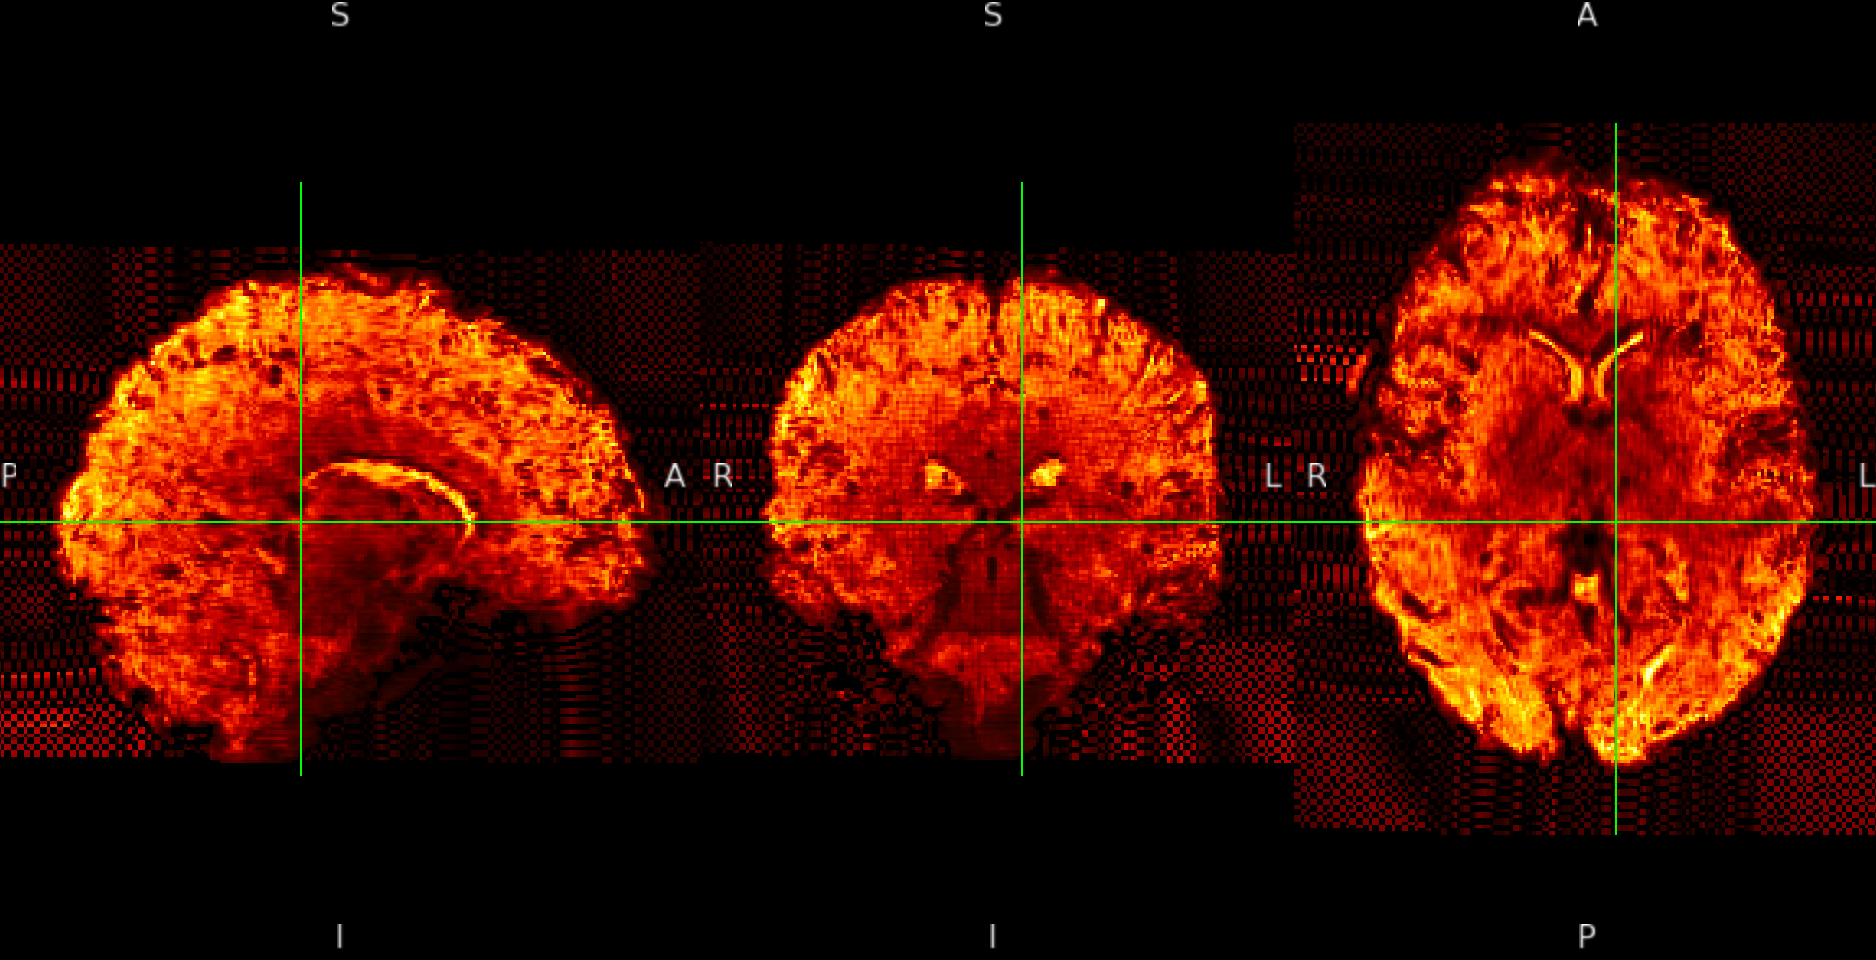
The checkerboard pattern is more evident in the ME sequence where it is also visible outside the brain, but it is present in both, ME and SE inside the brain.

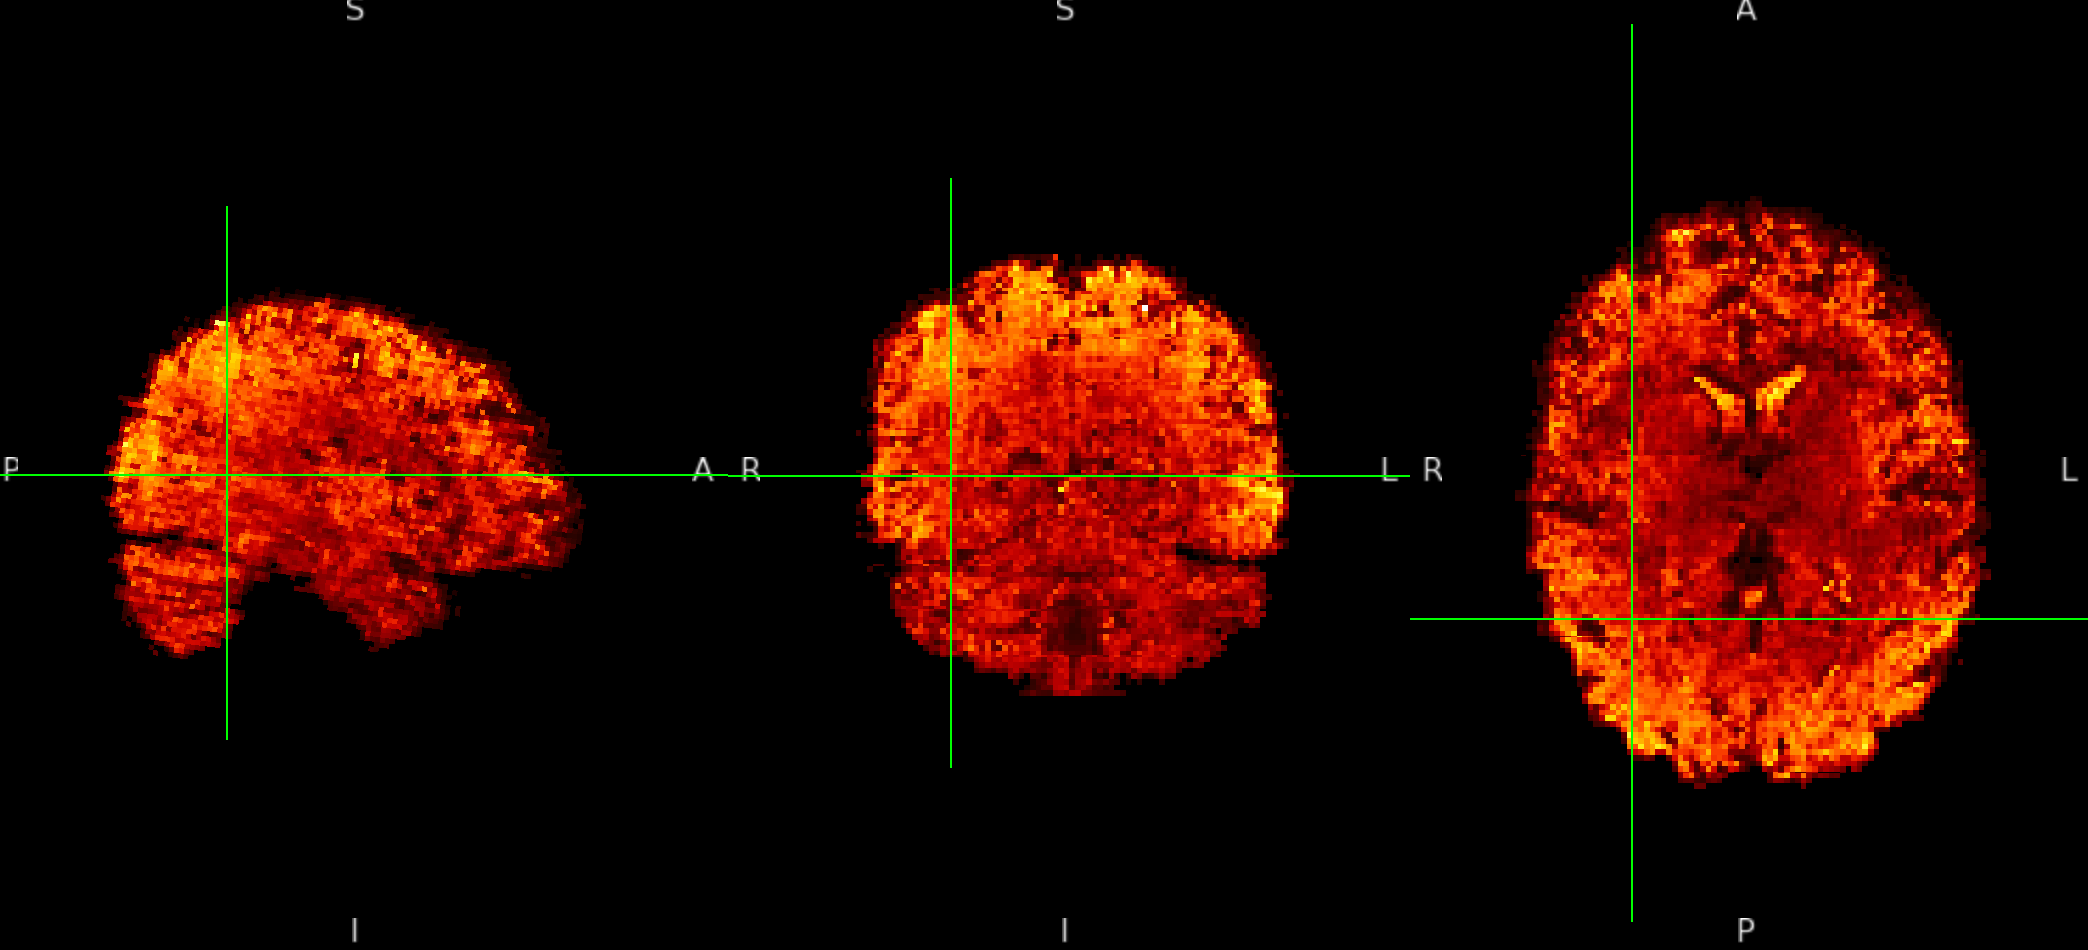
The pattern is not present in the raw data. It is not present either in the fmriprep native space. For example,

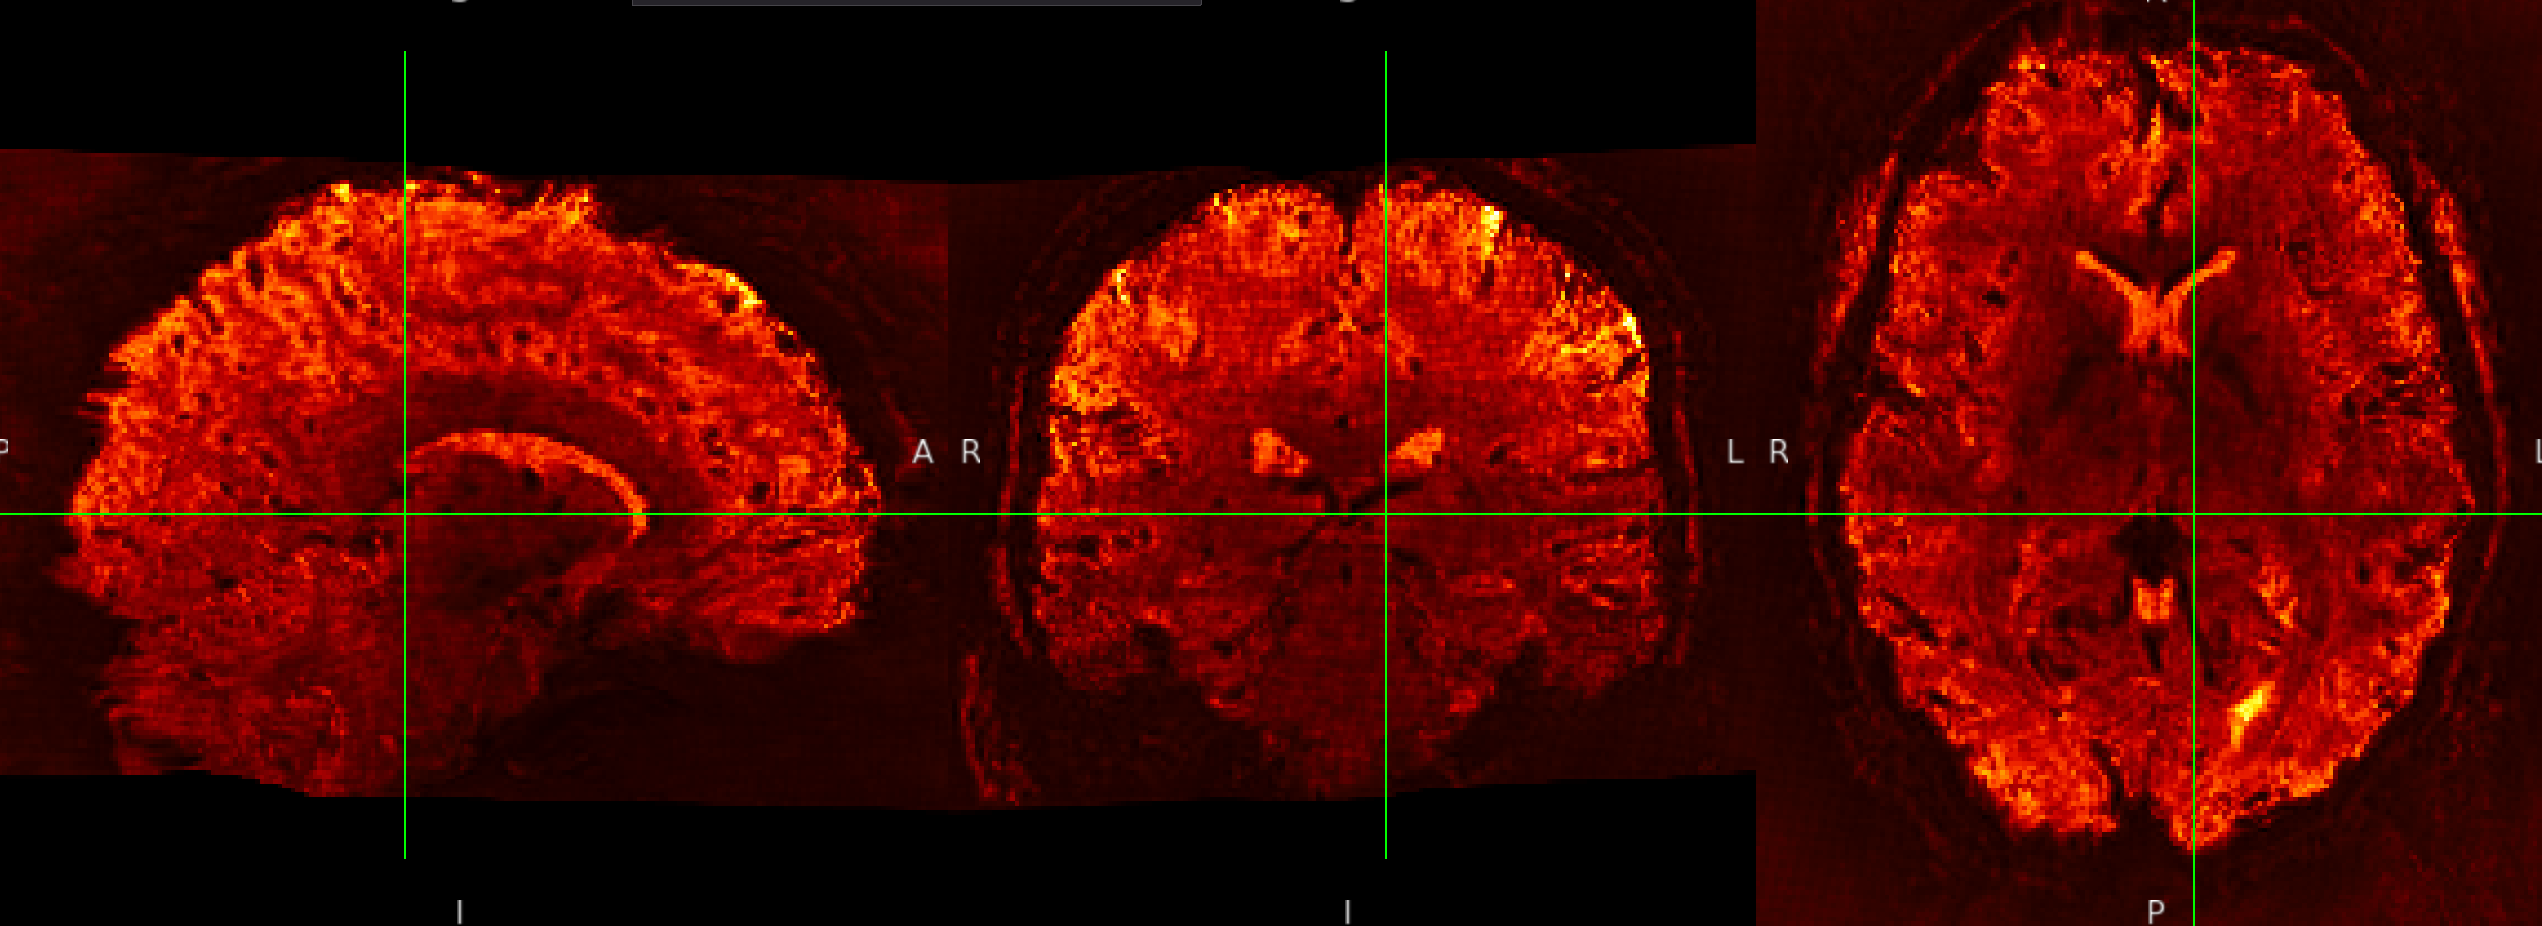
SE sequence in native:

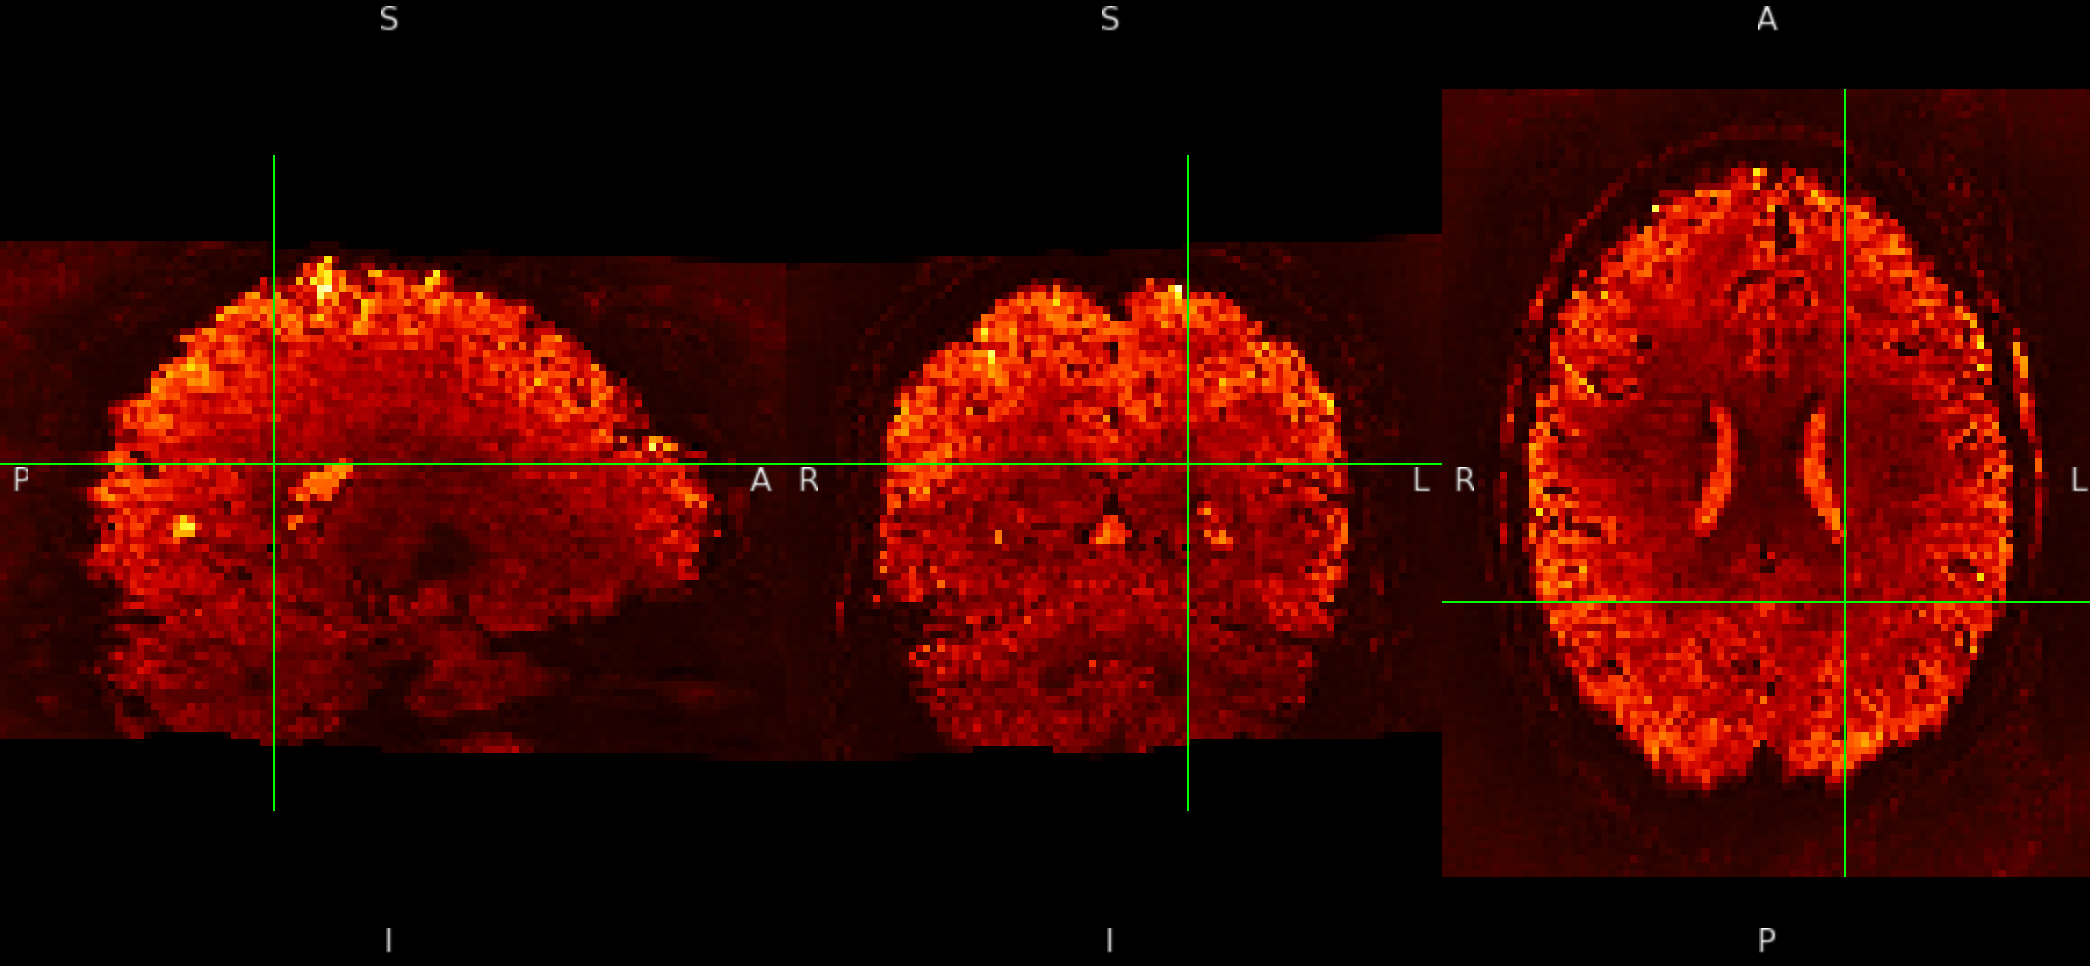
ME sequence in native:

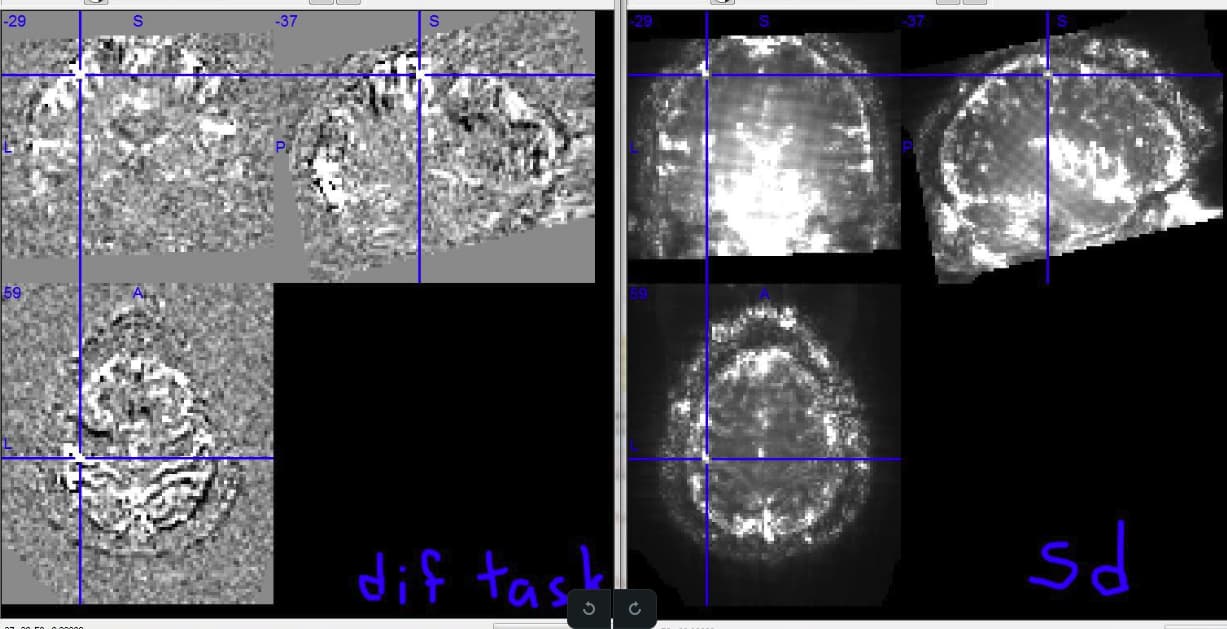
And although it is not visible for the SE sequence in MNI152NLin6Asym-res2, it is visible outside the brain in the ME sequence in MNI152NLin6Asym-res2

SE sequence in MNI152NLin6Asym-res2

ME sequence in MNI152NLin6Asym-res2

I am here puzzled over:

  1. why is this pattern visible only at MNI 1mm resolutions? Please remember that my voxels are between 1.2 and 1.5 mm isotropic.
  2. Could this be related to the Lanczos interpolation?
  3. why is the pattern exacerbated in the ME sequence? Is it the echo combination?
  4. What could be done to solve this?

Thank you so much!

-Ana

Commands used (and if a helper script was used, a link to the helper script or the command generated):

  • to compute tsNR:
fslmaths bold.nii.gz -Tmean bold_mean.nii.gz
fslmaths bold.nii.gz -Tstd bold_std.nii.gz
fslmaths bold_mean.nii.gz -div bold_std.nii.gz TSNR_map.nii.gz
  • for fMRIprep:
singularity run --cleanenv \
    -B $SINGULARITYENV_TEMPLATEFLOW_HOME:/home/.cache/templateflow \
        ./singularity_images/fmriprep-24.1.1.simg \
    ${BIDS_DIR} \
    ${BIDS_DIR}/${DERIVS_DIR} \
    participant --participant-label ${subject} \
    -w ${WORK_DIR} \
    --output-spaces MNI152NLin6Asym:res-1:res-2 T1w func \
    --ignore slicetiming \
    --fs-no-reconall \
    --fs-license-file ./singularity_images/freesurfer_license.txt \
    --fd-spike-threshold 0.2 \
    --notrack \

Version:

fmriprep . 24.1.1

Environment (Docker, Singularity / Apptainer, custom installation):

singularity

Data formatted according to a validatable standard?

The data is in BIDS format and was validated before running the command using the online BIDS validator. The command I used also forced the validation and there are no errors reported in the html. Is this enough?
Unfortunately, I deleted all working directories and I do not know where to get this info. How can I access it?

Relevant log outputs (up to 20 lines):

The command ran successfully… so I am unsure what is needed here. Could you be more specific of what should I be looking for?

Screenshots / relevant information:

nipype_version = “1.8.6”
templateflow_version = “24.2.0”
fmriprep version = “24.1.1”
fsl version 6.0.7


I don’t have an answer, but do see something similar in our 7T multi-echo BOLD, particularly when using fMRIprep (this is 25.2) calling tedana for optimal combining of the echoes (not running Tedana separately). I haven’t noticed as pronounced checkerboarding on the brain as in your images, but do see it in the surrounding space.

For example, here is a tSNR from a multiecho 3, multiband 6, GRAPPA 2 BOLD run, acquired and kept at 1.6 mm iso voxels. (Yes, this is a lot of acceleration; we’re piloting.)

Some time ago I had a dataset (3T single-echo) with obvious checkerboarding on the brain. I believe we decided it was related to the spatial normalization (to MNI atlas space), and would look different with different preprocessing software and in each person (i.e., since their brain needed different warping to the template). I’d need to review my notes, but think we ran some magnitude checks, and concluded that the checkerboards looked strong in white matter in QC images, but weren’t actually affecting grey matter BOLD enough to substantially affect the analyses.

Happy to share more details/images/whatever if they could help the investigations; I’ll also keep an extra eye out for on-the-brain checkerboards in our tests.

Thank you @jaetzel!
Our ME is MB 4 and GRAPPA 3 with 1.5mm voxels, so it has some acceleration too.

I wanted to ask you two questions:

  1. Have you tried using Tedana separately from fmriprep? (My first time doing ME so I am not even sure this is ok to do), and does it show the pattern?
  2. How did you check that the checkerboard pattern was not affecting GM too much? I have tried masking the tSNR maps for GM only, but they are such a thin part of the volume that I find difficult to discern with the naked eye.

And just to add some info, the pattern is also visible in 3T SE images (raw data at 3mm, co-registered to MNI-res2mm with fmriprep v. 24.1.1)

Thanks!

No, I’ve only had fmriprep call Tedana. (I’m also very new to multi-echo.) It definitely is possible to use them separately, however; I believe that was the only option until quite recently. We have been comparing the results of preprocessing multi-echo runs with fmriprep calling tedana for optimal combination vs. preprocessing individual echoes with fmriprep alone (i.e., as if they were single echo runs). The checkerboarding around the brains in tSNR and other QC images only appears in the optimal-combination version, so I assume it is caused by something in the Tedana pipeline.

Digging through my notes, the cases I was thinking of were back in 2018; a 3T single-echo task fMRI dataset. Below is one of the images I made back then to describe the comparisons. Right is a temporal standard deviation image for a single person & run, showing a weird checkerboard sort of pattern. The left side is the same person & run, but after averaging the frames after button pushes. ("dif task’ since I did a simple subtraction of button-push frames from matched averaged no-button-push frames.)


The crosshairs are in left motor, which, as expected, is bright in the difference image. (Visual and some other areas are also bright, because the task displays/etc. were also different at the times when a button press was required.) I looked at a number of these sorts of difference and event-related images, and did not spot checkerboards. We speculated that small differences in noise caused the standard deviation checkerboards, but that task analyses (simple averaging, GLMs, etc.) washed it out.