Hey!
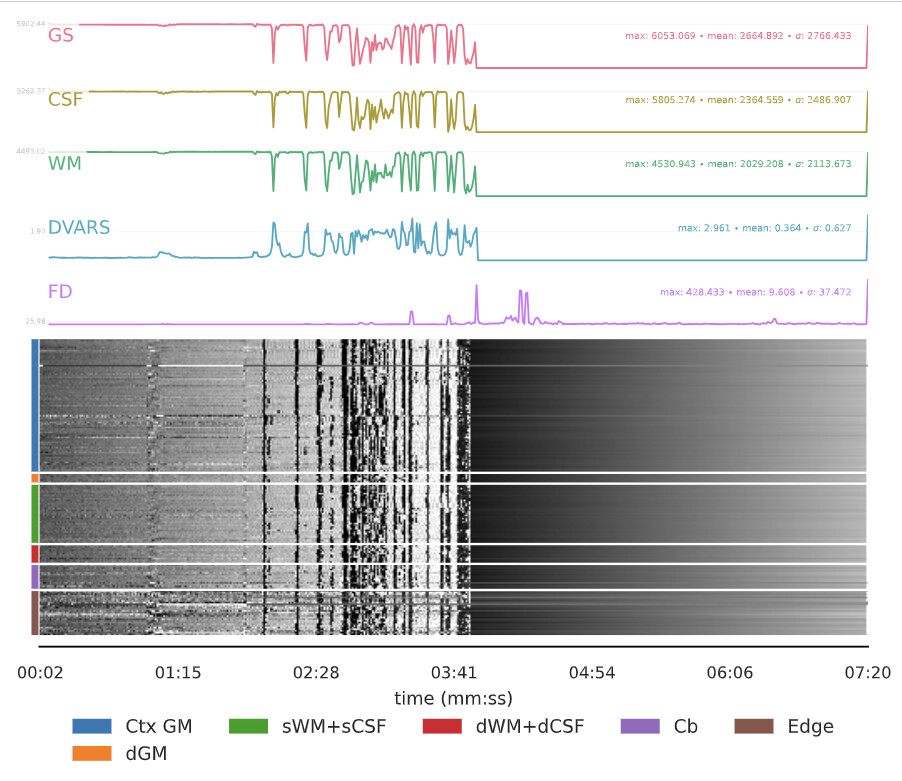
I have been processing several recent subjects through fMRIprep, but have gotten some peculiar BOLD Summary plots that I’m having trouble making sense of. [Please refer to the attached images]
This data was collected from a clinical subject pool, which is prone to movement, but I don’t understand what would explain these abrupt aberrations that then flatline. There were also issues with ghosting on brain maps and aCompCor components decomposition, if that might relate.
Have you looked at raw bold data in any nifti viewer to make sure there are no artifacts throughout the whole time series?
1 Like
It looks like extreme motion artifacts, which may have distorted the mask. Thank you!
Since you mentioned motion, the FD line is frame displacement and summarizes motion between frames for a fMRI time series in units of millimeters. The max FD in your plot is 428.433 which is huge. I generally see something like 5 mm or less.
That is odd, not sure would could induce that kind of effect. Unfortunately, I am going to exclude these runs from analysis, but I would be curious as to what the cause was.
Additionally, I got a series of errors about generating the dvars confounds. “ValueError: Cannot apply_along_axis when any iteration dimensions are 0”