Converting Philips Fieldmaps to BIDS and finding Echo time 1 and Echo time 2

Dear Experts

I am running BIDSify on some philips acquired PAR/REC images (can’t get dicoms at this point - all subjects are scanned), I had several related questions I was hoping I could get some feedack on.

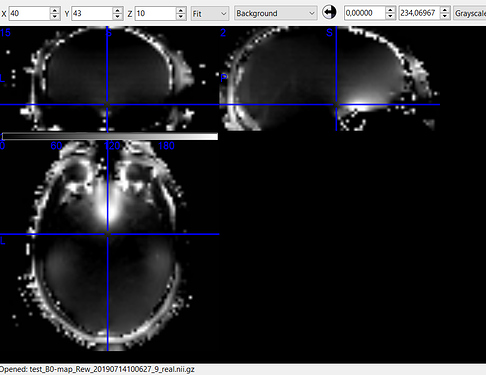
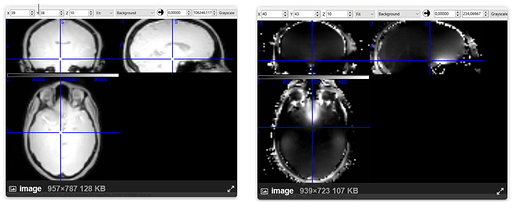
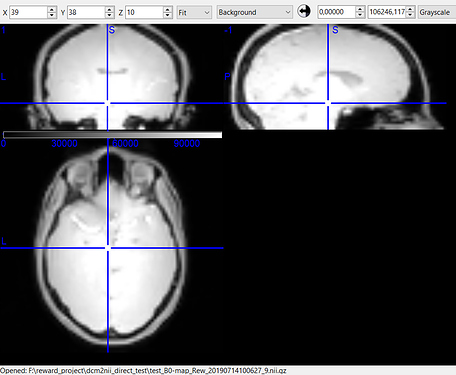
  1. While there was a single PAR/REC file associated with the fieldmap acquired for each bold image, it is composed of two images. When I run BIDSify, the only keys it allows to convert the file into are to a _magnitude1 and _phasediff suffix, and seems to automatically assign them. However, when I run dcm2niix directly, I get a suffixless.nii file, and a _real.nii file. Which of the two interpretations of the derived images is correct? I’ve read many forums, and @Chris_Rorden’s fieldmap page, but I’m still not sure. The first seems like either a real or imaginary file, while the second seems like either a phasediff or actual fieldmap. Here are the images. Any suggestions?

Image A - filename_magnitude1.nii (BIDSify conversion); filename.nii (direct dcm2niix conversion)

Image B - filename_phasediff.nii (BIDSify conversion); filename_real.nii (direct dcm2niix conversion)

  1. The next question is related to the echo times. When I run BIDSvalidator, I get the following error:

“[ERR] You have to define ‘EchoTime1’ and ‘EchoTime2’ for this file. (code: 15 - ECHO_TIME1-2_NOT_DEFINED)e[39m
./sub-005/fmap/sub-005_phasediff.nii.gz
Please visit https://neurostars.org/search?q=ECHO_TIME1-2_NOT_DEFINED

The .json files are actually identical, except for the PhilipsRescale values. Here is the .json file for Image B.

Image B ( _real / phasediff) .json

“Manufacturer”: “Philips”,
“PatientPosition”: “HFS”,
“SeriesDescription”: “ImageMRSERIES”,
“ProtocolName”: “B0-map_Rew”,
“SeriesNumber”: 9,
“AcquisitionNumber”: 9,
“ImageComments”: “MRISCHEDELNIETSCREENEN”,
“PhilipsRescaleSlope”: 0.2442,
“PhilipsRescaleIntercept”: -500,
“PhilipsScaleSlope”: 4.095,
“UsePhilipsFloatNotDisplayScaling”: 1,
"EchoTime": 0.0032,
"RepetitionTime": 0.2,
"ReconMatrixPE": 80,
“ImageOrientationPatientDICOM”: [
0.999805,
-0.0197051,
0.00105441,
0.0197209,
0.995862,
-0.0887169 ],
“ConversionSoftware”: “dcm2niix”,
“ConversionSoftwareVersion”: “v1.0.20200331”

As mentioned, The EchoTime value of 0.0032 is the same for both images. So, assuming they ARE a magnitude and a phasediff, where would I get the Echo time 2 value, since I only have one magnitude image? Additionally, looking at the Scan Settings sheet (see box below), it says Echoes = 1. Does this mean it was not run as a multi-echo fieldmap? If so, is that a problem? What value would I put for the second echo to make this BIDS compliant?

  1. Relatedly, I am trying to derive the WaterFatShift EffectiveEchoSpace and TotalReadoutTime values that BIDS is asking for. I have read several posts here on neurostars, github, and jiscmail about this, and feel I am close to cracking this for my dataset. The most robust formula is possibly the following:

But I understand that there are a few settings which could make calculations unrelieable. I have values for all of the variables, but I couldn’t figure out what the ImagingFrequency variable was (I don’t have access to dicom tag numbers)… Is that the BW (Hz) field from the scanner settings sheet (i.e. 499.2)? Or a constant value (e.g. resonance frequency (MHz/T) = 42.576 from the Brainvoyager guide)

The other formula that seems to be used frequently is the OSF/Spinoza Center formula as discussed here:

where

ETL = EPI factor + 1

Here are key values from the original fieldmap .PAR file, which seems to have most of the information:

Examination name : MRI SCHEDEL NIET SCREENEN
. Protocol name : B0-map_Rew
. Examination date/time : 2019.07.14 / 10:06:27
. Series Type : Image MRSERIES
. Acquisition nr : 9
. Reconstruction nr : 1
. Scan Duration [sec] : 65.6
. Max. number of cardiac phases : 1
. Max. number of echoes : 1
. Max. number of slices/locations : 38
. Max. number of dynamics : 1
. Max. number of mixes : 1
. Patient position : Head First Supine
. Preparation direction : Anterior-Posterior
. Technique : FFE
. Scan resolution (x, y) : 80 80
. Scan mode : MS
. Repetition time [ms] : 200.000
. FOV (ap,fh,rl) [mm] : 220.000 114.675 220.000
. Water Fat shift [pixels] : 0.870
. Angulation midslice(ap,fh,rl)[degr]: 0.044 -1.132 -5.087
. Off Centre midslice(ap,fh,rl) [mm] : -5.381 30.249 -3.502
. Flow compensation <0=no 1=yes> ? : 0
. Presaturation <0=no 1=yes> ? : 0
. Phase encoding velocity [cm/sec] : 0.000000 0.000000 0.000000
. MTC <0=no 1=yes> ? : 0
. SPIR <0=no 1=yes> ? : 0
. EPI factor <0,1=no EPI> : 1
. Dynamic scan <0=no 1=yes> ? : 0
. Diffusion <0=no 1=yes> ? : 0
. Diffusion echo time [ms] : 0.0000
. Max. number of diffusion values : 1
. Max. number of gradient orients : 1
. Number of label types <0=no ASL> : 0

And here are the values from the Scanner Settings sheet, which has some more information:

ACQ voxel size RL (mm) = 2.75;
AP (mm) = 2.75;
Fold-over suppression = “no”;
Reconstruction matrix = 80;
SENSE = “no”;
k-t BLAST = “no”;
Stacks = 1;
type = “parallel”;
slices = 38;
slice gap = “default”;
slice orientation = “transverse”;
fold-over direction = “AP”;
fat shift direction = “L”;
Minimum number of packages = 1;
Slice scan order = “default”;
Patient position = “head first”;
Patient body orientation = “supine”;
Scan type = “Imaging”;
Scan mode = “MS”;
technique = “FFE”;
Fast Imaging mode = “none”;
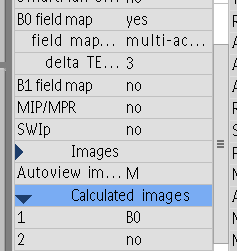
Echoes = 1;
partial echo = “no”;
shifted echo = “no”;
TE = “shortest”;
Flip angle (deg) = 30;
TR = “user defined”;
(ms) = 200;
Halfscan = “no”;
Water-fat shift = “maximum”;
Shim = “auto”;
SAR mode = “high”;
B1 mode = “default”;
Gradient mode = “default”;
Temporal slice spacing = “default”;
fMRI echo stabilisation = “no”;
B0 field map = “yes”;
field map technique = “multi-acquisition”;
delta TE (ms) = 1;
B1 field map = “no”;
MIP/MPR = “no”;
Images = “M”, (3) “no”;
Calculated images = “B0”, (3) “no”;
Reference tissue = “Grey matter”;
Reconstruction mode = “immediate”;
Uniformity correction = “no”;
Geometry correction = “default”;
Total scan duration = “01:05.6”;
Rel. SNR = 1.05433738;
Act. TR/TE (ms) = “200 / 3.2”;
ACQ matrix M x P = “80 x 80”;
ACQ voxel MPS (mm) = “2.75 / 2.75 / 2.75”;
REC voxel MPS (mm) = “2.75 / 2.75 / 2.75”;
Scan percentage (%) = 100;
Act. WFS (pix) / BW (Hz) = “0.870 / 499.2”;
Min. WFS (pix) / Max. BW (Hz) = “0.178 / 2441.4”;
Min. TR/TE (ms) = “130 / 3.2”;
Head SAR = “< 13 %”;
Whole body SAR / level = “0.0 W/kg / normal”;
Max B1+rms = “0.83 uT”;
PNS / level = “46 % / normal”;

  1. One thing that sticks out, is that the EPI_factor from the .PAR file is 1, whereas in the fucntional BOLD images, the value is 31. Is it a potential problem that EPI_factor settings do not match, when it comes time to use the fieldmap for distortion correction? Also, is EPI_factor related to SENSE? Because the second thing that jumped out was that the fieldmap acquisition was not run with SENSE, (the scan setting sheet says SENSE = “no”).

  2. Finally, related to the last point, I wanted to make sure the formula I am using is correct. If no partial fourier was used, and there was no acceleration (could I be wrong about this?), would the folowing calculation based on the second formula above be valid and correct? (I did not calculate the first formula because I do not know what the imagingFrequency variable is)

effective echo spacing = (((1000 * WFS)/(434.215 * (ETL+1))/acceleration)

= (1000 * 0.87)/(434.215 * 3) = 0.668

Where

WaterFatShift = 0.87
ETL = EPI_Factor + 1 = 2
No acceleration

And

TotalReadOutTime = EffectiveEchoSpace * 79 = 52.76

Where

ReconMatrixPE = 80

Sorry for the lenght, but I think including all this information may be helpful to other Philips users struggling with this same issue. Thanks ahead for any observations/comments!!

Best,
Carlos
1 Like

Notes regarding dcm2niix conversion of the Philips proprietary PAR and REC formats is here. I would strongly encourage Philips users to export to enhanced DICOM rather than this undocumented proprietary format. I would heed the warning from a Philips engineer who notes that PAR/REC reflects simpler times, with this format lacking the verbosity to describe many sequence details.

The PAR file is a text file, and it is self-documenting to some degree. Unfortunately, some Philips tools handle this format differently, there are some unknown bugs, and some issues are not documented. For discriminating magnitude, real, phase, and imaginary data one relies on the
image_type_mr tag, though Philips never provides explicit documentation. You can use visual inspection to discriminate image type.

Notes on calculating readout time and effective echo spacing are here. I do not think the current PAR/REC format contains all the values required to determine the FSL definition (used by BIDS) of these values. However, if you provide the SENSE, partial Fourier, etc. you can determine these values. In general, you do not need to provide a valid value for these numbers: you will get the same results regardless. Precision is only required if you are using TOPUP where pairs of images have unmatched total readout time, or if you want to analyze the calibrated field map images.

dcm2niix is open source, and I do not have access to Philips hardware and my tools are based on a very limited sample of images. Feel free to extend my software and make pull requests if you want to share your improvements with others. You may also want to see if dicm2nii is a better tool for your application.

Finally, if you have PAR/REC images, it means you have a Philips research agreement in place. This will include a Research Collaboration Manager who is responsible for helping your center resolve any questions. In my experience (albeit with counterparts from Siemens), these experts are invaluable for understanding features of their equipment, software and images.

Thanks so much for your response Chris. Unfortunately, the data was already all collected at a different institution before I got involved in the project, so no chance for DICOMS, and getting a hold of the Philips rep seems quite difficult also.

Thanks for clarifying that the EES, and readout time are not necessary for distortion correction. However, I understand that echo time 1 and 2 are still needed, and from these two images, I can only find one echo time. My best guess from visual inspection is that
the first is a magnitude and the second a phase, which doesn’t help regarding the second echo time.

From the PAR file, the first image shows an image_type_mr value of 0 (ie magnitude), and echo of 3.2ms.The second image, however, has an image_type_mr value of 18, with an echo value of 0.

Matthew Clemence does mention in the post you kindly linked to, that there are numerous other options for image_type_mr beside 0=M,1=R,2=I,3=P values. Counting from zero on his list of alternatives, number 18 would correspond to “B0”, however, the above image does not look like a diffusionless B0 T2 image. Is there a chance it might be a calculated fieldmap? Do you know if he’s on neurostars and might help clarify this?

I’ve shown a few columns from the first row of each image (as a side note, scanning sequence column heading seems to be missing):

#  slice number                             (integer)
#  echo number                              (integer)
#  dynamic scan number                      (integer)
#  cardiac phase number                     (integer)
#  image_type_mr                            (integer)
#  scanning sequence                        (integer)
#  index in REC file (in images)            (integer)

# === IMAGE INFORMATION =====================
#  sl   ec   dyn   ph   ty       idx               
    1    1     1    1    0   2    0     
    ...
    1    1     1    1   18   5   38

Either way, I would still need the Echo 2 value for FUGE / SPM Fieldmap toolbox, so at this point, not sure what my options would be.

Thanks again!

Yes they are. But they are not relevant for the estimation of the fieldmap (in other words, you care about those parameters on the target (distorted) EPI images you want to correct - but you don’t care about these two particular parameters when processing your fieldmap information, i.e., your phase1/2 or phasediff files).

1 Like

@oesteban Thanks so much for this clarification!! It may have been obvious in hindsight, but it was extremely confusing. That’s why the EES values I was getting were so strange. I have now applied the formula, and basically got similar values to other posts regarding philips data. One less thing to worry about :slight_smile:

GENERAL UPDATE:

I came across this guide on OSF which basically leads me to believe my fieldmap images from the Philips PAR/REC file are actually a magnitude and an actual fieldmap. (other evidence for this is the PAR file image_type_mr indicating 18 = “b0”, rather than 3 = “phase”. the images look quite similar, and the file originally had B0_map in its name.

At this point I only seem to need to figure out whether I still need to convert it to radians, and then figure out what fmriprep requires in terms of BIDS and use case.

And as far as EES, I now understand that it requires values from the target bold image, which makes all the difference (in other words the PAR files I posted for the fieldmaps are irrelevant in terms of EES- the PAR file for the BOLD runs is what I am now using). So, all in all almost there!

@Carlos_Z the latest commit to the development branch of dcm2niix will append append _fieldmaphz to PAR/REC data where the image_type_mr is 18.

Perhaps we can do the same for Philips DICOM field maps, but I do not have access to Philips scanners. If someone wants to send me a Philips DICOM dataset with a pre-computed unwrapped field map, I would be happy to investigate.

1 Like

I don’t think this will get you very far. The time between echos (delta TE) will just scale the amount of distortion. After figuring this out, you’ll then hit the even more unclear determination of the effective echo spacing (or total readout time) of the EPI data you want to correct for distortions. And you will never know whether the source of problems is one or another.

One important thing is having very clear in your mind what times are relevant for which image:

  • phase1/2 or phasediff - you care about EchoTime1/2 or the “delta TE” but you don’t generally care for the effective echo spacing (except you are using a very fast EPI with obvious distortion on your fieldmap magnitude and phase, where you’ll need that information to unwarp the fieldmap first, invert the deformation and proceed with the other EPIs you want to correct - so typically no one does this).
  • EPI (dwi, bold) - here you only care about the total readout time or the effective echo spacing (which are to faces of the same coin).

So, for you to get going, the first step is to figure out the delta TE of your fieldmap. The fact that the second phase image has Echo_Time = 0.0 might indicate that the delta TE is exactly the Echo_Time of the first image. A delta TE of 3.2 ms makes sense (Siemens typically has 2.46ms).

Dear @oesteban, thank you so much for your reply!

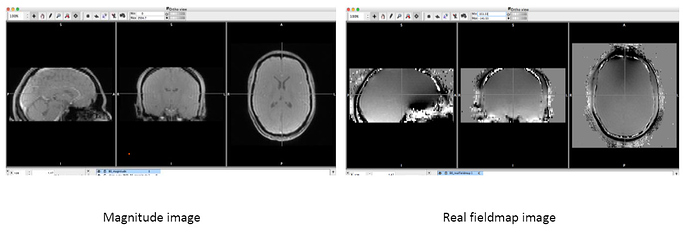
So, after much head scratching, searching, and and an assist from my mentor, I was just pointed to this excellent guide by researchers at Leiden who work with Philips scanners. The images they come up with for the PAR/REC B0 maps are a magnitude and a real fieldmap image, which closely resembles the images I have. If you add to this the fact that the original filename included a B0_map_ identifier, and that the label associated with the code in the PAR header is “B0” rather than the code for “phase”, and an echo time of “0”, I am now pretty sure I am working with those two files, rather than a phasediff. (See below - the only difference seems to be scaling)

My Images

Leiden Guide Images

The question then becomes, do I still need the second echo if I already have the calculated fieldmap? In their guide, they only convert it to radians, and use FEAT to perform distortion correction (though they do require the magnitude, its echotime, the fieldmap, and the EES for the BOLD images, as you mention). I’m still not sure whether dcm2niix converted/rescaled it in any way (their guide mentions the actual fieldmap should contain both negative and postive values, while mine only has values from 0 to ~280), or whether I still need to convert it to radians, but that seems a bit easier to figure out.

I intend to use fmriprep, so your input here is tremendously appreciated. According to the BIDS guide, there is a fieldmap use case exactly consisting of magnitude + actual fieldmap, where you only need to input the units it is measured in (rad/s, Hz, or T), although I understand you would still need the EES, which I now have all the values for. So should fmriprep be able to handle this use case no problem? Any special tips at this point? Does my updated scenario make sense?

Thanks again for taking the time to help!!

This doesn’t make much sense. Scanners typically obtain a “fieldmap” with two subsequent GRE (Gradient Recalled Echo) echoes separated by delta TE ms (please seconds in BIDS). If the scanner is using these, it can give you two phase maps (with corresponding magnitude maps or one averaged magnitude map) or a phase-difference map. Siemens typically gives you the latter (phasediff + averaged magnitude).

Then, some scanners may provide directly measured fieldmaps using Spiral Echo Imaging. Those can come in Hz or rad/s (if it comes in Tesla, it will be parts-per-million or numbers will be crazily small). If they come in Hz, they typically are bilateral and range between some hundreds.

However, the fact that your fieldmap ranges between 0~280 makes me think it is a phase map, but I could be wrong. Siemens gives you 0-4096, for instance.

Please check https://www.nipreps.org/sdcflows/dev_1.4.0/api/sdcflows.workflows.fit.fieldmap.html and https://www.nipreps.org/sdcflows/dev_1.4.0/api/sdcflows.utils.epimanip.html

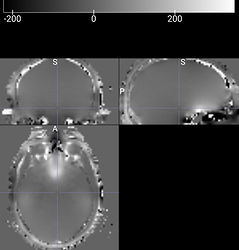
Ahhh, I’m so sorry, for some reason the viewer I was using was rescaling the values… switched to MRIcroGL, and sure enough, the range is between -500 and 499. I think that should solve the mystery for now, because now they look identical to the images I posted above and have the correct range for an actual fieldmap in Hz…

I agree it’s strange that philips would be spitting out a calculated fieldmap… but it does gel with everything I’ve read, including the non-siemens (ie philips) data section in the FSL FUGUE guide… https://fsl.fmrib.ox.ac.uk/fsl/fslwiki/FUGUE/Guide#Non-SIEMENS_data
and the Leiden philips fieldmap guide which they link to in that page.

Thanks so much for the linked sdcflows pages. Regarding calculating the EES on philips, I see that both formulas (FSL listserv, and Dr. Rorden’s) are mentioned. I have looked for the ImagingFrequency tag, but I absolutely cannot find it, neither in all of the philips metadata buried in the PAR which I have scoured, nor from the scanner report, so would it be possible to just use the slightly less precise formula (this data is from a philips Achieva 3T, so that should match):

image

which seems to be equivalent to the FSL listserv (except for the ETL being interchangable with EPI in this case)

"For Philips Acheiva, the best equation for echo spacing is
echo spacing =(1000*wfs)/(434.215 *(etl+1))

If so, then I have all the values I need.

Also, is the ReconMatrixPE value from philips reliable enough to calculate the TotalReadoutTime? I read that it was not possible to calculate ETL from the reconstructed matrix size in philips, but didn’t see anything about ReconMatrixPE not working for calculating TRT.

Let me know,

Again, many thanks. I feel like I’m very very close.

@Carlos_Z this is related to dcm2niix issue 455. Thank you for the PAR/REC sample. If anyone in the community has Philips DICOMs that also show pre-computed field maps, I would be grateful to see a set. I think Philips PAR/REC files are underspecified to compute FSL Fugue’s definition of dwell time, as we need to treat partial Fourier and SENSE differently. As I recall, if you provide a field map (which you have), the dwell-time only impacts the scaling for the calibration image generated by Fugue, and not the actual undistorted. Therefore, it does not impact subsequent analyses. So I think you can just put in your best guess (you can test this by computing the results for dramatically different dwell-times).

Sorry, all for the little mess moderating this and the linked topic about magnitudes.

To clarify after the latest response from @Chris_Rorden.

The question from @Carlos_Z is double-fold:

  1. How to encode these Philips fieldmaps with BIDS. So surprisingly enough (at least to me), the b0_map sequence Carlos is using a GRE sequence (Philips’ FFE - Fast Field Echo), but the output comes phase-unwrapped (i.e., it is not clipped between 0…2pi) and it seems to be in Hertz judging by the intensity range that Carlos is reporting. Therefore, there’s nothing else to see because the fieldmap is already computed (and the delta TE to normalize the phase derivative is already applied in the output). This should be encoded as _fieldmap + _magnitude files with BIDS and the only required metadata is Units, which Carlos needs to confirm.

  2. The rest of the discussion pertains to EPI correction of distortions (unless I’m wrong, please let me know). In that second part of the problem (we know already the B0 inhomogeneity from 1, and now it is a matter of effectively scaling the distortion by the adequate total readout time). The problem here is that finding the total readout time (as defined in the original formulations of Jezzard et al. 1995 and Hutton et al. 2000 and subsequently for FSL and BIDS) is definitely not trivial for Philips sequences. In this second part of the problem, I’d suggest @Carlos_Z to use @Chris_Rorden’s advice - whatever it is :D.

@oesteban

  1. while it might be surprising, Matthew Clemence (a Philips Senior Clinical Scientist) notes:

The default B0 mapping protocols for fMRI produce a greyscale field map calibrated in Hz. This map is derived from the phase maps from a dual echo sequence with unwrapping and processing done for you.

  1. Current Philips PAR/REC and DICOM images lack some sequence details required by our field. I document missing information here. My advice would be for Philips scientists to lobby their Philips Research Collaboration managers to provide more meta information in future software releases. Recent collaborations with GE and Siemens (XA data) engineers demonstrate the potential for this approach. In the meantime, if dcm2niix does not supply a value, it is because I am not confident I can extract the information. However, in this case I think precise values only impact calibrated maps and not subsequent data.

Hi - it should not be too surprising as it is an option you have asked for in the protocol. Under the option “Calculated Images” on the post processing page b0 is selected and is mandatory for the in built b0 mapping sequence.

image

You can however build a convention two echo sequence with phase as the output images which some users may have historically used.

For the b0 map - If you are using PAR-REC or DICOM you will need to apply the re-scale values from the respective headers to the internal data to get the correct values in Hz.

Matthew

1 Like

That’s great! I’m sure it’ll be quite helpful to other Philips users with PAR/REC fieldmaps. Many thanks.

@oesteban - yes, that’s a perfect summary of my two related questions, which I think are largely resolved now. Thanks for clarifying the BIDS usage for this combination. (and sorry for my part in generating a bit of this mess with the two posts!)

Regarding Q2, and finding the total readout time, at this point based on all my reading, it seems like since my dataset does NOT use partial fourier or halfscan, and as per @drmclem in https://github.com/rordenlab/dcm2niix/issues/377#issuecomment-598665157, EPI_factor displayed in Philips already takes into account the SENSE acceleration, then the formula for

EES = (1000*wfs)/(434.215 *(epi_factor+1))

and

Total Readout Time = EES * (ReconMatrixPE - 1)

should theoretically give me all I need (please correct me if wrong).

@drmclem Thanks for clarifying regarding the protocol settings. Unfortunately I wasn’t involved with the collection of this data, so that’s why I’m sort of having to work backwards to figure out settings used, and what specific data I have. And thanks for mentioning the rescaling necessary to get the image in Hz!

Thank you all so much for taking the time to look into this!! I’m sure it will be of help to other phliips users who may still use or have archival PAR/REC fieldmap data.

Best,
Carlos

I have a Philips fieldmap for you :wink:
Please let me know, if you need other kind of data or formats.

1 Like