I am conducting a series of physio-physiological interactions (PPIs) using resting state functional MRI (rsfMRI) data from the Human Connectome Project for Early Psychosis (HCP-EP). The data was collected in two sessions, with two acquisitions per session - one in the anterior-to-posterior (AP) phase-encoding (PE) direction, and one in the posterior-to-anterior ¶ PE direction.
The data has been converted to BIDS and preprocessed using fMRIprep.
Consistent with the approach for a typical first-level PPI analysis, I ran my models on each subject’s individual runs independently and averaged my interaction term betas across runs to get my per-subject PPI measures.
As I was checking the ROI overlays for my subjects’ BOLD data (which has been registered to MNI152NLin2009cAsym space) I noticed that the signal in the orbitofrontal cortex (OFC) on the PA-acquired image is much worse that that on the AP acquired images. Here is an example of what I mean:
This is concerning to me, because I am interested in the medial OFC (mOFC) as one of my ROIs. I am also interested in areas of the hindbrain as part of my analyses.
A qualitative inspection of the time-series information shows that the intensity values for the mOFC during PA scans is consistently lower than it is on the AP scans. Other ROIs I am interested are not effected in as consistent a manner insofar as they do not seem consistently higher or lower during one PE scan versus the other.
Furthermore, an inspection of the interaction betas across runs does not reveal a reliable difference between AP versus PA scans, though I have to testing this statistically yet.
My questions are as follows:
Is it still reasonable to average my interaction terms across runs given the difference in PE directions for the different runs? Note that I have other purely subcortical PPIs whose regions do not seem to suffer from the same signal disparities between PE acquisitions. I am wondering if the approach I’ve taken for those PPIs may still be valid? Is it “invalid” for the mOFC PPIs?
Is it reasonable to look at the mOFC at all, given how poor the signal is in the PA scans? Should I simply avoid it?
Would it be better if I took a hierarchical linear modeling approach to my analysis, where instead of collapsing across runs, I add the session number and PE direction as regressors in the model to account for session- and sequence-specific variance?
In our BIDS input directory, we included field-maps for all scans. That is, our input included data from anat, fmap, and func folders. While there is not an argument for SDC here, I am wondering if it ran through fmap discovery? Here is how our field-maps are named:
Based on your fmriprep expertise, do you know if it would have been run or not? I apologize for my ignorance on this matter; I was not the one to actually run the command.
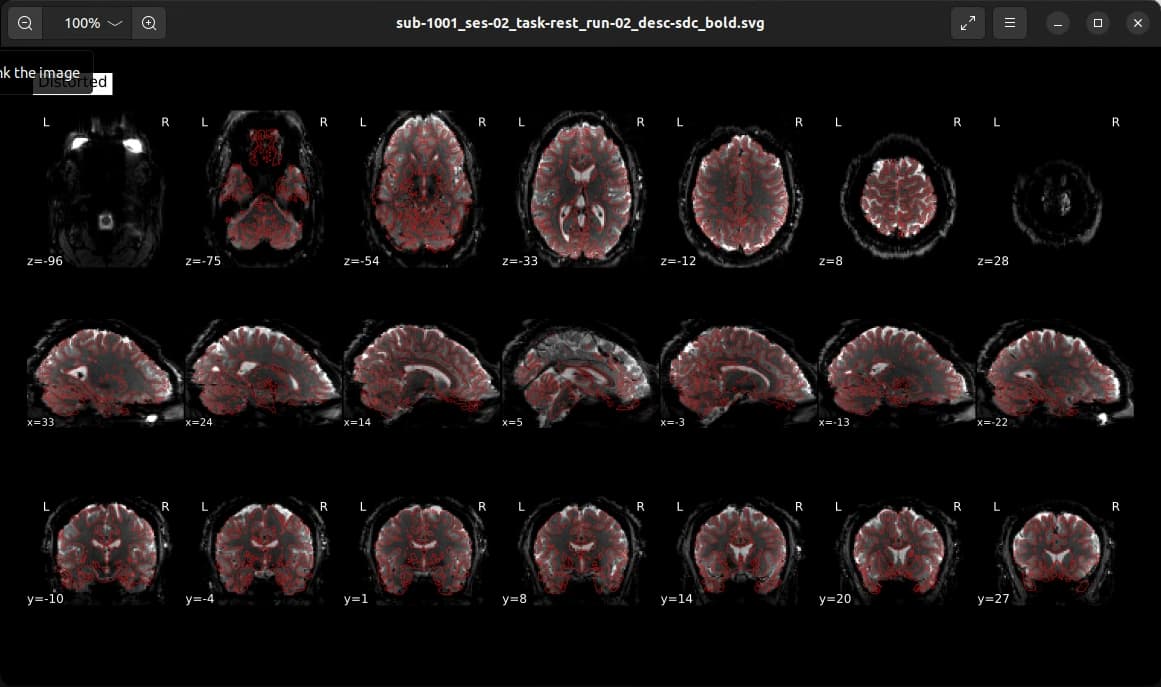
My data definitely adheres to the red contours rather than those of the original data.
Further, this note in the HTML in reference to the above image further makes me believe that the SDC has been applied:
Susceptibility distortion correction
Results of performing susceptibility distortion correction (SDC) on the BOLD reference image. The "distorted" image is the image that would be used to align to the anatomical reference if SDC were not applied. The "corrected" image is the image that was used.
Thank you so much for your guidance and patience with me through this. Interested in hearing your thoughts.
I hope you had a lovely weekend! I was wondering if you may have had the change to give my last update some consideration. I’m interested in hearing your thoughts!