Hi everyone,
How do you correctly setup a 2nd-level (group-level) model, if you have only one group?
The question is simple, but to be honest, I have some doubts in my own approach. Especially, because FSL and SPM seem to handle this differently.
So, let’s setup the scenario:
-
I have one group of 12 subjects
-
Each subject did 4 sessions (sessions are the same, i.e all sessions contain all conditions)
-
The subjects were exposed to stimuli of 6 different conditions:
cond01: audio-visual stimuli of category 1
cond02: audio-visual stimuli of category 2
cond03: visual stimuli of category 3
cond04: repetition of visual stimuli of category 1
cond05: repetition of visual stimuli of category 2
cond06: repetition of visual stimuli of category 3
-> Therefore I have a 2x3 design (repetition x category)
As much as I can see, there seem to be 3 approaches that are used in our community to do the statistics on the group level:
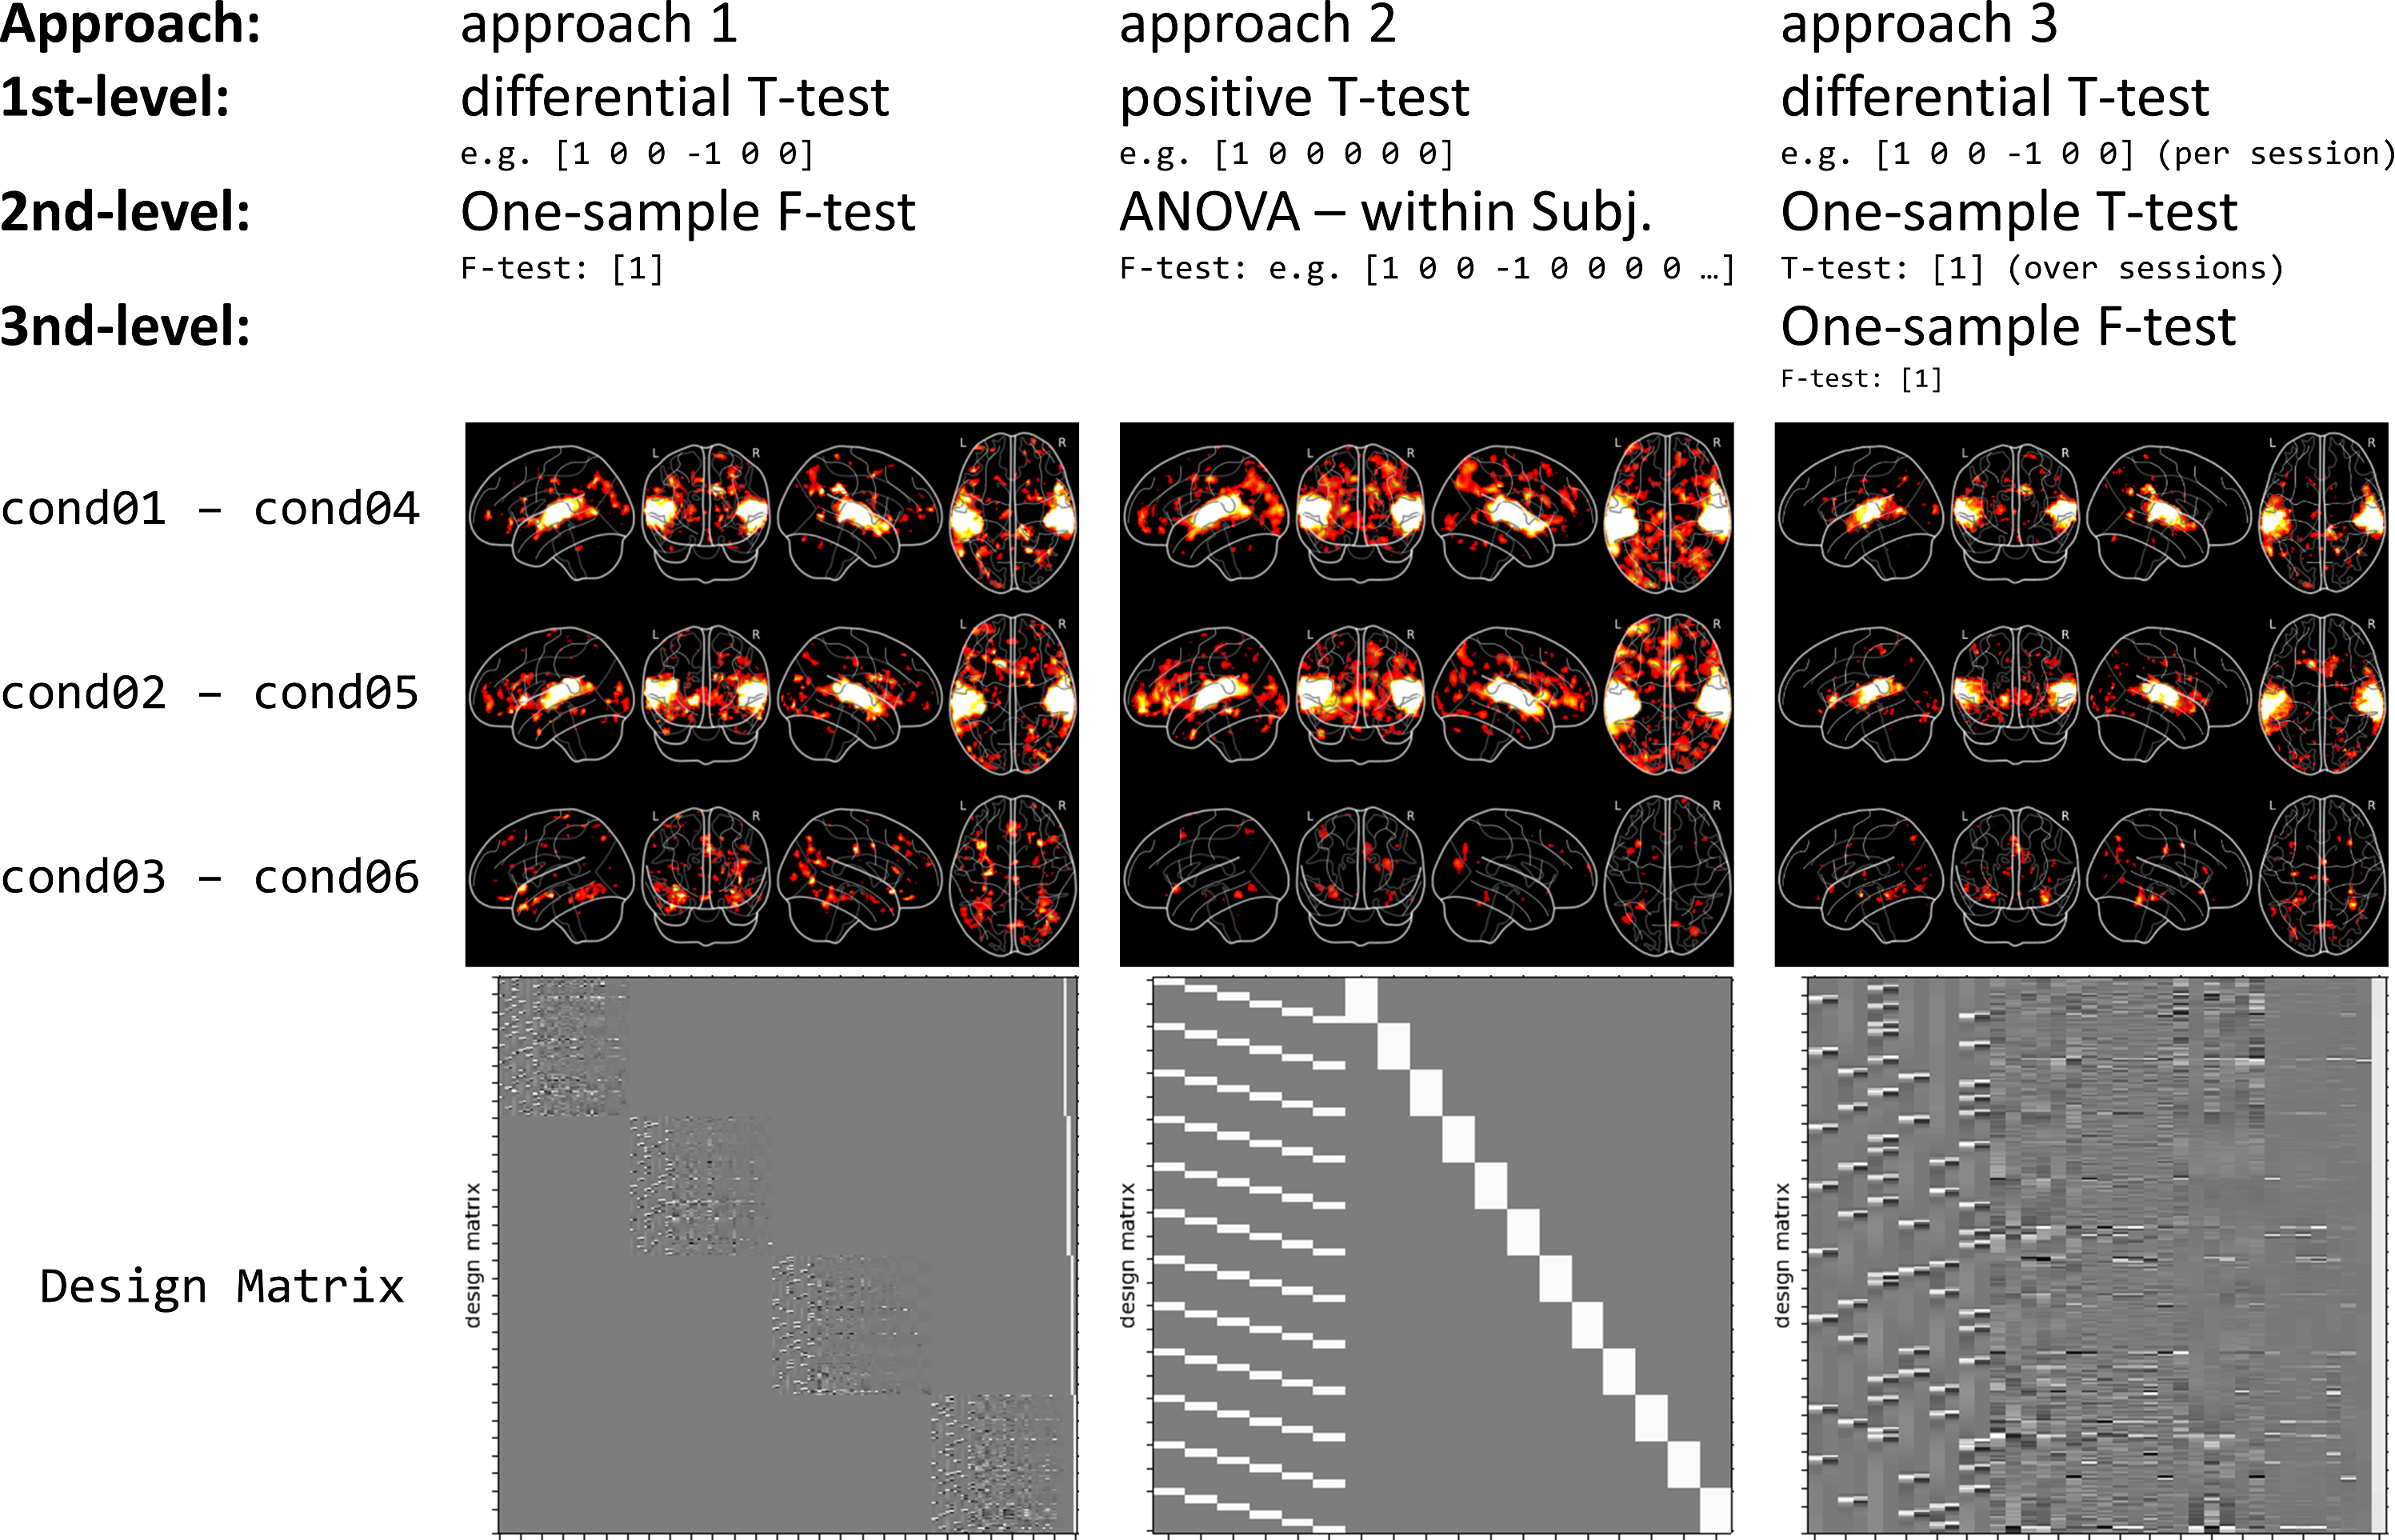
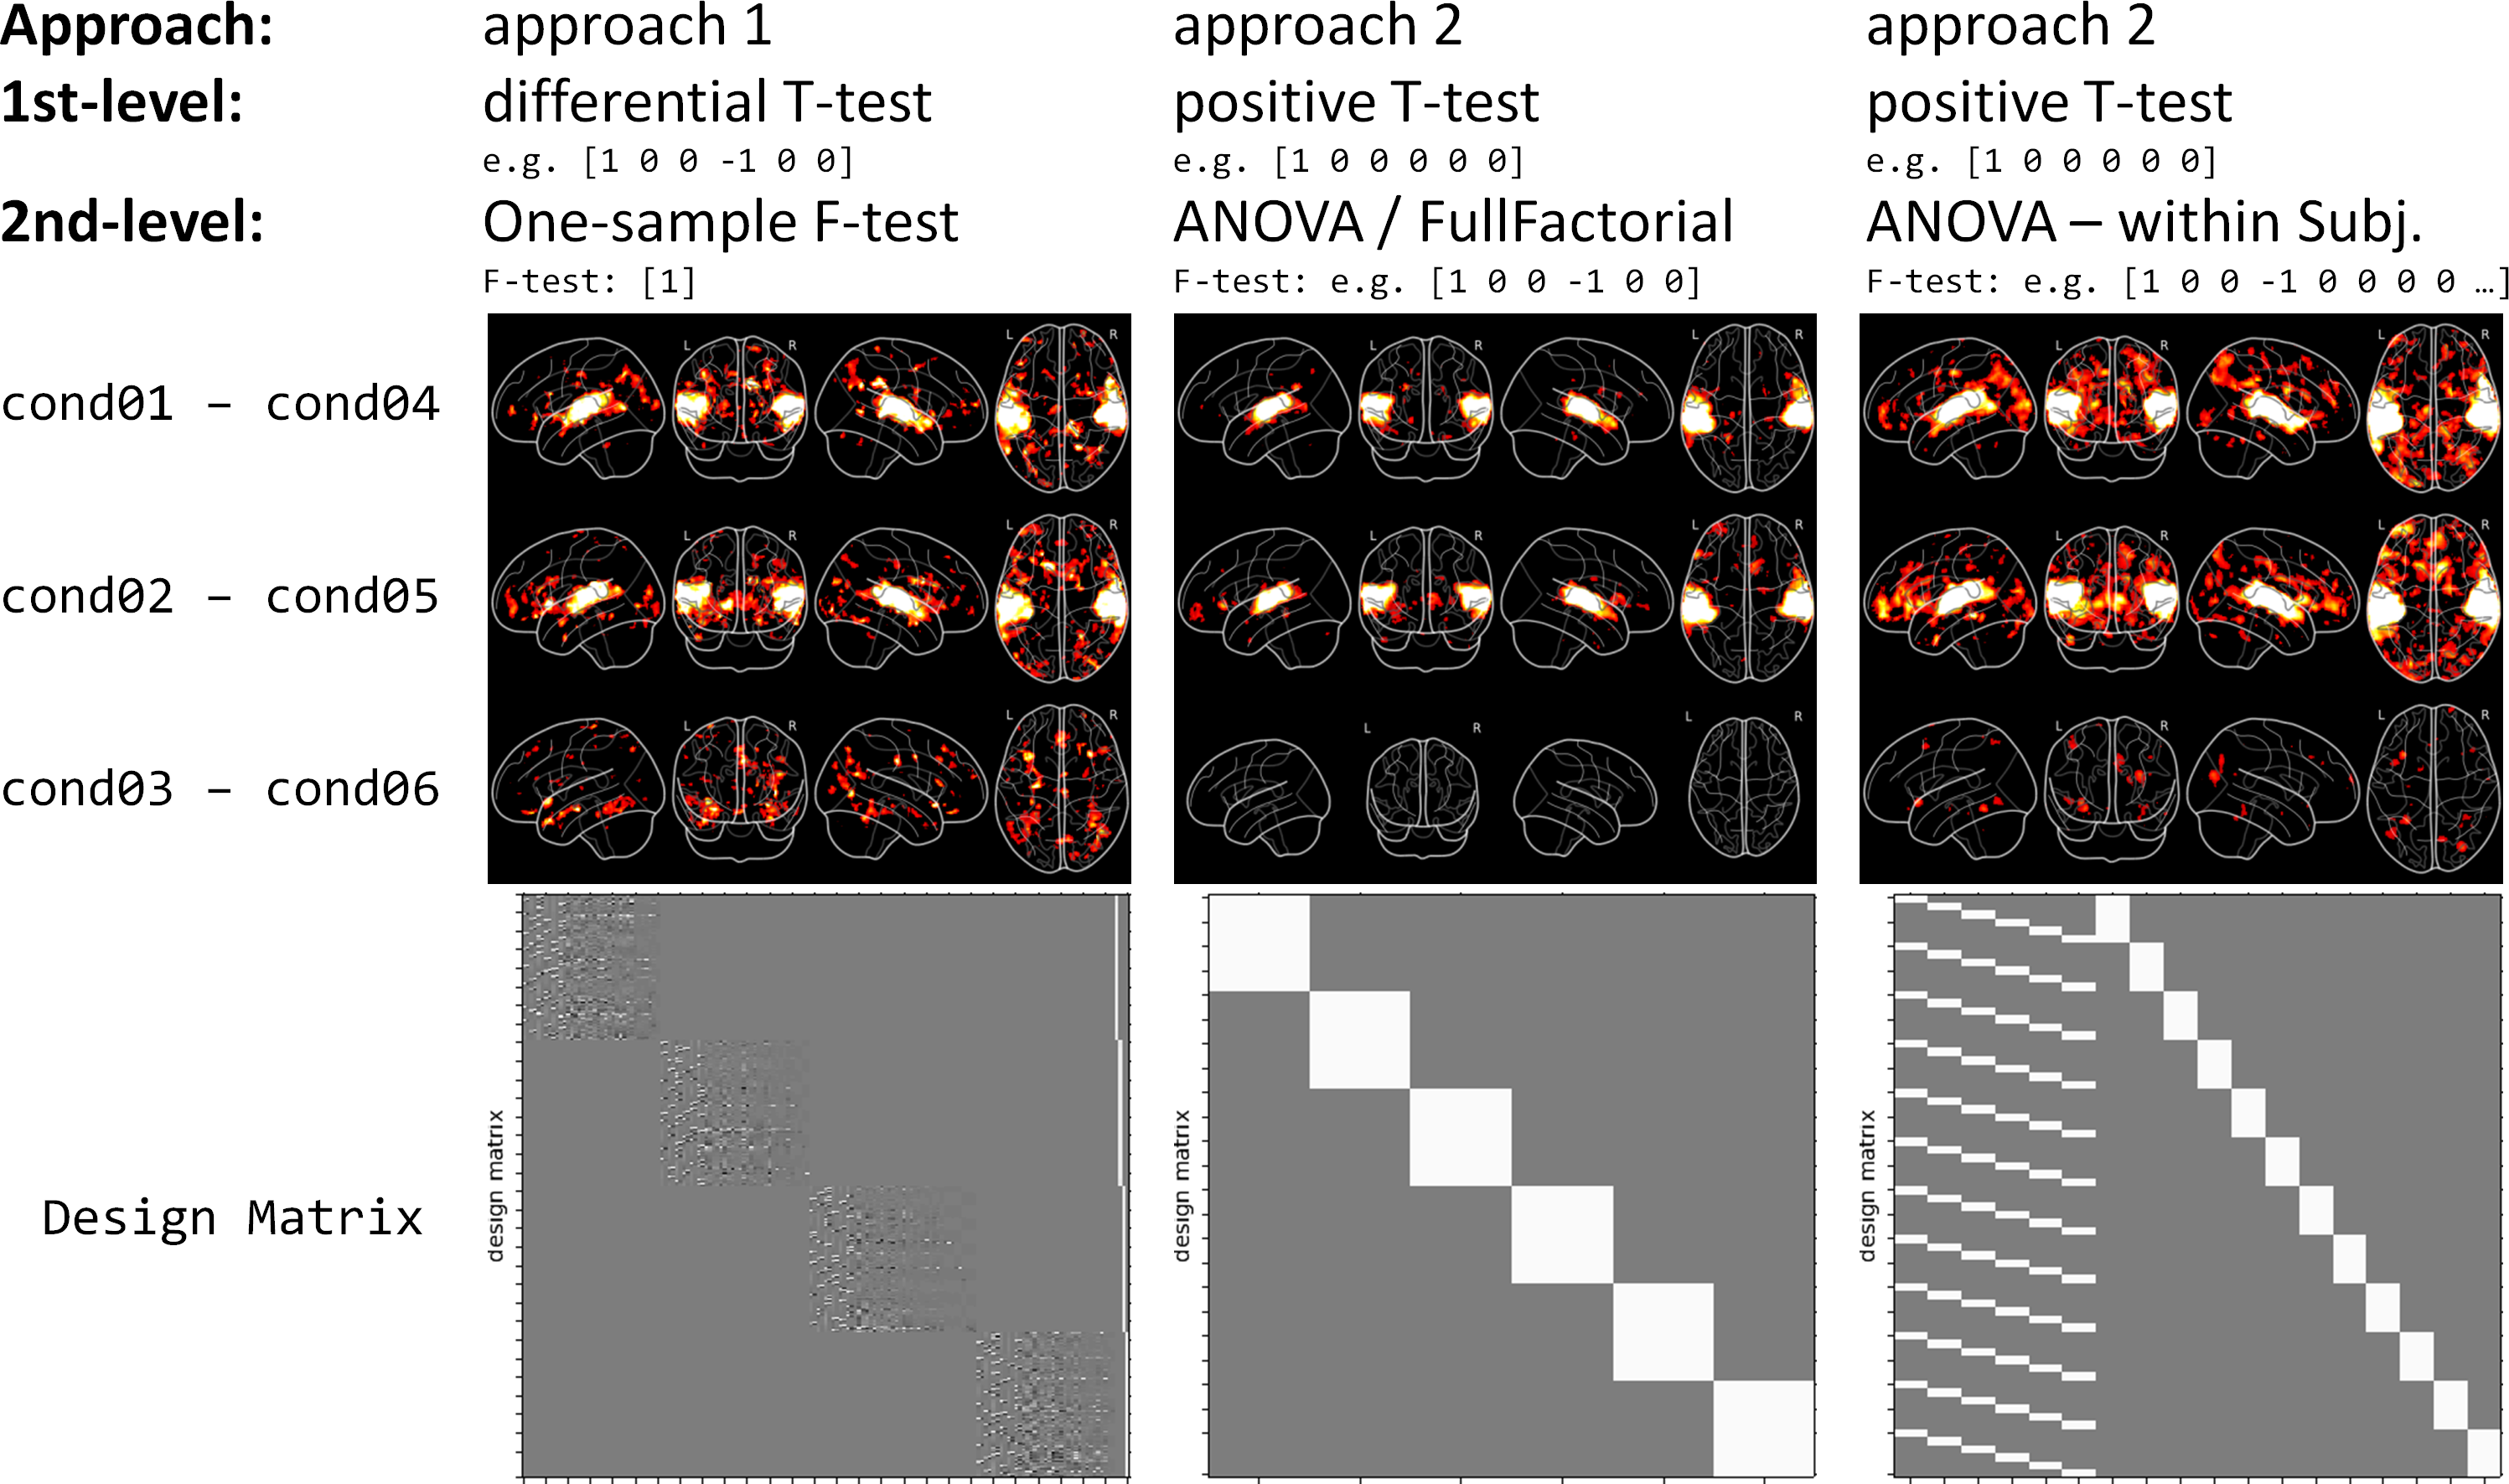
Approach 1: First, use all sessions for the 1st-level analysis and specify all contrasts of interests on this level. Second, perform a simple T or F-Test (group mean) on the 2nd-level.
Example: If I want to know which regions decrease in activation for the repetition of stimuli of category 1, I use a 1st-level differential T-contrast [1 0 0 -1 0 0] and a 2nd-level T-contrast [1].
Supported by: https://en.wikibooks.org/wiki/SPM/Group_Analysis, see line: “If this were a 2-by-2 design where both factors were within subject you would create four contrast images per subject: c1=[1 1 1 1], c2=[1 1 -1 -1], c3=[1 -1 1 -1], c4=[1 -1 -1 1] (overall effect, main effect 1, main effect 2, interaction). You would then create four second level designs, each being a one sample t-test…”
Approach 2: First, use all sessions for the 1st-level analysis and specify only “simple” positive contrasts on this level. Second, perform more “complex” differential contrasts (e.g. ANOVA, differential T-tests) on the 2nd-level.
Example: For the same question as above (effect of repetition of category 1), I would specify a T-contrast for cond01 [1 0 0 0 0 0] and one for cond03 [0 0 0 1 0 0] and than specify a 2nd-level contrast [1 -1].
Approach 3: First, conduct a 1st-level analysis for each session individually, with positive and/or differential contrasts on this level. Second, perform a 2nd-level analysis for each subject that computes the “global mean” of each contrast over all sessions. Third, perform a group analysis (3rd-level) analysis by computing the group mean with [1].
Example: This approach is mostly used by FSL (I think), as can be taken from this guide: https://fsl.fmrib.ox.ac.uk/fsl/fslwiki/GLM#Multi-Session_.26_Multi-Subject_.28Repeated_Measures_-_Three_Level_Analysis.29
So this is my first problem: When should I chose which approach? Does this depend on the dependency between factors and on equal or unequal variance between them?
My second problem is about which group model to use. SPM gives me, amongst others, the option to perform a “One-way ANOVA”, a “One-way ANOVA – within subjects” or a “Full Factorial” design. And I’m not really sure which one to chose.
If I understand it correctly, than “One-way ANOVA - within subject” adds additional subject regressors, while “One-way ANOVA” and “Full Factorial” design seem to lead to the same Design Matrix. And all of them let me define if the factors are independent and if their variance are equal or unequal. Additionally, FSL seems to struggle with multiple contrasts on the group analysis (“https://www.youtube.com/watch?v=Ouc-3GOZWAo&t=9m10s”). Does this mean I shouldn’t use FSL for such a paradigm?
To better illustrate my problem, I’ve run a group analysis once with approach 1 and once with approach 2 (with “ANOVA” and “ANOVA – within subject” on the 2nd-level). The attached figure shows the different results (all group level contrasts were thresholded at voxel-level p < 0.005, no correction for multiple comparisons was applied).
And my third problem: I’m curious how others perform fMRI group analysis using Nipype. I only know how to create a pipeline for approach 1. What kind of pipeline do you use for your approach? Did somebody setup an FSL statistics pipeline that doesn’t need the FEAT output folders or the design.fsf file? i.e. is it possible to do statistics with FSL by just specifying a design matrix and using already preprocessed data? My guess is on the film_gls function.
I apologize for the wall of text. Any (even partial) answers, references to good reading materials or code snippets are highly appreciated.
Thanks,
Michael
 I’m going to use V1T1, V1T2, V2T1, V2T2, V3T1, V3T2 to describe your 3 conditions. Your F-test of interest is