we want to run a functional connectivity analysis on the HCP task data. We were about to use the nilearn python library (https://nilearn.github.io/) to calculate functional connectivity. It appears though, that it works on several, but not on the HCP Glasser atlas (360 parcellation). Could somebody suggest a way to do it (if possible) or alternatively propose a library which works on HCP’s Glasser parcellation?
You can try to do it manually (in a for loop or with NumPy vectorization) for each pair of the parcels, which are time-series, in fact. Functional connectivity may be based on correlations/autocorrelations/ mutual information or some other technique to find the connectivity. You can try to find those in scipy.stats or statsmodels or scikit-learn
bump,
we have the same issue. The HCP per-processed used Glasser360 while is it not an available atlas on nilearn and any other python library. I appreciate if someone can help us to either convert Glasser360 to other atlas or find a library to get coordinates for Glasser360 map and visualize it.
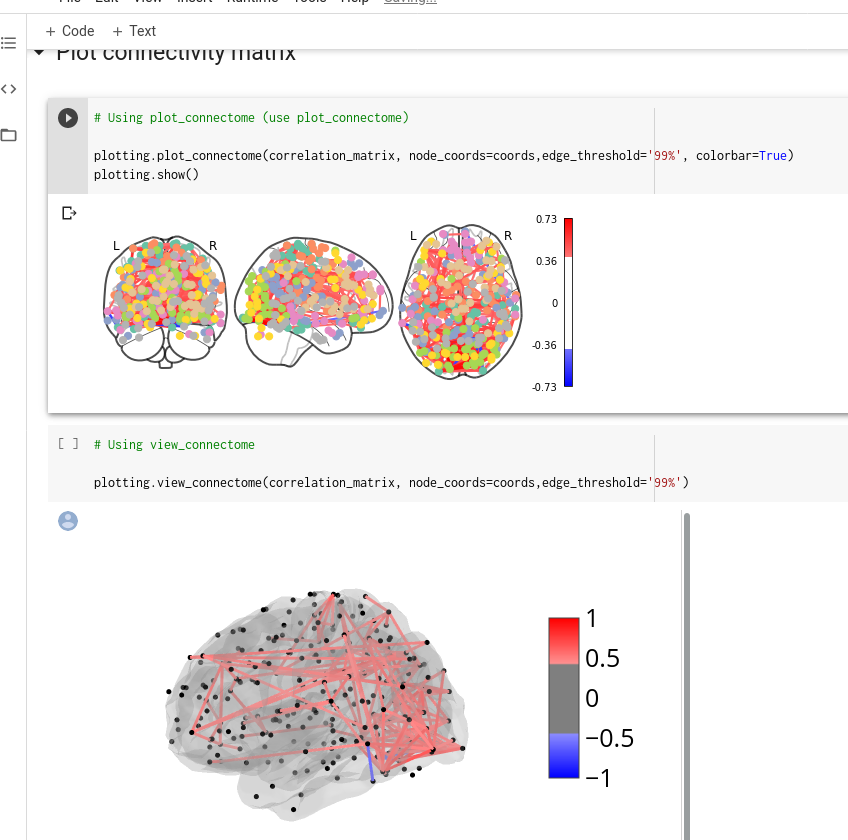
We already checked the functional connectivity and just wanted to visualize the brain networks.
So I was wondering if there is a Python library to do so using the Glasser (2016) atlas with 360 parcells. Please see the attached image:
Can you provide more info/code about how you created these images? Trying to visualize what the order/indices of the 360 parcels refer to location-wise. Thanks!
The Glasser atlas is a surface-based parcellation, and reprsenting the parcels with a single point in MNI space does not exactly make sense. But it’s possible to calculate the average coordinate of the surface vertices within each region and make a volumetric visualization that way.
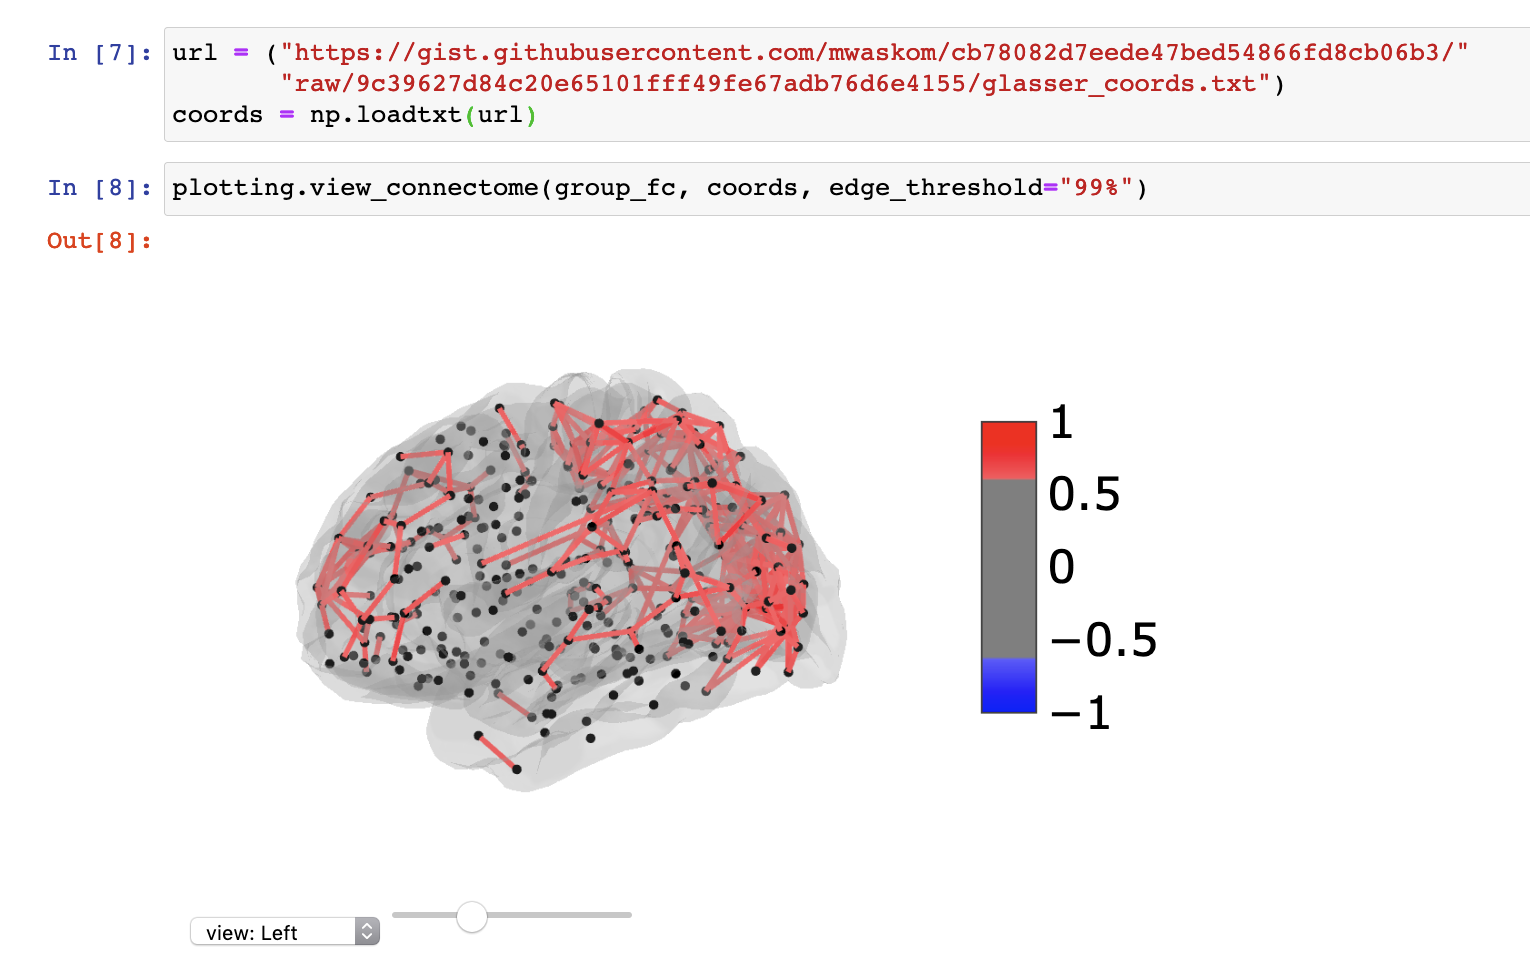
I’ve put up a provisional set of coordinates for the Glasser parcels here.
These seem useable, building on the group_fc example in the data loader notebook:
That said, given that this is a course project where learning is more important than results, I’d encourage you not to rely too much on toolboxes for the analyses. (The plotting, sure, but the statistics, maybe not).
In the possible projects slides, it’s mentioned on HCP that we can use dimensionality reduction to generate some patterns in the FC correlations in resting state which we can then regress. Does anyone know the idea from using dimensionality reduction while just comparing timeseries correlations for resting state and task?