How to best plot voxel-based data from Python on a brain surface?

Hi,

over the past twelve months I worked myself into data analysis with fMRI. I primarily used two softwares: AFNI for preprocessing and Python for further data analyses, such as for different measurements. This means that I loaded preprocessed time-series from AFNI into Python, and then did everything else in Python.

Usually, I plotted my results using matplotlib in Python, and there was no need to plot results on brain surfaces so far.

However, I would now also like to plot results from data processing, such as voxel-based levels from any measurement, on 3D brain surfaces.

There seem to be so many programs for this task, and I was wondering if you could give me advice what program would be best or good to start with?
My goal is as follows: I would have to plot voxel-based data that is processed in Python on the brain’s surface, such as on the MNI 152 template or freesurfer’s template.

I am running Mac OS.
Thanks for any advice.

Hi Philipp,

How about nilearn’s plotting module? I think it might be a good choice for your purposes.

Good luck!

1 Like

Hi Zvi,

thank you. I figured it out with nilearn, and it worked!
I would come back later in case I come across any problems that I cannot solve on my own.

Best,
Philipp

Now I got a question. I am trying to plot a non-symmetrical colorbar with nilearn, meaning that the values I try to plot start with a specific positive value.

I would like to display the range from 2.16 to 8.64 on the colorbar, where I use the colormap “hsv_r” (hsv reserved) by matplotlib.

Here is my code including an image showing the result:

# Data
nifti = nilearn.image.load_img(f"path-to-data....nii")

# Plot
fig, axes = plotting.plot_img_on_surf(nifti, surf_mesh="fsaverage",
                                      views=["lateral", "medial"],
                                      hemispheres=["left", "right"],
                                      inflate=False,
                                      colorbar=True,
                                      bg_on_data=True,
                                      cmap="hsr_r")

fig.axes[-1].set_xlim((2.16, 8.64))
fig.show()

The problem is that plotting.plot_img_on_surf takes the colormap, but it does not include the blue range of the colormap (see here https://matplotlib.org/stable/_images/sphx_glr_colormap_reference_005_2_0x.png).
Instead, plotting.plot_img_on_surf seems to still presuppose a symmetrical colormap, where it not only starts plotting values that start with 2.16 (which is correct and what I want), but it also seems to cut-off the colormap itself below 2.16 (which is what I would like to avoid).

Is there a way to display a specific value range, such as from 2.16 to 8.64 on the brain surface, while using a non-symmetrical colormap that is not centered at 0, but where plotting.plot_img_on_surf starts plotting the colorrange from the left or right beginning of the colormap?

Here is a solution how to plot a non-symmetrical colormap or colorbar in nilearn, even though that is normally not supported by nilearn.

I have seen this question in a couple of topics: people asked how one can plot a colormap or colorbar with only positive (or only negative) values, without nilearn automatically re-arranging the zero- or centerpoint of the colorbar.

You can “trick” nilearn by using a combination of the same colormap, where you combine the colormap two times into one new colormap as follows. But see the script below.

import nilearn
import numpy as np
import cmasher as cmr
from nilearn import surface
from nilearn import plotting
from nilearn import datasets

# Initialization
color = "hsv_r"
range_cmap = cmr.get_sub_cmap(color, 0.3, 1)

# Custom colormap
from matplotlib import cm
from matplotlib.colors import ListedColormap, LinearSegmentedColormap
upper = cm.get_cmap(range_cmap, 999)
lower = cm.get_cmap(range_cmap, 999)

combine = np.vstack((upper(np.linspace(0, 1, 999)),
                       lower(np.linspace(0, 1, 999))))
custom_cmap = ListedColormap(combine, name="custom_map")

# Data
nifti = nilearn.image.load_img("load-your-nifti-file")

# Cortical mesh
fsaverage = datasets.fetch_surf_fsaverage(mesh="fsaverage")

# Sample the 3D data around each node of the mesh
texture = surface.vol_to_surf(nifti, fsaverage.pial_right)

# Plot
fig = plotting.plot_surf_stat_map(
    surf_mesh=fsaverage.pial_right,
    stat_map=texture,
    bg_map=fsaverage.sulc_right,
    bg_on_data=True,
    alpha=1,
    vmax=8.64,
    threshold=False,
    hemi='right',
    title='Surface right hemisphere',
    colorbar=True,
    symmetric_cbar=False,
    cmap=custom_cmap,
)
fig.show()

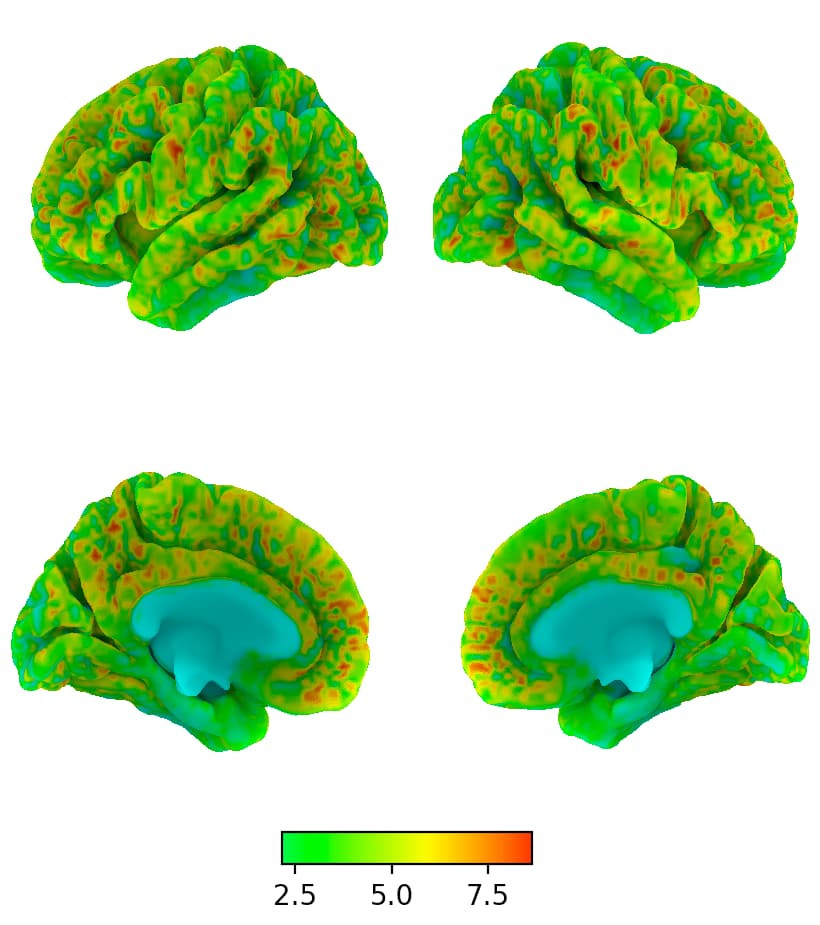
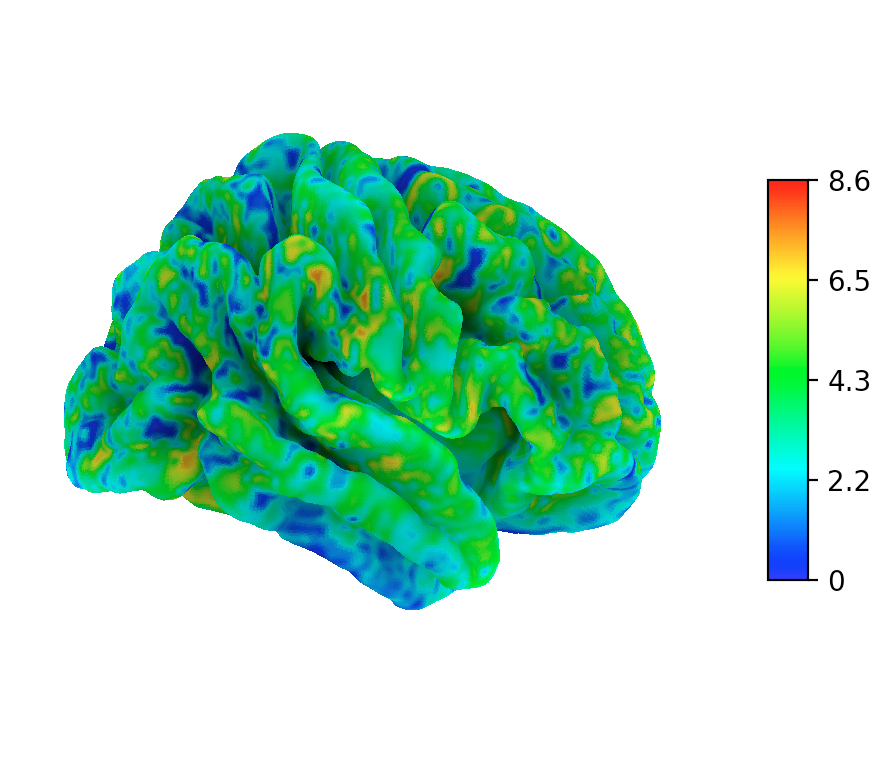
The result is that nilearn now uses the complete colormap that you specified above, instead of “re-centering” it. Of course, nilearn still trys to re-center the colormap, but since your chosen colormap is mirrored around the centerpoint, the code still catches the complete map, now displaying the full range even though all values are positive (or negative).

Even the plotted colorbar only shows the intended range, while in fact, the “real” colorbar consists of a combination that uses two times the same colormap.