hello,
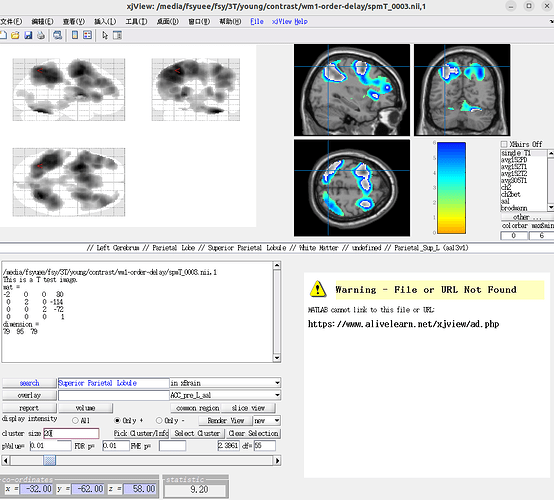
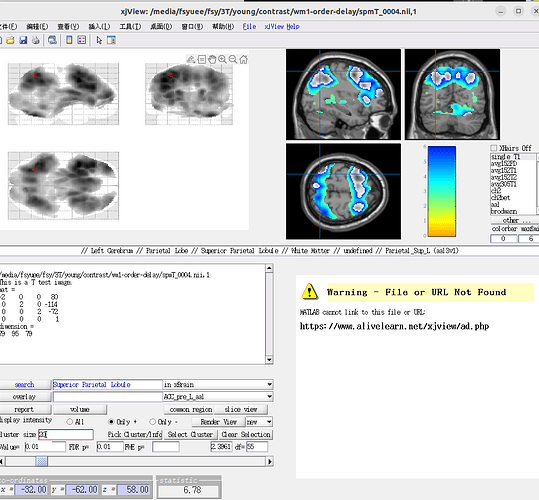
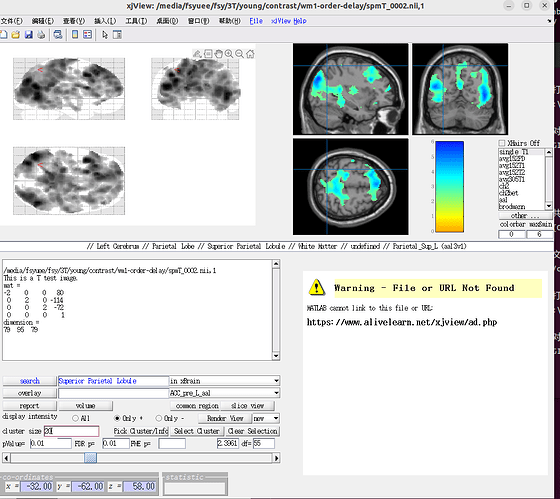
I have two groups. All of the graphs below have thresholds of p<0.01 and cluster size =20.color bar is 0-6.
This is the T-test for the first group of 30 people.
Next comes the second group. This is a T-test for 27 people.
However, I used the first < second group (SPM design matrix is [-1 1]) and did the two-sample T test with SPM, and the activation region obtained was not observed in the second group. Do you know what’s going on?
Looking forward to your reply, thank you very much!


