Dear Community,
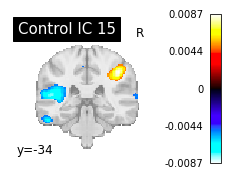
How would you interpret the negative values (blue-ish) of components that were produced by an ICA or canICA?
What does the explained variance in specific has to do with positive and negative values within the very same component?
Thank you for considering. Much appreciated!