Issues with plotting output of Nilearn's second level model & mask_img argument

Hi all,

I am running into 1) a problem when using Nilearn’s SecondLevelModel to statistically test different contrasts specified by my design matrix. When I plot the statistical maps I, most of their significant z-scores are located outside the brain/mask picture of the Nilearn plotting functions. And 2) I am confused on what the mask_img argument in SecondLevelModel does exactly, and whether I should be using this. I will explain both topics in a bit more depth below.

**1. Plotting contrasts **
As input to my second level model, I have for each participant the z-transformed correlation coefficients of the amygdala with all other voxels in the brain (executed in a similar fashion as Producing single subject maps of seed-to-voxel correlation - Nilearn).

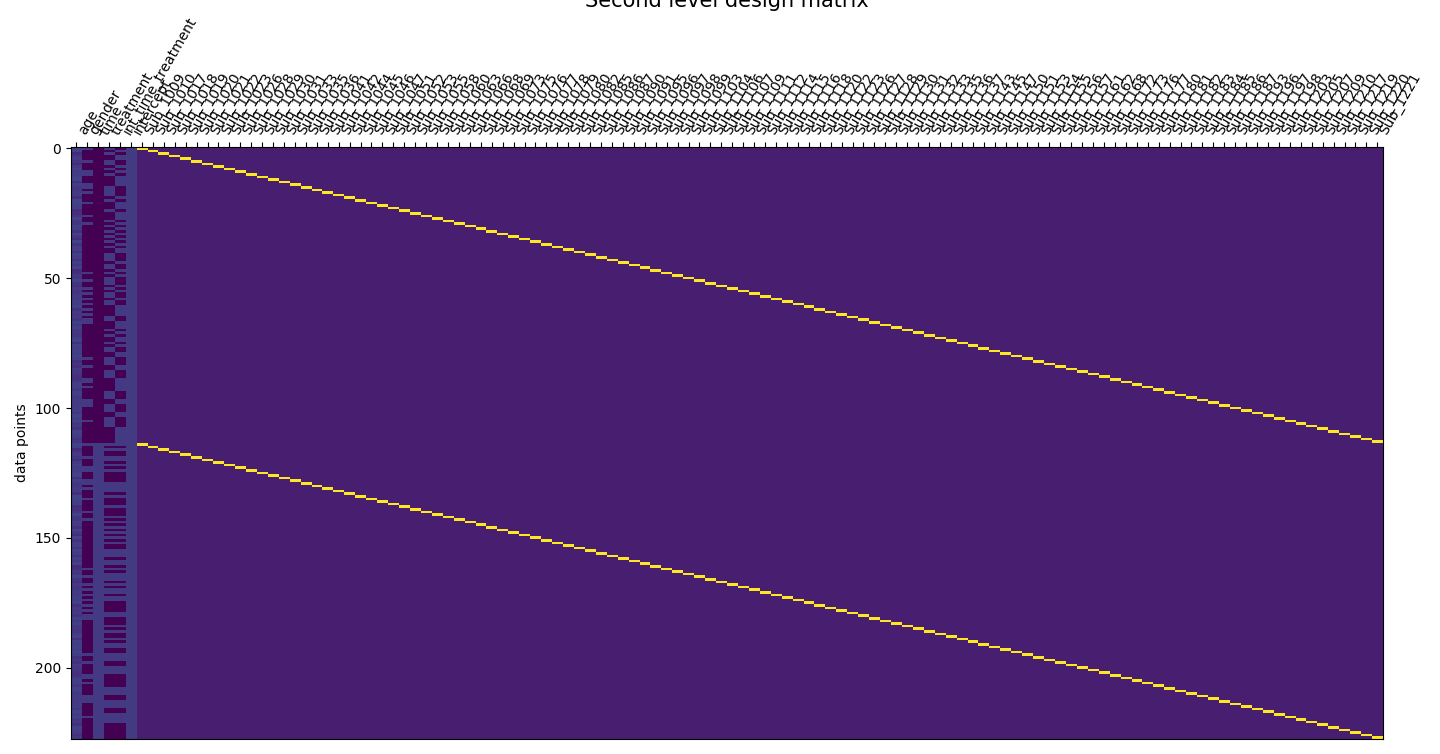
The design matrix in my second level model consists of the following columns: age & gender (covariates), time (baseline and follow-up), treatment (2 levels), intercept, and individual intercepts to account for repeated measures. I include a picture of my design matrix below.

When I am interested in the effect of age on functional connectivity let’s say, I will run the following: left_stat_map_age = left_model.compute_contrast(‘age’, output_type=‘z_score’)
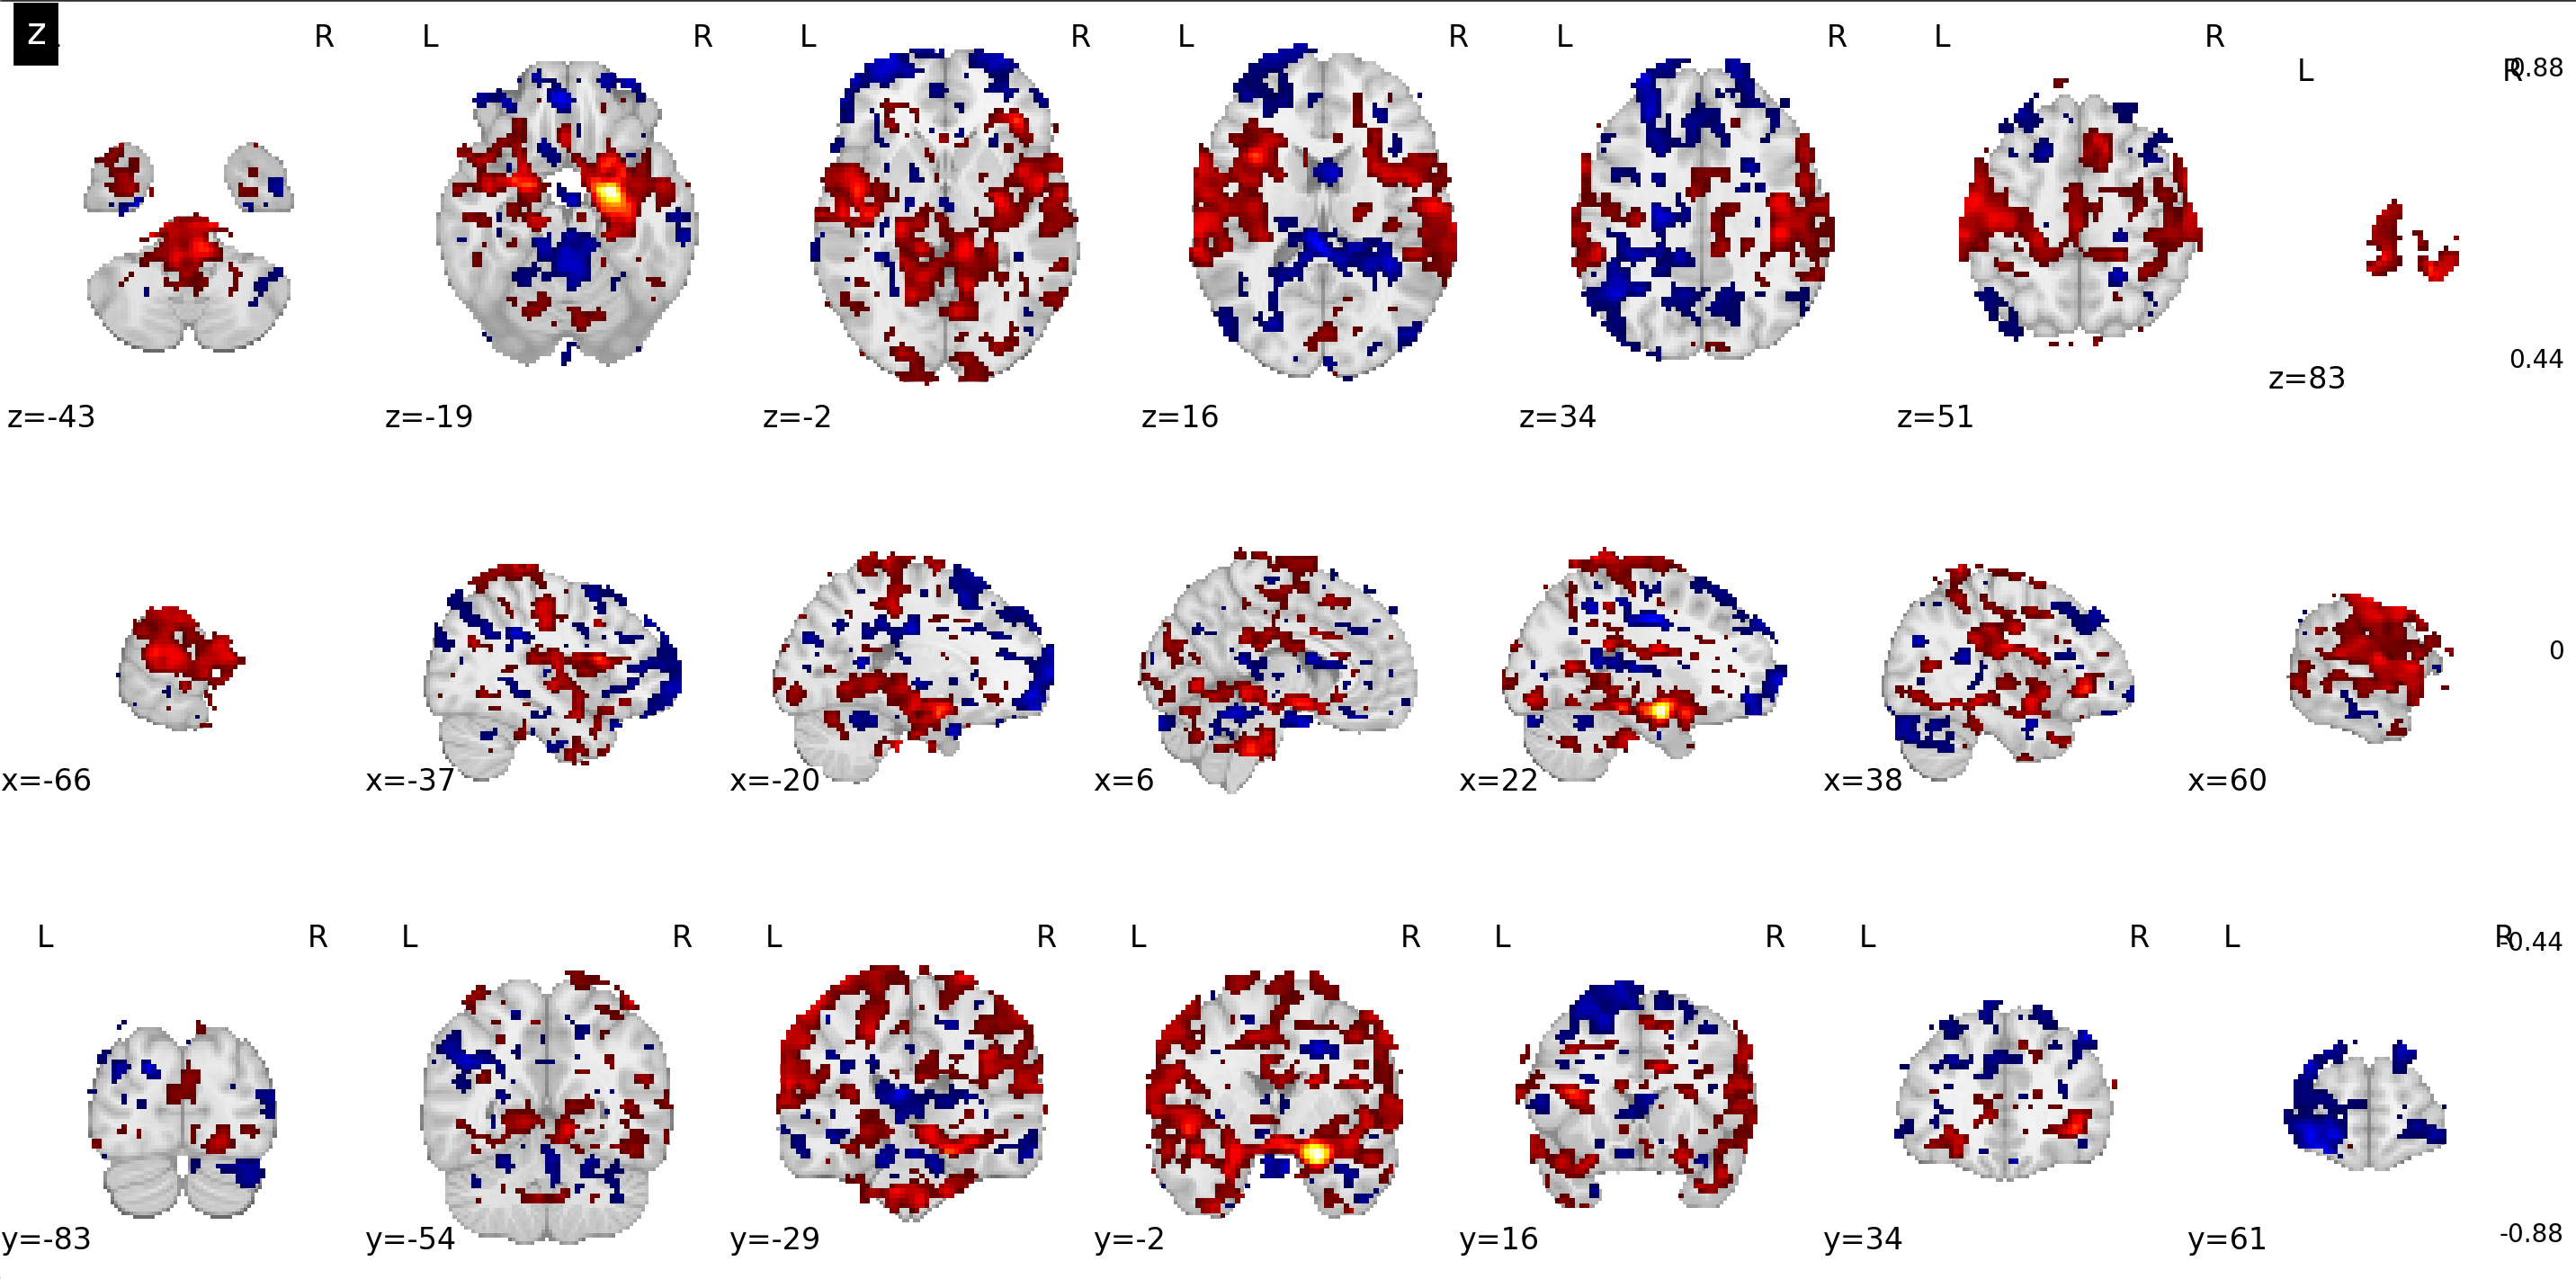
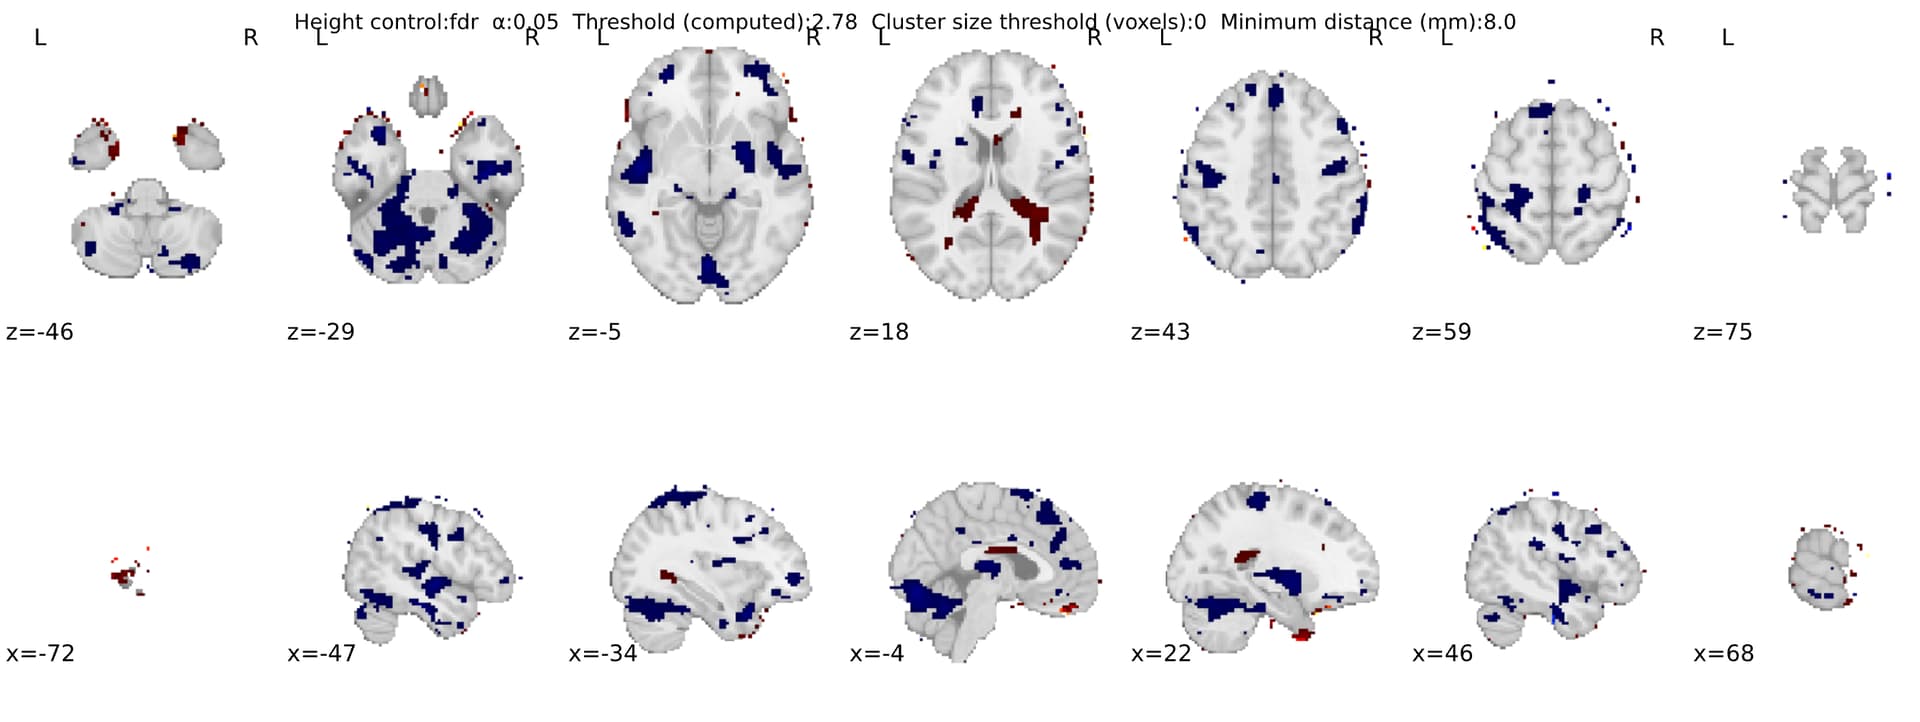
This will show the effect of age, keeping the effect of all other variables in my model constant. Now, the problem arises when I plot this contrast with a plotting function of Nilearn:

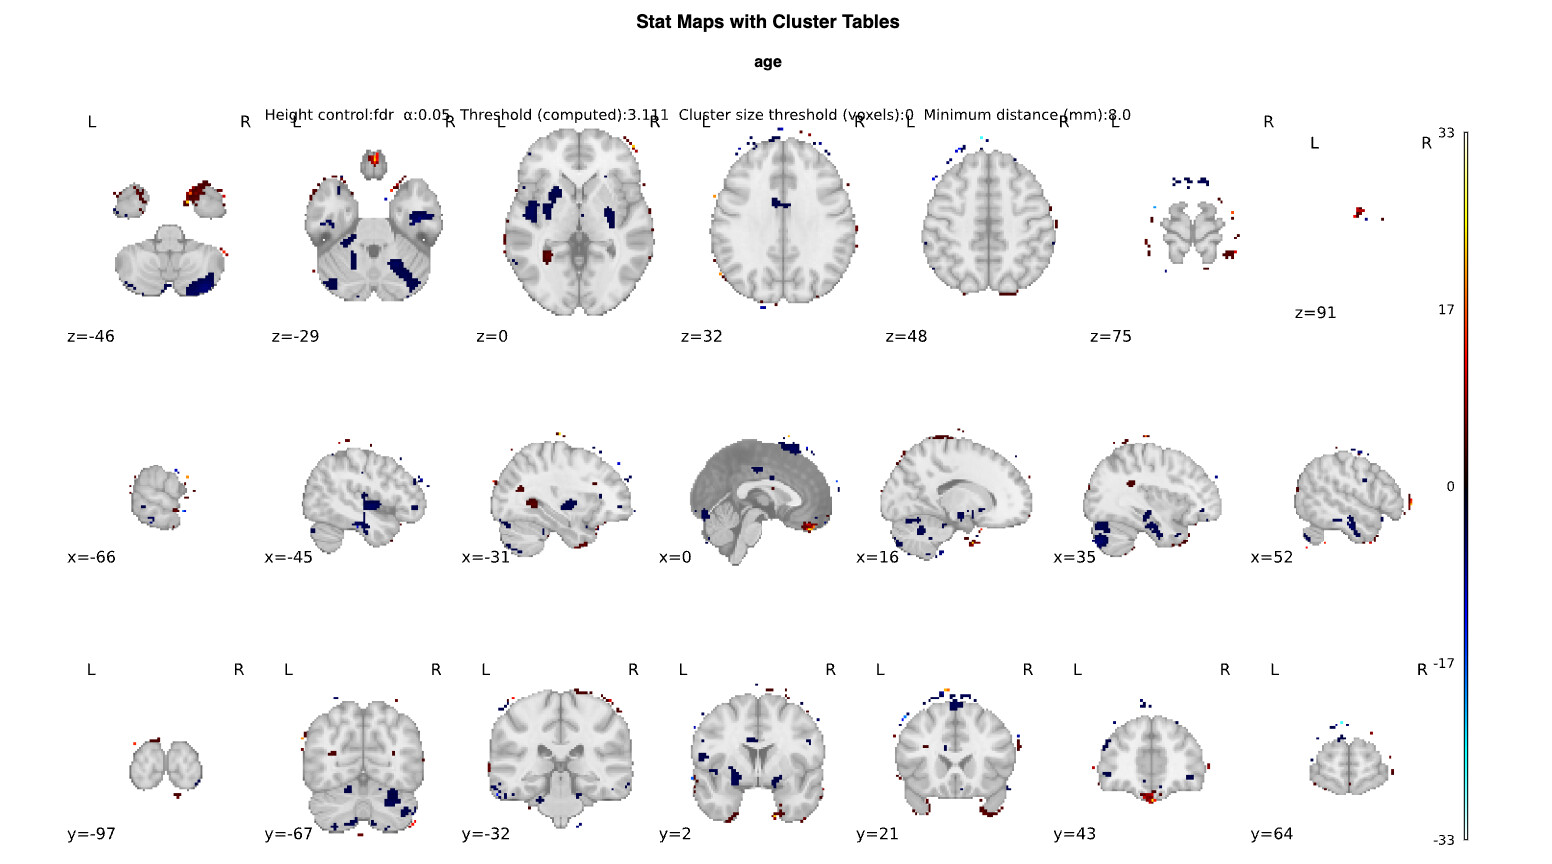
As you can see, the location of many ‘voxels’ that survive the fdr-correction have a problematic location: they are outside the brain image/mask within the plotting function. This data is not random however, and you can see that it distributed in a circular shape around the brain, as if that should be the outer edge of the brain image/mask. I have a difficult time finding out where this problem comes from. So any help is very appreciated. Do you have any ideas what could be the problem in this sort of problem?

2. argument mask_img
One solution I tried ties into my second question: What is the use of the argument mask_img in the SecondLevelModel exactly, and should I use this argument?

In the code for my first level correlation maps, I have already used the specific brain mask that fMRIPREP gives as output (in the same MNI space as my functional data - MNI152NLin2009cAsym). I have check this brain masks, and it fits very well on my preprocessed functional data from which the correlation maps are produced.

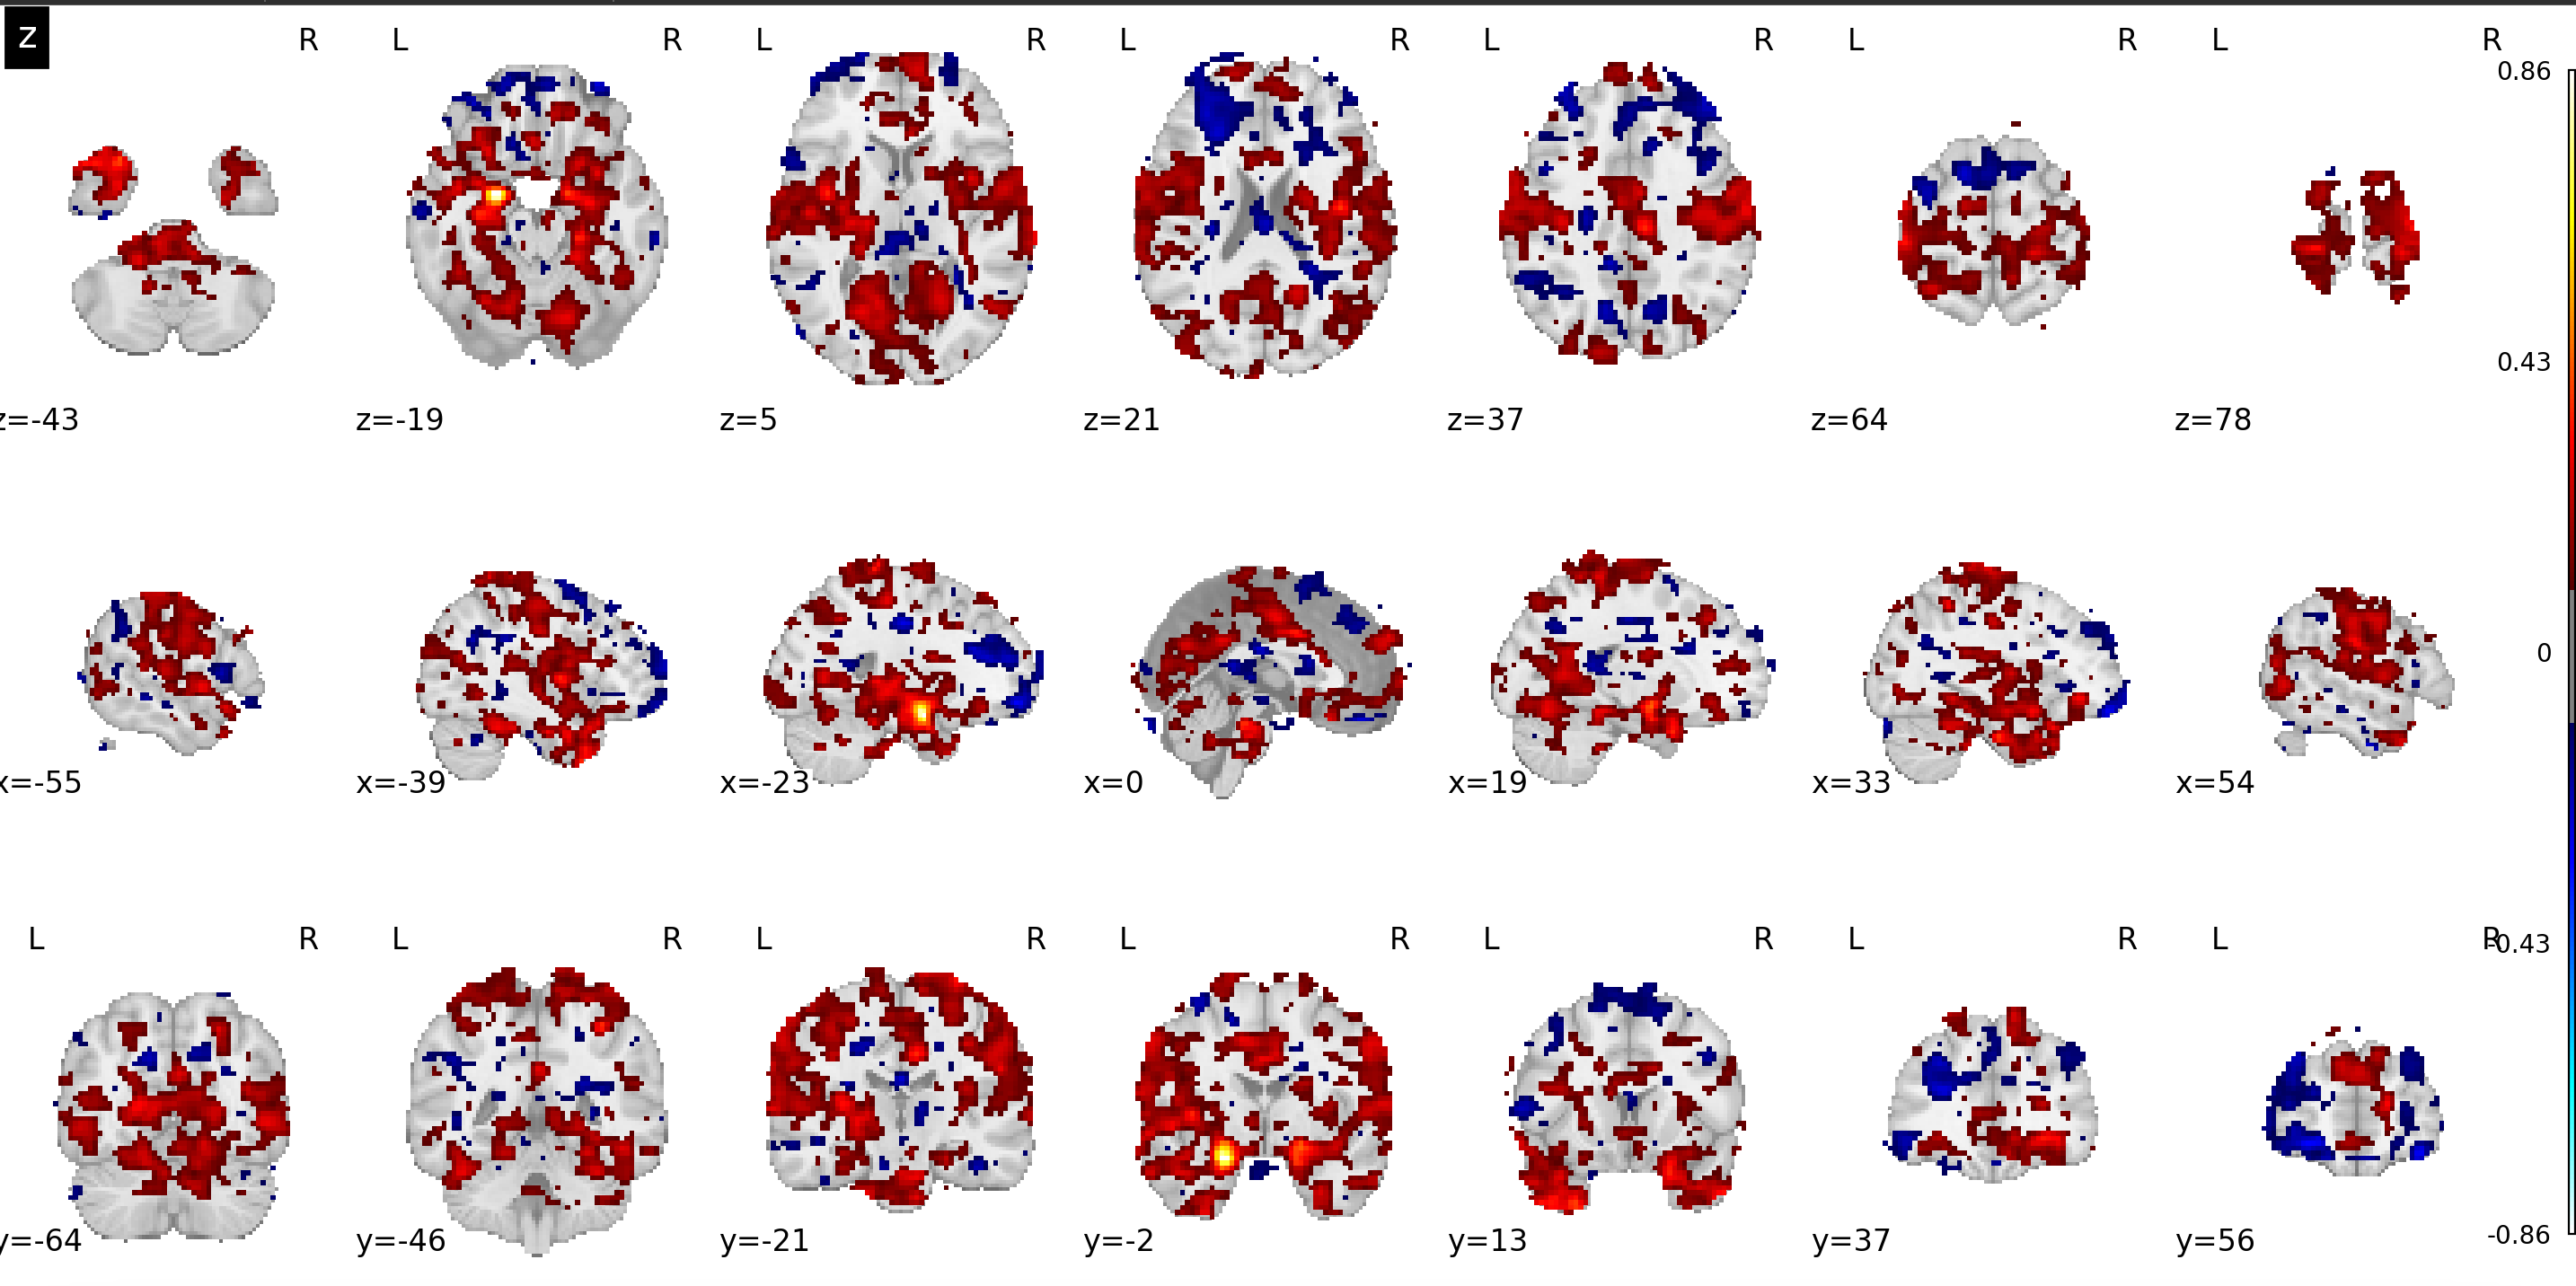
In this sense, the functional data as input into the SecondLevelModel is already masked. I did try to specify mask_img in this function as one fMRIPREP brain_mask nii.gz file (from a random participant), and this had an effect on the statistical maps: less severe finding of significance outside the brain - but still apparent:

To conclude, does anyone have an idea what could be going wrong - in what step of processing an error can occur to give rise to this distorted second level statistical output when I plot it. And second, how and when do you use the mask_img argument in the second level model. Is it a good idea to use this at the second level, or is that problematic?

Thanks a lot.

1 Like

I have the impression that you kelp an intercept, which is redundant with the ensuing subject regressors.
Indeed, these out-of brain effects are intriguing, even though they are not that many.
You should certainly use a mask for the second-level analysis.
Best,
Bertrand

Thank you for your response Bertrand.

Indeed I kept an intercept next to subject intercepts. I am under the impression that each mixed model always also has an overall intercept. Formulas denoting mixed models always show a B0 parameter besides (1 | subject).

And secondly, about the brain mask for the second-level analysis. It probably wouldn’t be possible to compute the average brain mask for the participants in my second level model? In terms of fMRIPREP output, I have individual brain masks in MNI space, but these will differ between participants. I can use the brain mask of one participant, but using the average mask or an aggregate mask from my fMRIPREP output would be a much better approach.

What other brain mask that fits our data could I use if not an individual’s brain mask? Would I need to compute a brain mask on the basis of my statistical maps? I know Nilearn has functions to compute masks.

Regards,
Bas

I think you said you did this above, but I wanted to ask - did you look at the first level outputs for each subject and do you see this? I had an initial guess (could be totally wrong) that there is an issue in motion correction leading to some weird alignment, which should show in your first level I think.

Hi Rahul,

Thanks for your reply. So when I look into the first level correlation maps, I do see signal outside the brain template space when plotting the correlations in a similar fashion.

However, these ‘outisde-findings’ do not look very similar to the dots outside the brain in the picture of the the second level GLM. Because at the second level, I find these tiny blibs of very high z- scores (much higher then I find inside the plotted brain image). In the picture below, of first level output for one individual, you see parts of the smoothed signal reaching to outside the brain, and yes that occurs in all directions. I interpreted this as possible noise that would get cancelled out in the second level model.

Could this what you see here in the first level carry over to create the problem I encounter in plotting of the second level model? Because I do see phenomena outside the brain, but it is not the same. Or do you have other ideas?

If the issue would indeed be alignment after motion correction - this problem would happen in my manual specification of the confounds used to clean the signal - i.e. columns selected in the fMRIPREP confounds.tsv file?

Thanks,
Bas


two more ideas to check:

  1. did you plot your z scores onto the correct brain in your visualization (eg. the participant’s individual brain for first level results and the correct MNI template for the second level results)?

  2. did you try finding the union of the masks of all participants and then plotting the second level results?

hope this helps!
-debbie

If the above don’t help, I do think it could be motion. I think it is hard to compare z-scores in your first level to those in your second level since those are normalized values, but I think usually those types of ring-y activations outside the brain are due to motion or alignment. I think some of the straight line edges you can sometimes see could be motion artifacts too.

I think if you look at the carpet plots or framewise displacement for an individual subject (check the fmriprep report for that subject) you might see this reflected as well.

Are you using the motion regressors from fmriprep in your design matrix (e.g. translation and rotation in x/y/z)?

Thanks for your suggestion. I do correct for motion using translation, rotation, and their temporal derivates + scrubbing volumes that are motion outliers. I think I might have found out the major issue however:

For the individual level brain masks, I used fMRIPREP’s functional-based mask, but this appears to still include a fair bit of non-brain space (e.g. skull, sinuses). Instead I used the structural mask of the brain, and this nicely fits the actual brain parenchyma. No more issues of signal outside the brain mask, so far so good.

Thank you Debbie. I did create a union of the masks of all participants, but this did not solve my problem - as you can read in my latest response to Rahul, the main problem probably is to be find in the earlier steps of creating individual level correlation maps.

When I create a union of structural brain masks in the same functional space I am using (2009cAsym), then I end up with no results outside the brain in the second level model.