Hi all,
I have a question regarding the learning of components with nilearn & sklearn’s RBM.
I followed a paper on using RBM on fMRI timeseries and tried to replicate the RBM analysis (I used the movie-watching dataset shipped with nilearn).
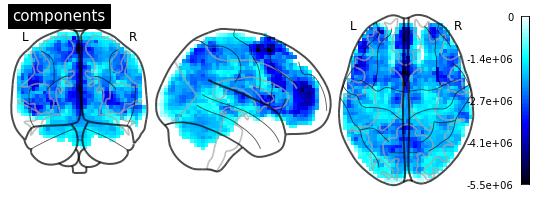
After masking say 10 subjects with MultiNiftiMasker, I fit the RBM on the 1D timeseries. With masker.inverse_transform, single components of the RBM can be visualized when reshaping beforehand to 2D [scans x voxels]. Disadvantage here is of course that you can’t scroll through the components, as I have to reshape and inverse_transform beforehand.
My question now is, is it possible to get a format similar to fastICA (e.g.(20, 24000))? I’m not sure if I have overseen something and the correct output for visualization should be similar to fastICA, or if it is okay to have the single RBM components in [scans x voxels] format?
Comments/help is very much appreciated
Cheers,
higgs
