Hello Brilliant Nilearn Visualizers!
I’ve run some tests on ROIs defined by the Shen 268 atlas. To compare with previous literature, which often uses surface projections, I’ve projected the statistical results from the atlas onto the cortical surface using nilearns plotting.plot_img_on_surf function.
To get a sense of how the ROI boundaries change when they are projected onto the surface (and how the stats are interpolated across the cortex), I wanted to project the ROIs with a mapping to fairly discrete colors.
This is my first attempt, which remaps the ROI numbers of the atlas image from 1-268 to a loop of 1-6, and uses a color map with 6 colors:
colors = ['blue', 'green', 'yellow', 'orange', 'red', 'purple']
ncolors = len(colors)
expanded_colors = (['gray'] * (ncolors+1)) + colors  # padding since nilearn wants symmetric cmap
cmap = ListedColormap(expanded_colors)

roi_nums = repmat(np.arange(1, ncolors+1), n=int(np.ceil(268/ncolors)), m=1)[0][:268]


shen_img = nibabel.load(shen_mask.labels_img)
shen_data = shen_img.get_fdata()
for i in range(1, 269):
    shen_data[shen_data==i] = roi_nums[i-1]

updated_shen_img = nibabel.Nifti1Image(shen_data, shen_img.affine, shen_img.header)

_ = plotting.plot_img_on_surf(
        updated_shen_img,
        surf_mesh='fsaverage5',
        views=['lateral', 'medial'],
        hemispheres=['left', 'right'],
        colorbar=True,
        cmap=cmap,
    )
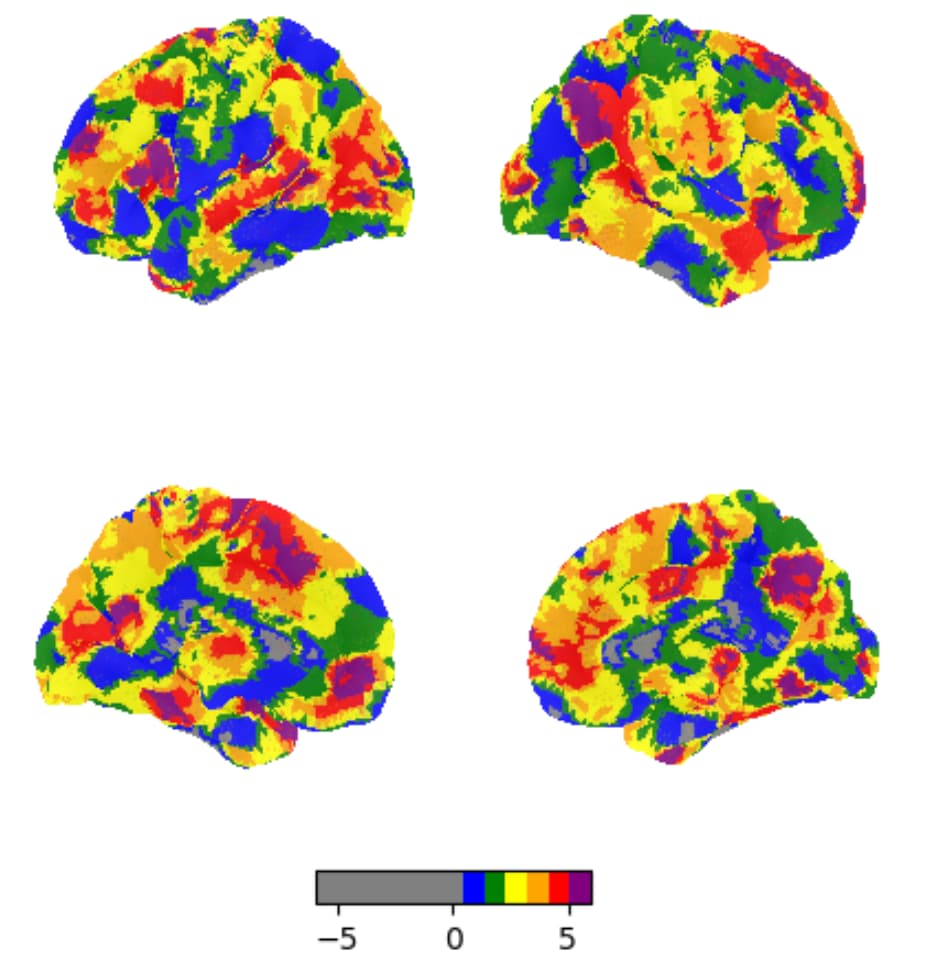
This works ok, but has two issues.
- It discretizes the colors, which obscures the value interpolation between ROIs
- It’s not truly circular - when a region that has been mapped onto purple (value 6) is next to a region mapped onto blue (value 1), it runs through the intervening colors (red-orange-yellow-green), creating a sense that thin strips of other ROIs separate these two regions.
I changed to a linearly interpolated colormap using the same code as above but changing the definition of the colormap:
cmap = LinearSegmentedColormap.from_list(
        "Custom", expanded_colors, N=256)
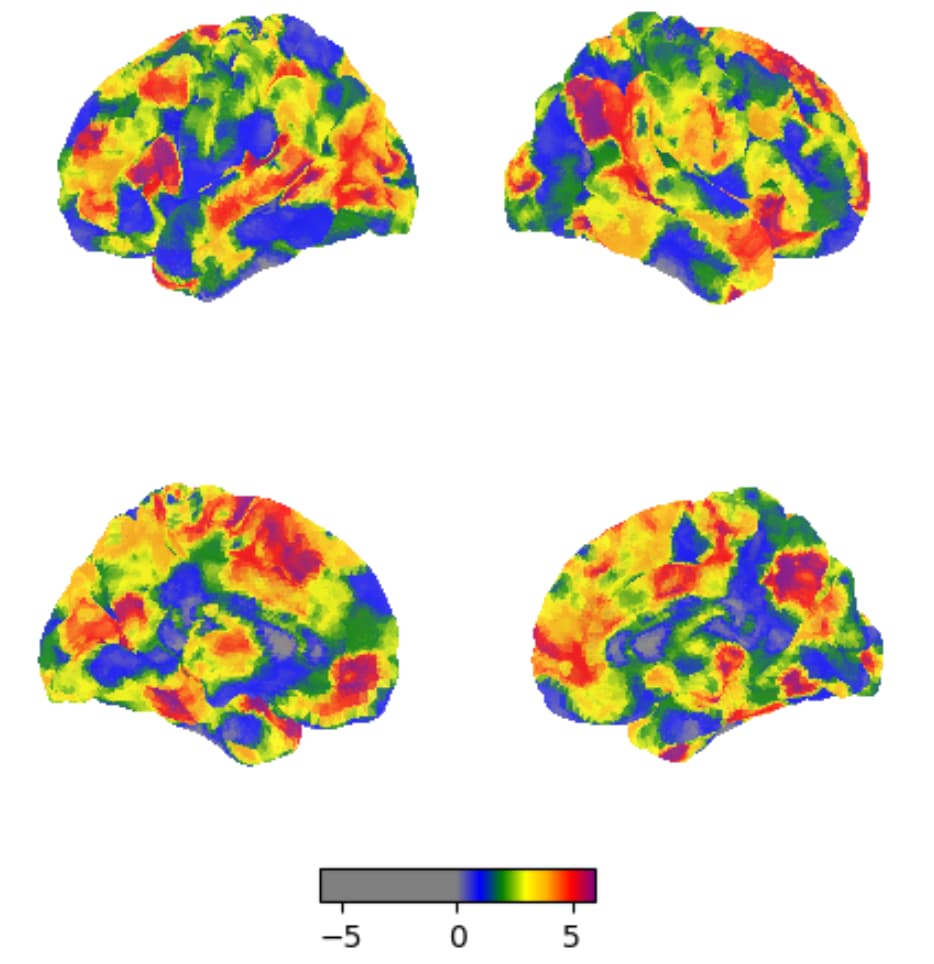
This resolves issue 1 but not issue 2.
As an alternative, I tried making a color map with 268 color mappings so that at least some sometimes purple would map directly to blue (e.g. when region 6 is next to region 7), but that seems to produce drastically different behavior…
colors = ['blue', 'green', 'yellow', 'orange', 'red', 'purple']
ncolors = len(colors)
colors = colors * int(np.ceil(268/ncolors))
ncolors = len(colors)
expanded_colors = (['gray'] * (ncolors+1)) + colors

cm = LinearSegmentedColormap.from_list(
        "Custom", expanded_colors, N=256*268)

shen_img = nibabel.load(shen_mask.labels_img)
_ = plotting.plot_img_on_surf(
        shen_img,
        surf_mesh='fsaverage5',
        views=['lateral', 'medial'],
        hemispheres=['left', 'right'],
        colorbar=True,
        cmap=cm,
    )
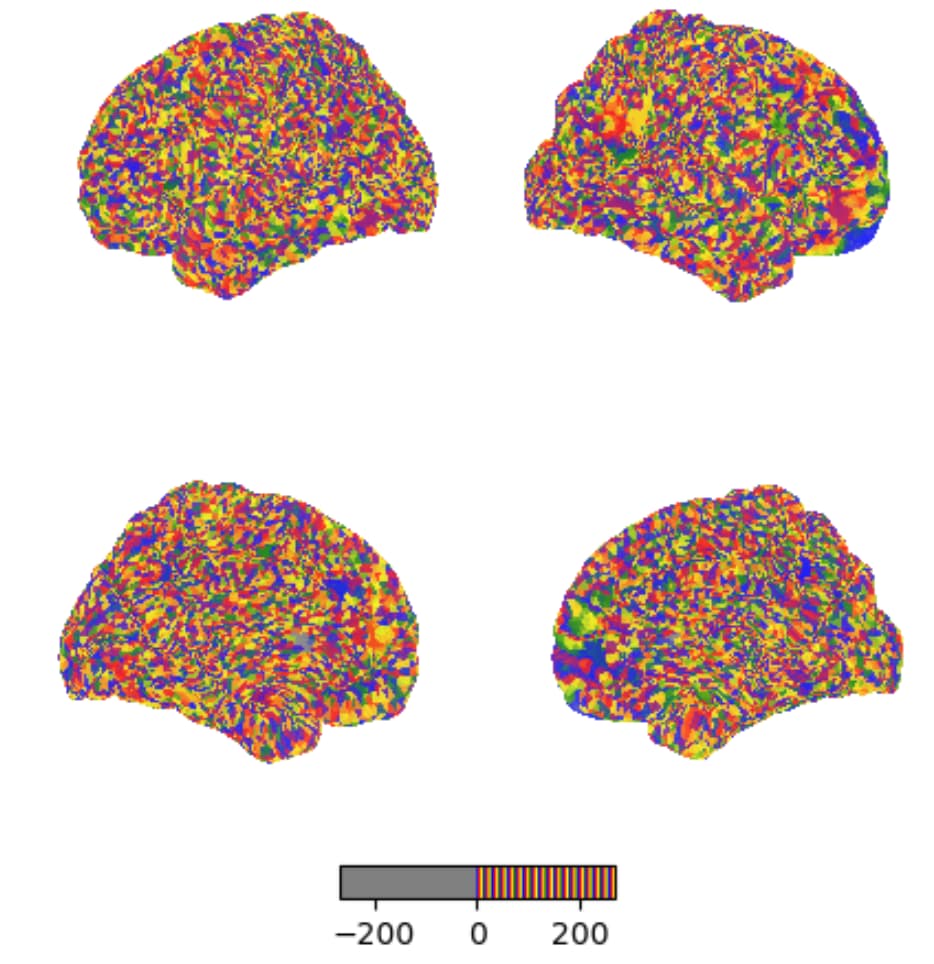
Does anyone have any advice on resolving issue 2, or what I might be doing wrong in the last approach? Any suggestions would be greatly appreciated.