Plotting with nilearn: Any possibility to zoom or to visualize section of image?

Hi everyone,

I am relatively new to fMRI data analysis and I started to work with nilearn, nibabel and nipype. For my master thesis I am investigating different pattern of resting state connectivity of subnuclei of the amygdala.
For this purpose I am using some brain atlases which are tailored to the amygdala only and the subnuclei are thus very small.
I want to plot the subnuclei in greater detail because with the usual plotting functions (plot_roi, view_img, plot_img,…) and their default parameters I cannot recognize anything. I have had a look on the possible parameters and either I don’t understand which one to specify or it’s just not possible. Is there some parameter to specify?
And if not, can anyone help me to find a solution to plot a subsection of the atlas image (3D nii image) on a brain template?
I know that I can plot it with greater detail using matplotlib and the data array but then I am missing the reference points for the underlying brain template.
Best,
Carina

I’m not sure about a parameter for zoom, but here are 2 ways to do this:

  • crop the image and background before plotting:
from nilearn import plotting, datasets, image

img = image.load_img(datasets.fetch_atlas_destrieux_2009()["maps"])
# (you can change the last column of the affine to move the new fov)
img = image.resample_img(
    img, target_affine=img.affine, target_shape=(40, 40, 40)
)
bg = image.load_img(datasets.load_mni152_template(2))
bg = image.resample_to_img(bg, img)
disp = plotting.plot_roi(img, bg_img=bg)
plotting.show()

plot1

  • change the limits of the matplotlib axes after plotting
from nilearn import plotting, datasets

atlas = datasets.fetch_atlas_destrieux_2009()
disp = plotting.plot_roi(atlas["maps"])
disp.axes["x"].ax.set_xlim(-30, 30)
disp.axes["x"].ax.set_ylim(-30, 30)
plotting.show()

plot2

Thank you very much for that fast answer!
I checked out both of the versions however it does not work and I do not understand why this is exactly.

For the first solution with the resampling I always get the error message
ValueError: could not broadcast input array from shape (45,0,8) into shape (0,0,0)
My atlas is not a fetched one but a individually created one so it is only a nifti with different integers to indicate the region - I don’t know if that might be a reason for the error…?
The shape is (260, 311, 260) and the affine
[[ -0.69999999 0. 0. 90. ]
[ 0. 0.69999999 0. -126. ]
[ 0. 0. 0.69999999 -72. ]
[ 0. 0. 0. 1. ]]

For the second solution the display object only has the usual x,y,z keys for the axes when the slicing mode is the default ortho. However I need to prepare various y-slices. So my object is a nilearn.plotting.displays.YSlicer.
How can I set the axes for an YSlicer obejct then? I’ve tried a few options like specifying the axes attribute axes=(-30,-30, 10,10) in various ways or first create fig,ax = plt.figure() and then specify it but it didn’t work.

One additional question is like how would I find out a solution on my own? Where can I read about that things like the attributes of the different objects etc? I could not find any of this on the nilearn pages unfortunately.

for the second solution you can adapt it like this:

from nilearn import plotting, datasets

atlas = datasets.fetch_atlas_destrieux_2009()
disp = plotting.plot_roi(atlas["maps"], display_mode="y")
for cut_ax in disp.axes.values():
    cut_ax.ax.set_xlim(-30, 30)
    cut_ax.ax.set_ylim(-40, 40)
plotting.show()

(adapt the limits to what suits you instead of the ones I used)

for the first solution, can you share the image and the exact script you used?

regarding finding solutions,

  • cropping the image to display only the part you want seems straightforward. you can read more about image resampling, shapes and affines here and here
  • the attributes of the Display objects are unfortunately not documented well enough atm, and we have been discussing improving that part of the documentation and adding advanced plotting examples in the gallery. but the plots created by nilearn are just matplotlib figures, so when you want to modify a nilearn plot, the difficulty is just to find out what are the relevant matplotlib axes. we will work on making that easier, but in the meanwhile you can inspect (eg in the interactive interpreter, in a debugger, with print statements, …) the objects returned by the plotting funtions. they contain an axes attribute, each of its keys has an ax attribute which is a matplotlib axis. alternatively, you can start from the matplotlib figure and use the methods it provides for inspection, such as get_axes. once you have managed to get a reference to the appropriate axes you can easily do anything you need and the matplotlib documentation will provide all the necessary information

note that there are probably better solutions for zooming into part of the image than the ones I suggested here!

Hi,
thank you for all the advice. With the suggested adaption it worked now.

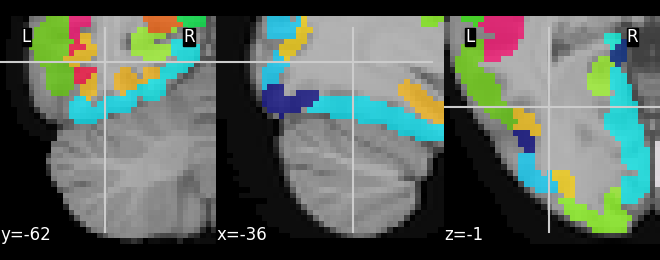
Regarding the resampling solution I tried to upload the image but the filetype is not supported, so I cannot share it. However I used the 700um probabilistic file from here OSF | Amygdala Atlas Files and adjusted it with a threshold of 0.7 and multiplied each dimension with 1,2,3… to distinguish the nuclei.
And the code to reproduce the error was kind of the same what you posted

img = image.resample_img(
 atlas2, target_affine=atlas2.affine, target_shape=(40, 40, 40)
)
bg = image.load_img(datasets.load_mni152_template(2))
bg = image.resample_to_img(bg, img)
disp = plotting.plot_roi(img, bg_img=bg)
plotting.show() 

Unfortunately now if have another problem with my plots as they do not save correctly (actually being plain white). Can I just ask you again if that is related to the issue of showing the image before saving as described here: Saving plots - Problem Solving with Python?
I tried it with %matplotlib auto to disable the inline plotting but same problem.
This is my code:

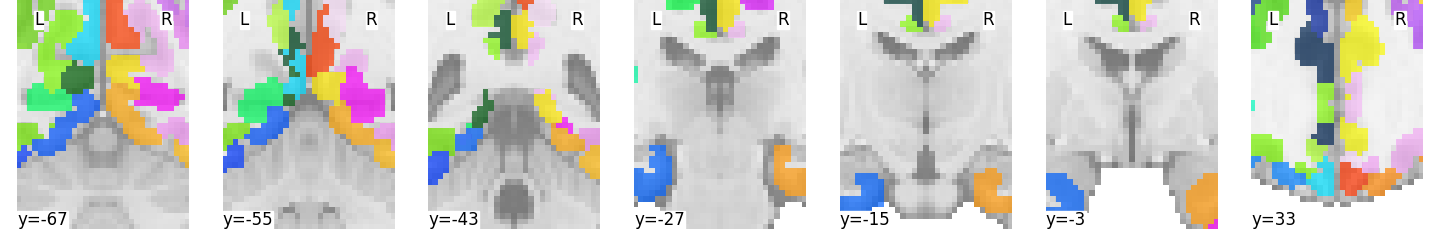
y_slices = [-15,-14,-13,-12,-11,-10,-9,-8,-7,-6,-5,-4,-3,-2,-1,0,1]


# set colors of the different nuclei
la = ListedColormap([9/255, 215/255, 200/255])
bldi = ListedColormap([9/255, 197/255, 147/255])
bm = ListedColormap([63/255, 195/255, 58/255])
ce = ListedColormap([245/255, 0/255, 0/255])
cmn = ListedColormap([130/255, 5/255, 90/255])
blpl = ListedColormap([113/255, 169/255, 140/255])
ata = ListedColormap([240/255, 80/255, 190/255])
asta = ListedColormap([250/255, 150/255, 150/255])
aaa = ListedColormap([255/255, 225/255, 0/255])

for y_slice in y_slices:
    display = plotting.plot_roi(image.index_img(TP_img, 0), threshold=0.7, cmap=la, display_mode='y', cut_coords = [y_slice],
                                 colorbar=False, axes=(100,100,10,10))
    
    display.add_overlay(image.index_img(TP_img, 0),threshold=0.7,
                    cmap=la) # LA
    display.add_overlay(image.index_img(TP_img, 1),threshold=0.7,
                   cmap=bldi) # BLDI
    display.add_overlay(image.index_img(TP_img, 2),threshold=0.7,
                    cmap=bm) # BM
    display.add_overlay(image.index_img(TP_img, 3),threshold=0.7,
                    cmap=ce) # CE
    display.add_overlay(image.index_img(TP_img, 4),threshold=0.7,
                    cmap=cmn) # CMN
    display.add_overlay(image.index_img(TP_img, 5),threshold=0.7,
                   cmap=blpl)
    display.add_overlay(image.index_img(TP_img, 6),threshold=0.7,
                    cmap=ata) # ATA
    display.add_overlay(image.index_img(TP_img, 7),threshold=0.7,
                    cmap=asta) # ASTA
    display.add_overlay(image.index_img(TP_img, 8),threshold=0.7,
                    cmap=aaa) # AAA
    
    for cut_ax in display.axes.values():
        cut_ax.ax.set_xlim(-40, 40)
        cut_ax.ax.set_ylim(-40, 40)
    
    display.savefig(f'{plot_dir}Masks/Atlas/th70_{y_slice}.svg')
    display.close()

is there a missing link?

what happens if you run your code as a python script (not in the interactive python shell nor in a jupyter notebook, but invoking it as python myscript.py?

for us to investigate an error you would need to share inputs and a complete (minimal) script that we can run to reproduce the problem.

Hi,
sorry for the late reply. Indeed there was a link missing, however I cannot find it anymore.

With the python script it worked out perfectly and the images got saved. Thanks for the advise.
I don’t know what else about the code I should share. What I posted together with the link to the file (CIT168_pAmyNuc_700um.nii.gz) that I downloaded from OFS which I loaded an named TP_img.

Best,
Carina

1 Like