Hi all,
I implemented nilearn searchlight code on my dataset for a whole-brain search light analyses and the output figures look weird. More specifically, the searchlight accuracy figure and f score figure look as if they were plotted off the correct axes. Here I attached the relevant code and the output figures:
searchlight.fit(demo_img, y)
from nilearn import image
mean_fmri = image.mean_img(demo_img)
from nilearn.plotting import plot_stat_map, plot_img, show
searchlight_img = new_img_like(mean_fmri, searchlight.scores_)
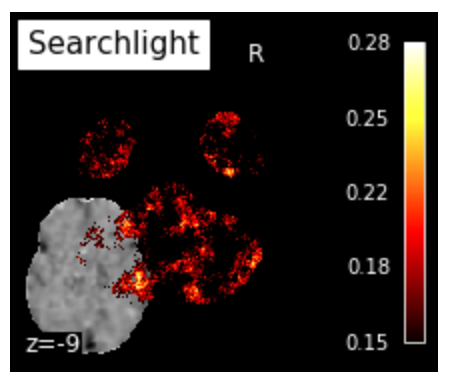
plot_img(searchlight_img, bg_img=mean_fmri,
title="Searchlight", display_mode="z", cut_coords=[-9],
cmap='hot', threshold=.15, black_bg=True, colorbar=True)
show()
# F_score results
p_ma = np.ma.array(p_unmasked, mask=np.logical_not(mask_img))
f_score_img = new_img_like(mean_fmri, p_ma)
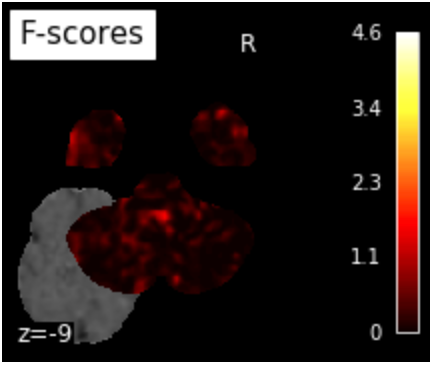
plot_stat_map(f_score_img, mean_fmri,
title="F-scores", display_mode="z",
cut_coords=[-9],
colorbar=True)
show()
I also tried plotting searchlight_img data using nilearn plotting.view_img_on_surf and the output looks fine although there is a big region that showed successful classificaiton during my ROI-based MVPA but was not observed in the whole brain searchlight surf plot.
Any thoughts on what might go wrong?
Thanks,
Lily