I got a strange result in an analysis that I ran, and I’m wondering if anyone can help figure out what’s going on here.
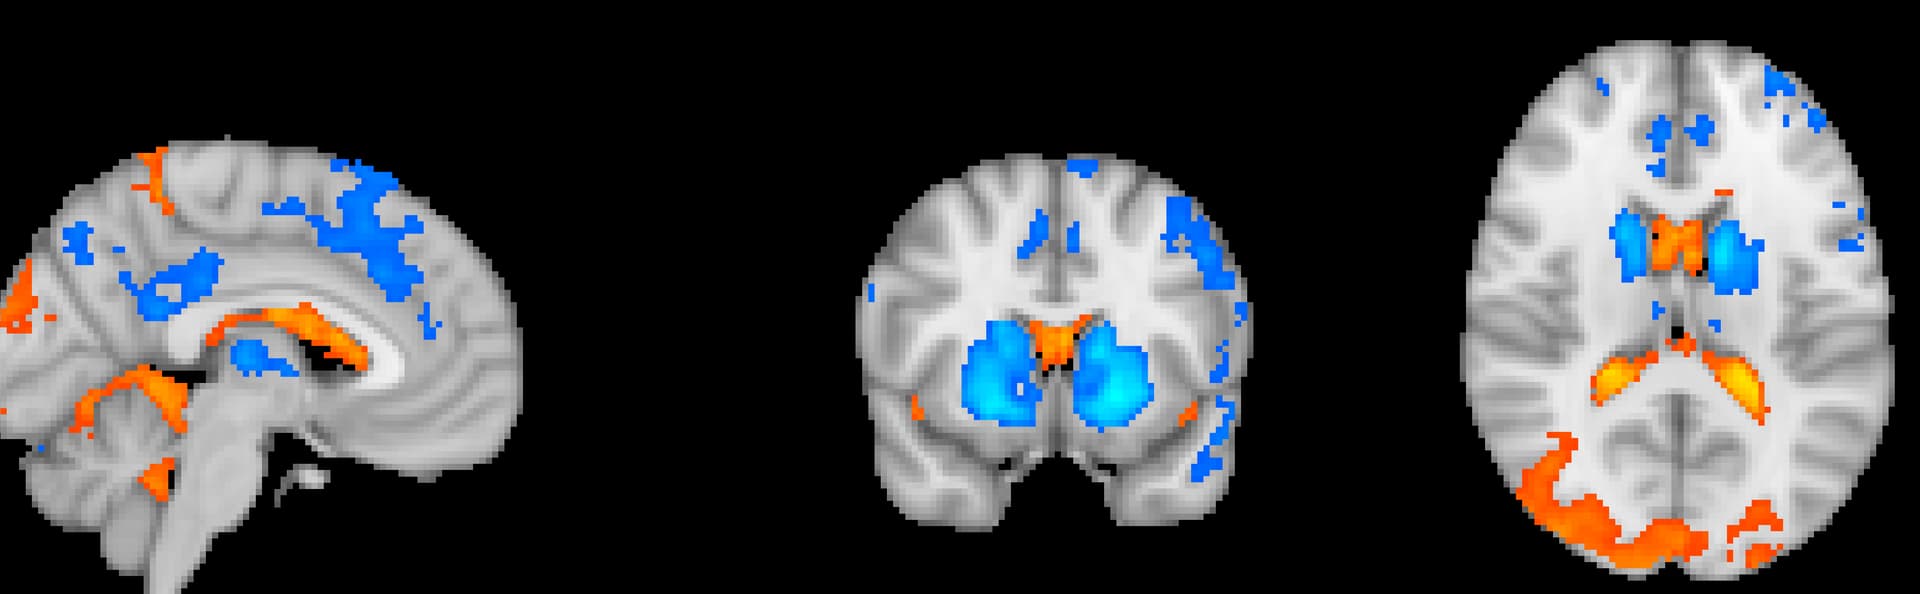
Specifically, I see strong apparent activity specifically localized to the ventricles. The contrast that led to this result was somewhat unusual, trying to track changes in brain activity over time (using trial number as a parametric regressor). The idea is to track psychological adaptation to our stimuli that might occur over time.
I have a few questions:
– Is there something intrinsic to the BOLD signal by which signal in CSF would get stronger over the course of a run?
– I used the aCompCor approach implemented by fmriprep to remove signals in WM and CSF for noise reduction. This is implemented via time courses of principal components that are estimated to be primarily driven by WM and CSF. So any real trend in the ventricles should be regressed out, unless the CompCor CSF regressors could interact with a time-based regressor somehow, I would think.
– Would clusters outside of the ventricles still potentially be valid to interpret?
The contrast that led to this result was somewhat unusual, trying to track changes in brain activity over time (using trial number as a parametric regressor). The idea is to track psychological adaptation to our stimuli that might occur over time.
Additional background information would help clarify the context. For instance:
How many task conditions are included in the experiment?
If multiple conditions are present, does the modulation regressor encode trial numbers serially across all conditions, or separately within each condition?
How are slow drifts or the low-frequency background modeled in the analysis?
Is the figure showing modulation effect from a single participant or a group-level result?
Do the colored voxels represent estimated effect amplitudes or statistical values?
What thresholding criteria were applied to generate the image?
Thanks, Gang. Here are the answers to your questions.
How many task conditions are included in the experiment?
2 conditions
If multiple conditions are present, does the modulation regressor encode trial numbers serially across all conditions, or separately within each condition?
I did just a single modulation regressor, though I wasn’t 100% sure that was the right choice.
How are slow drifts or the low-frequency background modeled in the analysis?
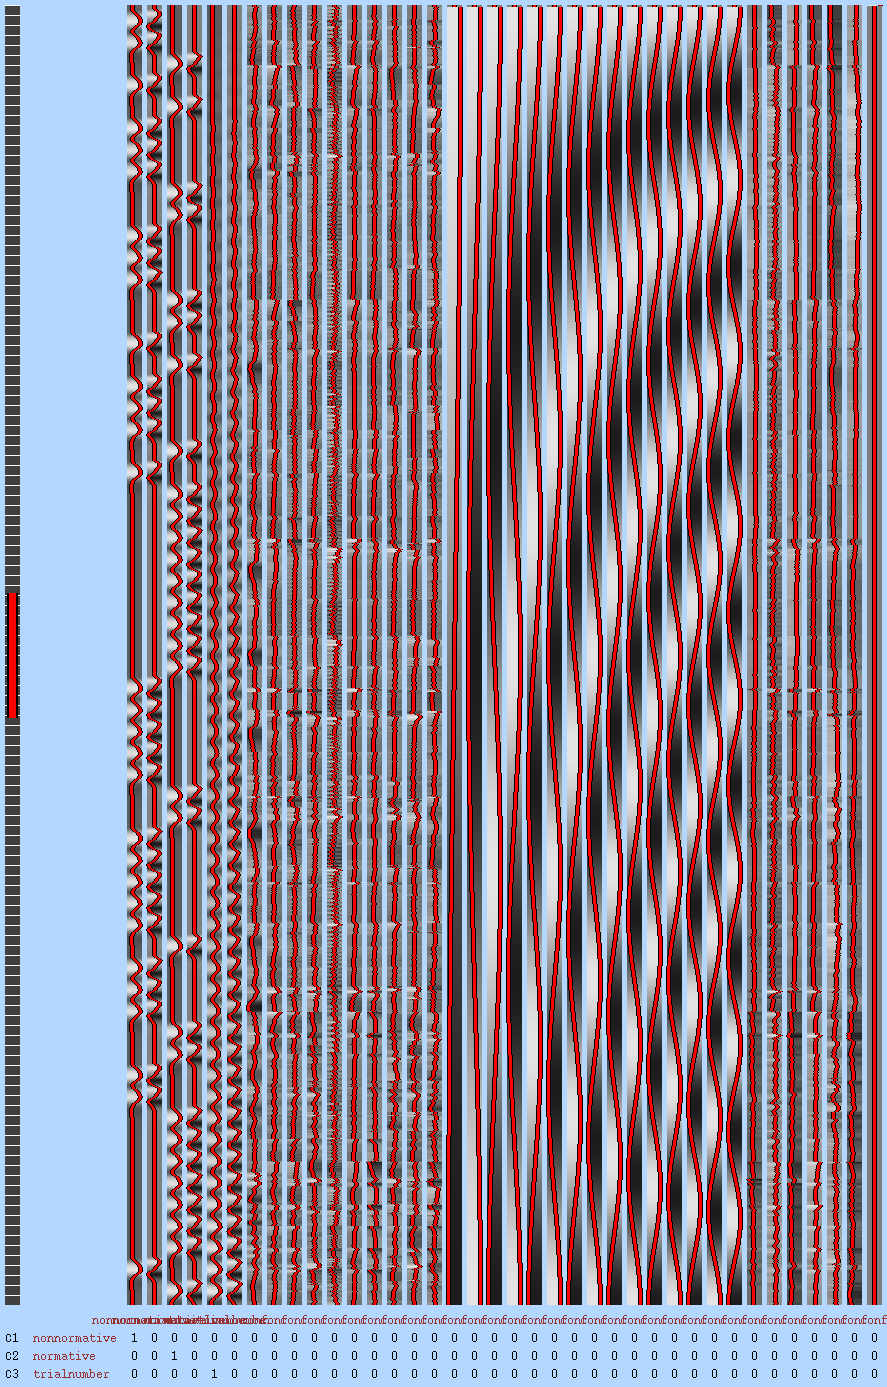
I have a set of 15 cosine basis regressors output from fmriprep included in the design matrix as nuisance regressors. (Other nuisance regressors were 5 WM and 5 CSF regressors from aCompCor, plus 6 motion parameters.)
Is the figure showing modulation effect from a single participant or a group-level result?
This is a group-level result.
Do the colored voxels represent estimated effect amplitudes or statistical values?
Those are z-statistic values from FSL.
What thresholding criteria were applied to generate the image?
I used a traditional clustering approach with the current FSL default, so Z > 3.1 with parametric cluster correction to p < .05.
I’ll also attach the design matrix for one run of one subject as a sample. Please let me know if anything comes to mind.
I did get a suggestion elsewhere to apply a gray-matter mask before running the analysis, which would eliminate the ventricles from the results, though I’m not sure if that addresses the underlying issue… (We were speculating that the underlying issue could be some sort of physiological noise that changes over time, but I’m not sure exactly what that would be.)
I assume each task is modeled using a canonical HRF along with its temporal derivative. Is the trial-wise modulation applied to both the canonical HRF and its derivative?
Beyond the statistical evidence suggesting trial modulation in the ventricles, do you observe similar patterns in the ventricles for either of the two tasks?
I did get a suggestion elsewhere to apply a gray-matter mask before running the analysis, which would eliminate the ventricles from the results, though I’m not sure if that addresses the underlying issue…
It might be worth exploring this further, understanding what drives the signal in the ventricles could reveal something unexpected. However, that path could turn into a separate project on its own. While using a gray-matter mask may seem like a pragmatic approach, essentially “out of sight, out of mind”, it might also be the simplest way to avoid distraction and stay focused on your current research goals. Unless, of course, your curiosity leads you to follow this new thread in a different direction.
I assume each task is modeled using a canonical HRF along with its temporal derivative. Is the trial-wise modulation applied to both the canonical HRF and its derivative?
I think so, yes – I’m modeling the trial-wise modulation and then also including the temporal derivative for that regressor in the model.
Beyond the statistical evidence suggesting trial modulation in the ventricles, do you observe similar patterns in the ventricles for either of the two tasks?
I think you’re asking about whether we see similar effects in the ventricles for the main effects of either condition? I took a look and it seems like we don’t. So it does seem to be something related to the change over time.
It might be worth exploring this further, understanding what drives the signal in the ventricles could reveal something unexpected. However, that path could turn into a separate project on its own. While using a gray-matter mask may seem like a pragmatic approach, essentially “out of sight, out of mind”, it might also be the simplest way to avoid distraction and stay focused on your current research goals. Unless, of course, your curiosity leads you to follow this new thread in a different direction.
Fair point. I’m pretty sure that I don’t want to start a whole project exploring changes over time in fMRI signal. My worry is mostly about whether the other results from this contrast are likely to be valid, or whether there is some known change over time in BOLD signal that makes using time as a regressor invalid.
But I think you would know better than anyone if that were the case – and what I’m taking from your reply here is that the “pragmatic approach” of using a gray matter mask is not unreasonable? That’s helpful to know.
I think you’re asking about whether we see similar effects in the ventricles for the main effects of either condition? I took a look and it seems like we don’t. So it does seem to be something related to the change over time.
When examining the main effects of either condition in the ventricles, did you apply a stringent threshold? If so, it might be informative to explore the results using a more lenient threshold, for example, a voxel-level p-value of 0.05 and a minimum cluster size of 20 voxels.
My worry is mostly about whether the other results from this contrast are likely to be valid, or whether there is some known change over time in BOLD signal that makes using time as a regressor invalid.
Do the results elsewhere in the brain generally align with your research hypotheses? Findings in the ventricles may not be inherently concerning, as they could reflect non-neuronal influences.
On a separate note, if one wishes to be more rigorous, the construction of task regressors deserves careful attention. Including a time-derivative regressor is typically intended to accommodate regional variability in the timing of the BOLD response. However, if the associated parameter estimates are ultimately discarded, the approach may fall short of its intended purpose. This common practice introduces an internal inconsistency between the modeling rationale and the interpretation of results, potentially compromising detection sensitivity in the process.
The fMRI BOLD effect is measured using a time series of T2*-weighted EPI observations, and these data are prone to a range of low-frequency effects. The first few volumes are often discarded because they are contaminated by T1 equilibration. Over the course of a run, heating of the gradients and gradual scanner instabilities contribute to slow signal drift, and physiological factors such as changes in respiration or CO₂ also add low-frequency variance. Unlike ASL, which cancels many of these effects by differencing pairs of acquisitions close in time, BOLD fMRI is especially susceptible to this drift.
For this reason, high-pass filtering is typically required to recover interpretable task-related effects. The good news is that the hemodynamic response of interest falls in a much higher frequency range (on the order of 0.01–0.1 Hz for typical tasks), and even in resting-state studies most analyses focus on this band. When regressors are designed to capture very slow trends across a run—such as trial number to model adaptation—they can become entangled with scanner drift or CSF-related fluctuations. That’s likely why you are seeing apparent effects in the ventricles: the regressor is picking up on global or non-neural drift that is prominent there.
So, to your specific points:
There is no intrinsic property of the BOLD signal that causes CSF to increase over time; what you are seeing is most likely scanner or physiological drift manifesting in the ventricles.
aCompCor does remove many CSF- and WM-related fluctuations, but if your main regressor also captures low-frequency trends, there can be collinearity. In that case, the ventricle signal may not be fully absorbed by the nuisance regressors.
Clusters outside the ventricles could still be valid, but extra caution is warranted when the regressor of interest is close in frequency to scanner drift. Strong results in CSF should be a red flag that part of the contrast is explained by global or artifactual variance.
In short: fMRI is well suited to capturing transient responses and resting-state fluctuations in the ~0.01–0.1 Hz range, but inherently ill-suited for modeling very slow adaptation across an entire run.
Thank you, this is helpful! (In response to @afm1989, we were able to superficially remove the ventricle activations by masking out the ventricles, but still didn’t feel confident in the results because we assumed it could be something like what @neurolabusc explained above.)
One follow up though: we included the “discrete cosine basis” regressors from fmriprep, which are supposed to provide high-pass filtering, in our model. If we included the FSL high-pass filter instead, should that remove this low-frequency noise? Or is there still some that would get through when the regressor of interest is capturing slow trends?