Summary of what happened:
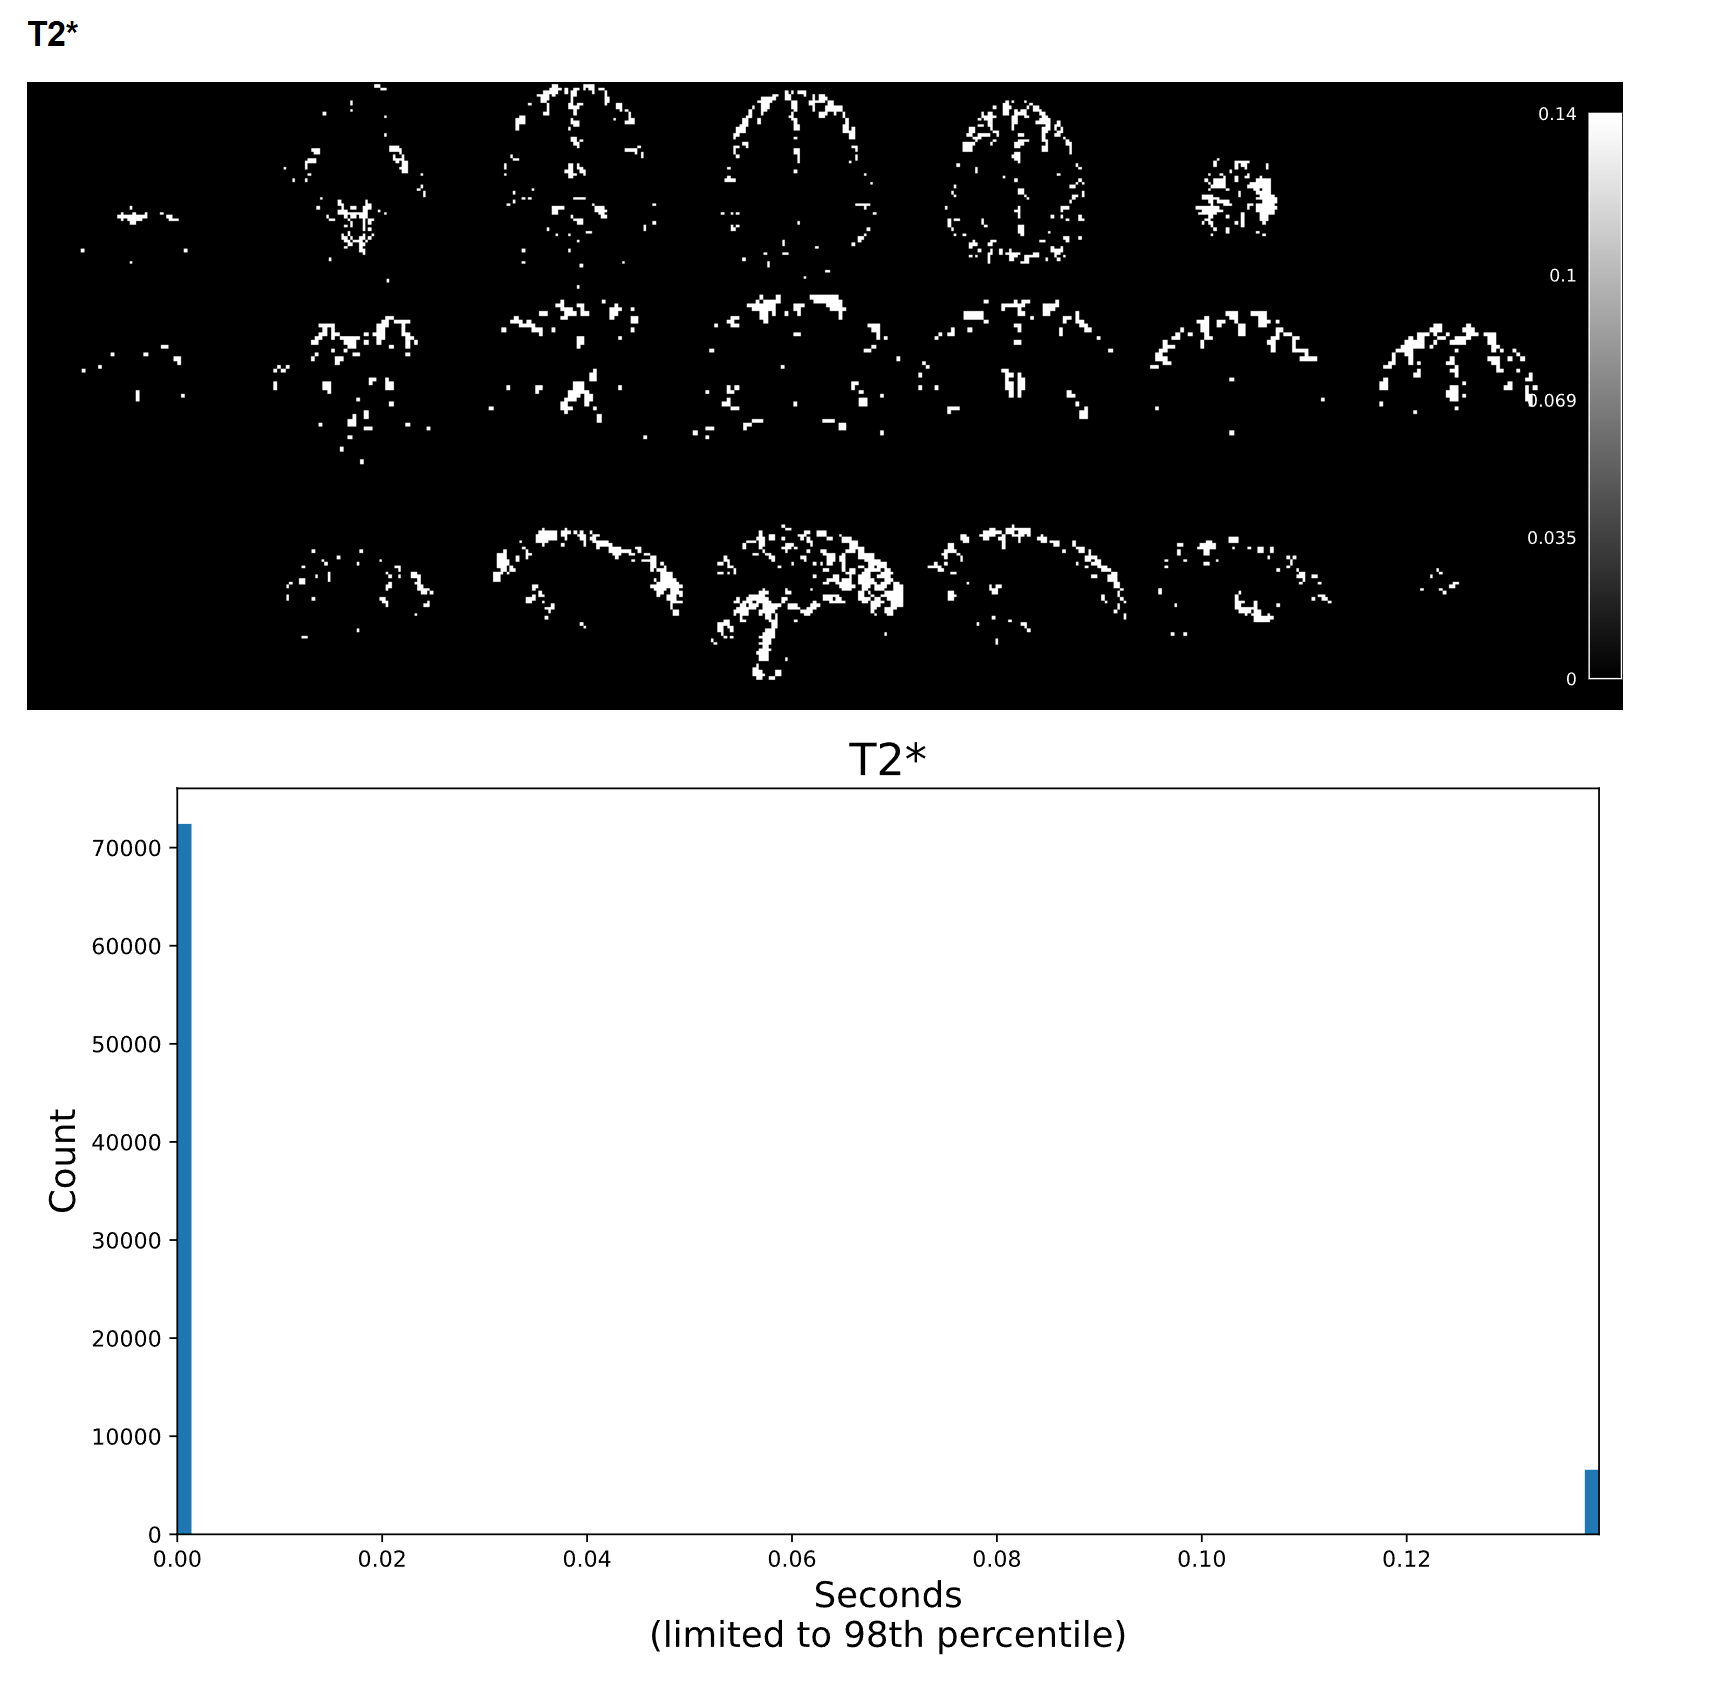
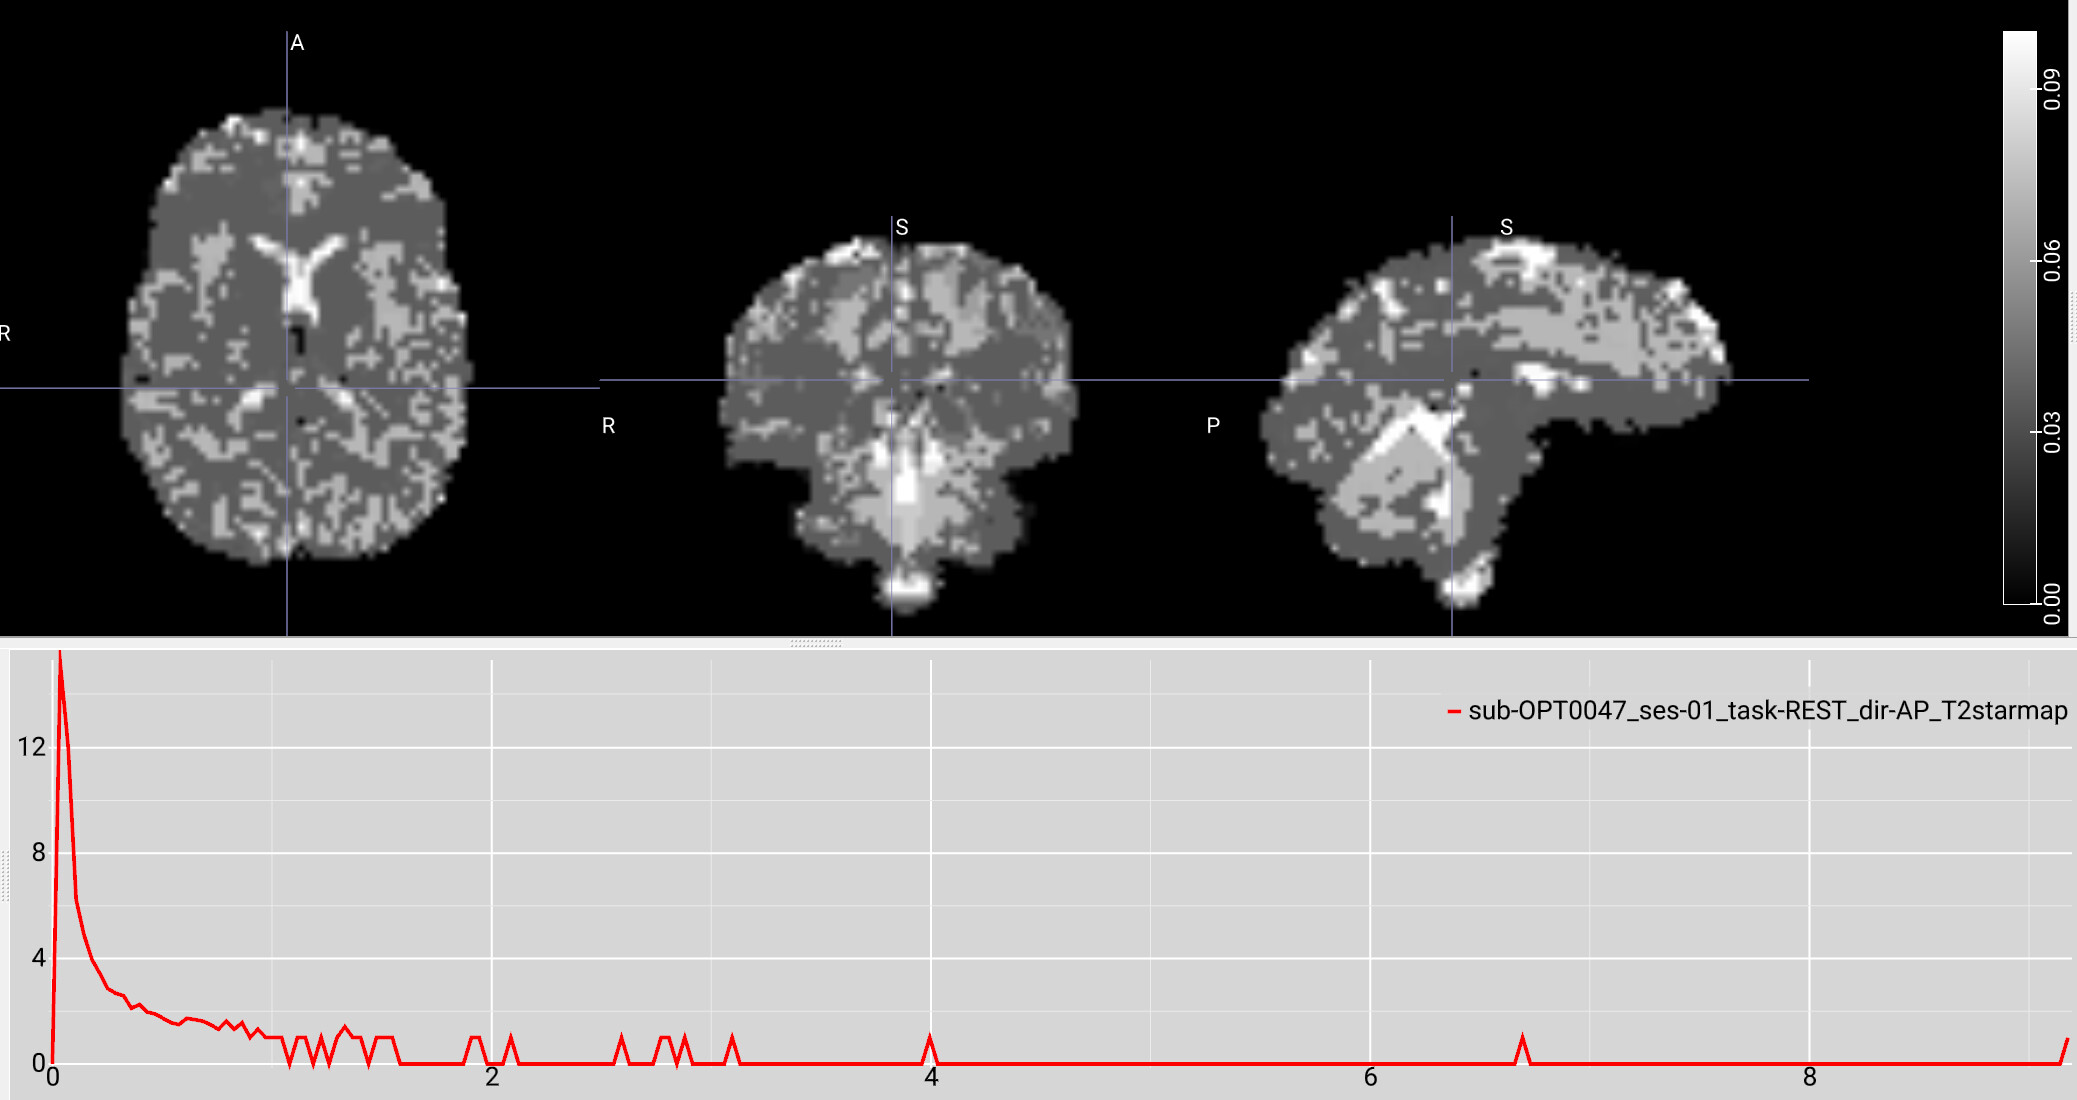
I have a resting state fMRI dataset that I previously processed via tedana 24.0.1; it processed with no problems, but I was having trouble getting an appropriate number of ICA components, potentially due to the high acceleration of the sequence we used. I recently tried running the same data through tedana 26.0.1 using the “robustica” option, and it completed with no errors. However, when reviewing the summary HTML file, the T2* histogram is either blank or only shows a few values. When inspecting the T2starmap.nii.gz, there appear to be a few very extreme voxel values (with values anywhere from tens to hundreds), and most of the brain values consist of a limited range of multiples of each other.
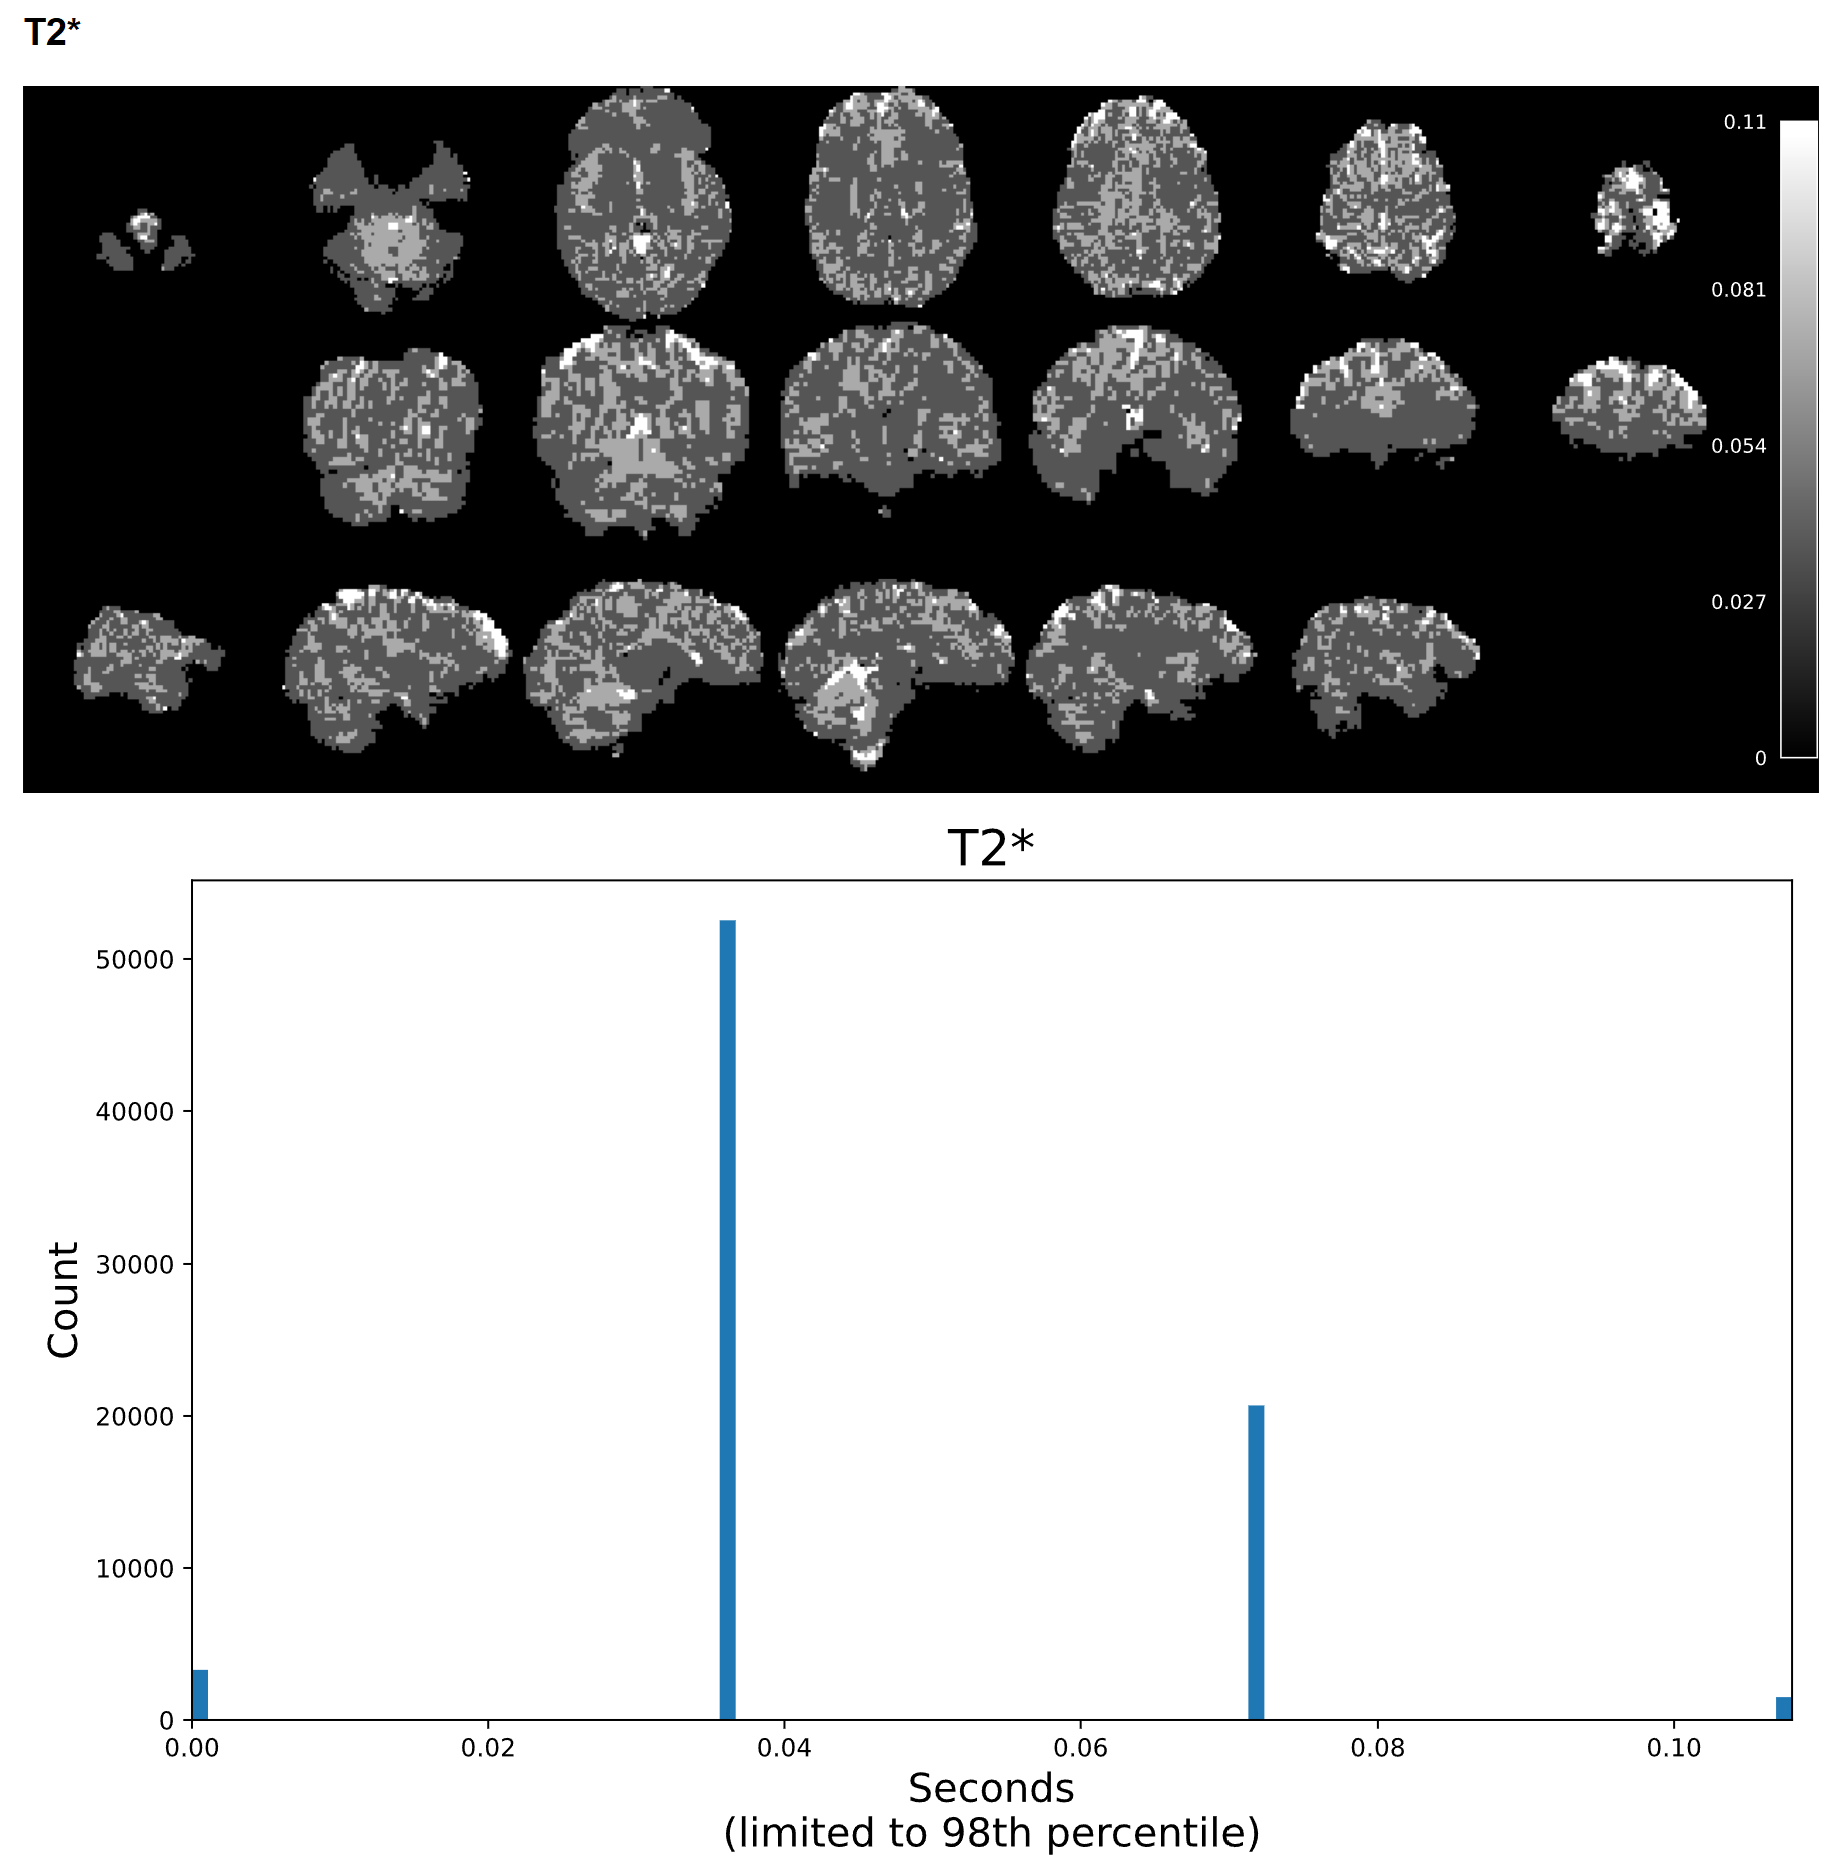
For example, on a scan with a max T2* value of 9, most of the voxels had values of 0.036, 0.072, 0.11, 0.14, etc. It seems like the smallest voxel difference is some fraction of the max value, so if the max value is extremely high, most of the voxels are forced to a few or just 1 value. This was not an issue with 24.0.1, but I’m not sure if it’s a software issue or an issue with my pipeline setup. I can provide further code and logs as needed. Any help would be appreciated!
Command used (and if a helper script was used, a link to the helper script or the command generated):
# A bash script activates a conda environment,
#    runs a python script which sets up variables,
#    removes fMRIPrep-identified dummy volumes from the BOLD,
#    and then runs:

# For tedana 26.0.1
tedana_workflow(
    data=shortened_files,
    tes=ECHO_TIMES,
    out_dir=tedana_out_dir,
    mask=mask_file,
    prefix=prefix,
    tedpca=100,
    fittype="curvefit",
    ica_method="robustica",
    n_robust_runs=50,
    tedort=True,
    n_threads=2
)

# For tedana 24.0.1
tedana_workflow(
    data=shortened_files,
    tes=ECHO_TIMES,
    out_dir=tedana_out_dir,
    mask=mask_file,
    prefix=prefix,
    tedpca=75,
    fittype="curvefit",
    tedort=True
)
Version:
tedana 26.0.1 compared with 24.0.1
Environment (Docker, Singularity / Apptainer, custom installation):
Was installed via these commands on an Ubuntu 22.04.5 linux server:
conda create -n tedana_26.0.1 -c conda-forge python=3.12 pip
conda activate tedana_26.0.1
pip install tedana
Data formatted according to a validatable standard? Please provide the output of the validator:
Tedana input data came from fMRIPrep 23.0.2, which uses BIDS
Screenshots / relevant information:
Additional information: the BOLD data is from a multi-echo sequence with 2.5 mm isotropic voxels, TR = 1670 ms, TEs = 15.60 ms, 38.20 ms, 60.80 ms, 83.40 ms, GRAPPA acceleration factor 2, multiband factor 4.
The data was originally run using fMRIPrep 23.2.3 into tedana 24.0.1, and there were no T2* issues. In order to match versions with another analysis, I reran the data through fMRIPrep 23.0.2 into tedana 26.0.1. Both fMRIprep calls used the same commands, and the output appears similar, but this could have introduced some change. The T2* maps created by both versions of fMRIPrep look normal.
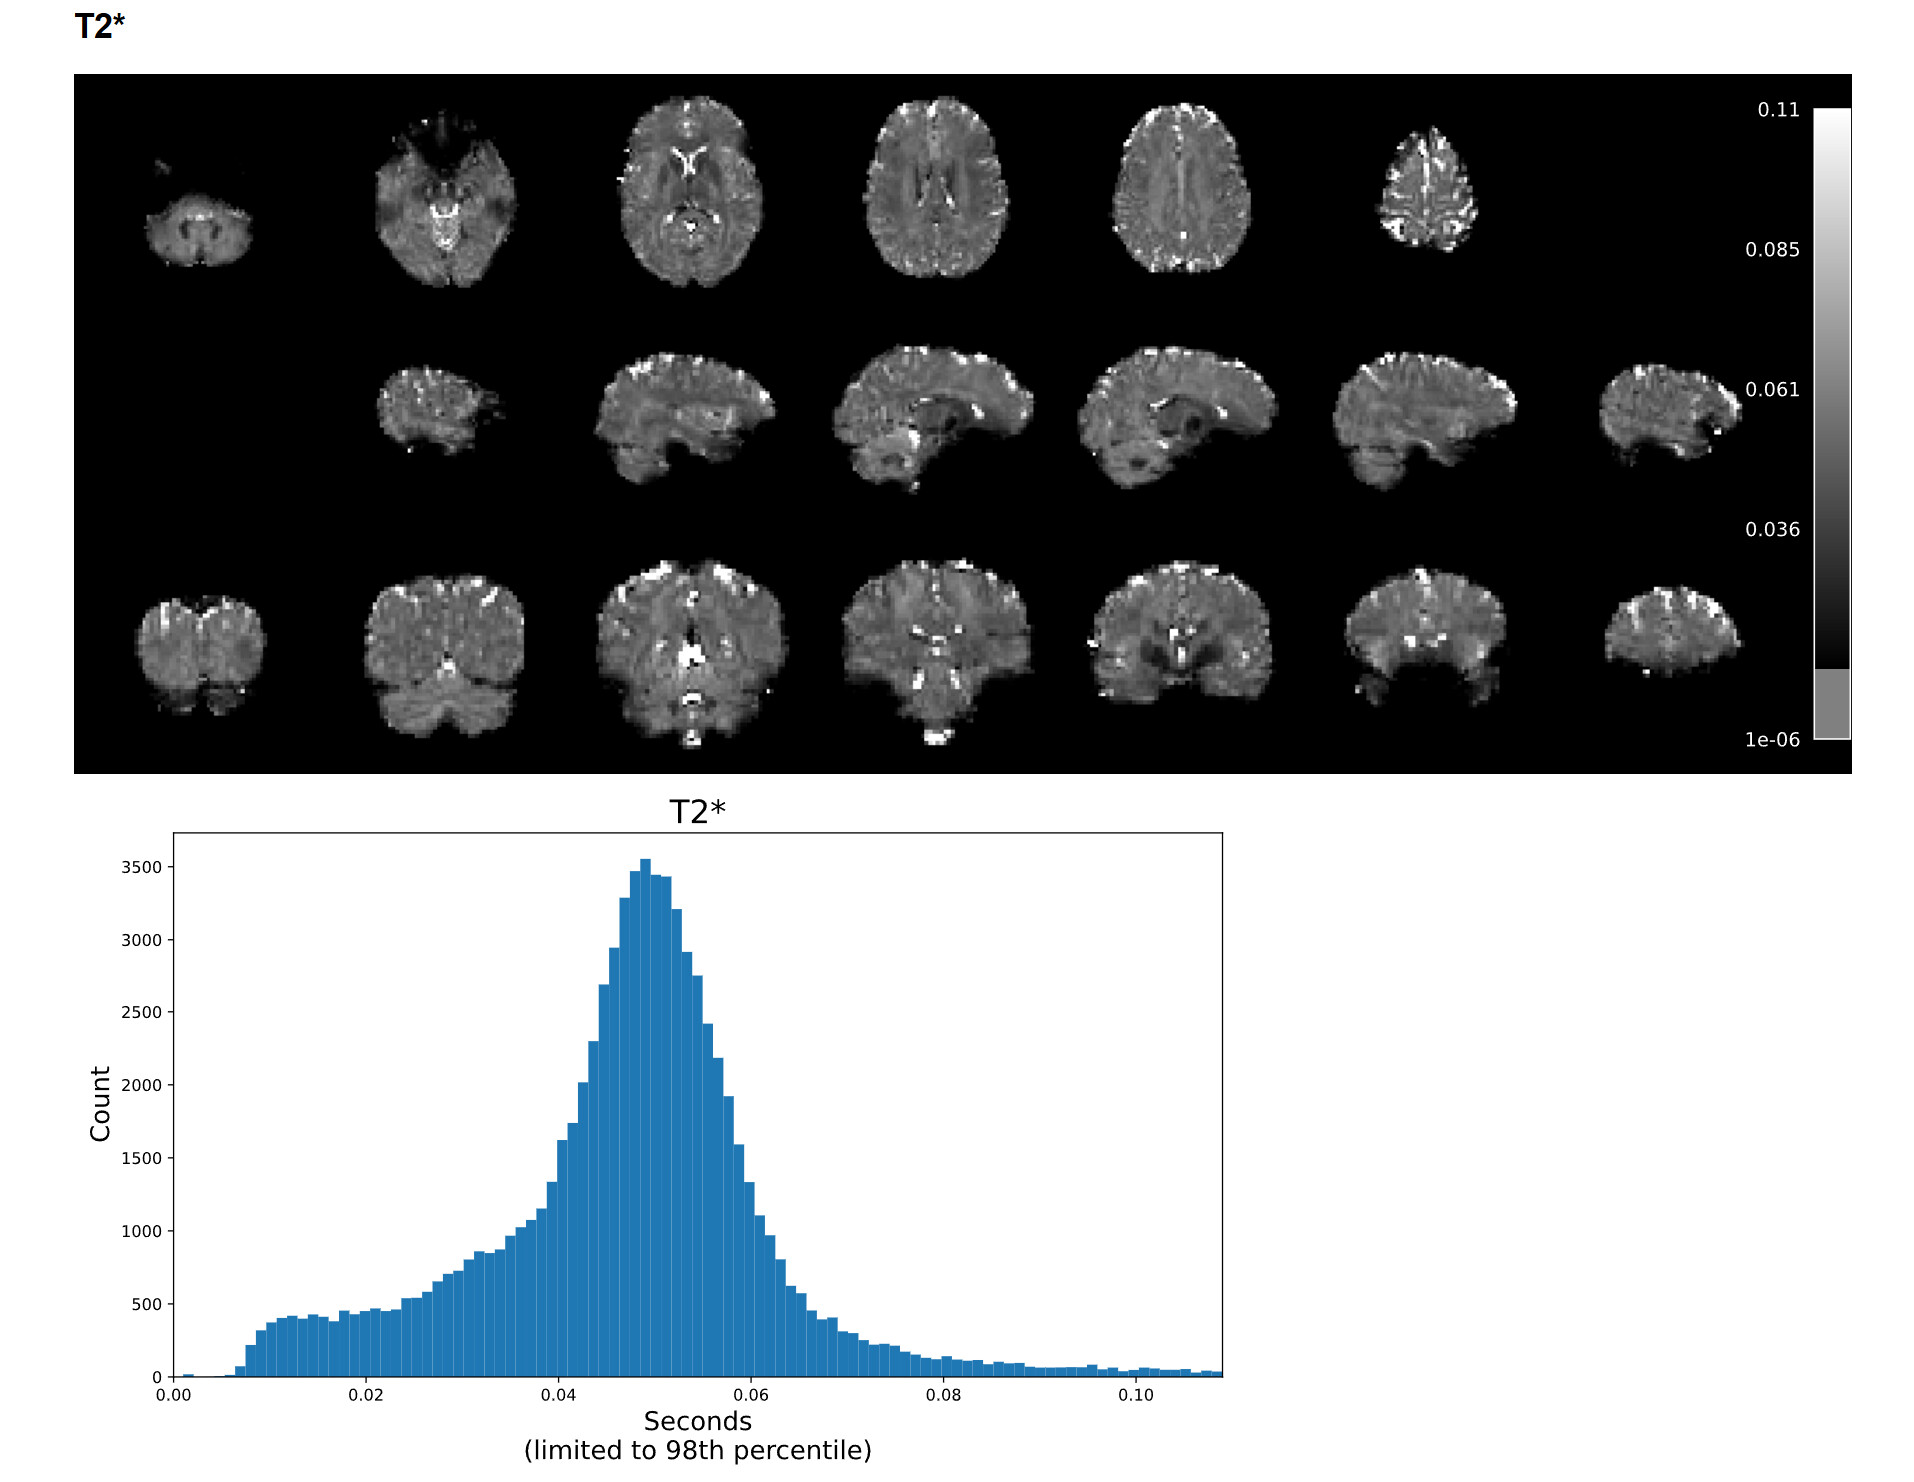
Example screenshot of a T2* map created with tedana 24.0.1 with a max voxel value under 1:

Example screenshot of the same data’s T2* map created with tedana 26.0.1 with a max voxel value of 9 and a limited range of low values.
Thanks for the help!
Sincerely,
Keith G. Jones