Tedana denoised BOLD data produces worse classifier accuracy than fMRIPrep combined data

Hi All!

We are using tedana to optimally combine and denoise our multi-echo fMRI data in native scanner space, and subsequently warping each scan to the subject’s individual T1 space. Our preliminary analyses showed that tedana consistently resulted in higher temporal signal-to-noise ratio (tSNR) scores across all scans compared to our control condition (echoes directly combined by fMRIPrep without denoising, i.e., “no-tedana”). However, when running a three-category classifier analysis in the ventral temporal cortex (VTC), based on our localizer task, the tedana-denoised data unexpectedly resulted in slightly lower classification accuracy compared to the no-tedana data. This difference was statistically significant. Specifically, a paired t-test across subjects yielded the following:

  • t = -2.5493, p = 0.0135
  • Tedana Mean Accuracy: 75.81%
  • No-Tedana Mean Accuracy: 77.90%
  • Difference: 2.09%

For most subjects, classifier accuracies for both groups tend to range between 80-90%, but a subset of subjects brings the mean accuracy down to the mid-70s.

We are hoping to get some feedback on potential reasons for this discrepancy. We assumed tedana’s denoising process would not remove meaningful signal or genuine patterns of neural activity. Is it possible that the ICA algorithm in tedana is optimized primarily for maximizing tSNR, potentially at the expense of other metrics such as pattern discriminability or classification accuracy?

For additional context, we used the AIC method for component selection in TEDPCA and FastICA as our ICA method. We are currently re-running the analysis using alternative component selection methods (MDL, Kundu, Kundu-stabilize) and the robustICA method for ICA. Preliminary results from these alternative approaches suggest a similar pattern.

Any thoughts or insights would be greatly appreciated!

Thanks in advance!

Hi there,

It sounds like you used the minimal decision tree provided by tedana. If that is the case, it will be very conservative and will only remove ICA components that it is confident are noise or artifacts. So, it should not have removed any meaningful signal but the decision tree is not perfect. It is always a good idea to have a quick look at the component classification using the tedana-provided report or Rica.

In any case, it could definitely be the case that your classifier is learning something from components that tedana removes from the signal. It really depends on how you are training said classifier and whether it is learning shortcuts.

I personally don’t think that tinkering the different tedana parameters will give you a boost in accuracy. I would try to compare the classification of a couple of subjects that have a lower accuracy with others that have a higher one, and see what differences you can spot in the accepted components. Likewise, I would compare the optimally combined and the tedana-denoised data for a couple of subjects that have the highest disparity in accuracy.

Just to confirm, did you use exactly the same data split and seeds to train your optimally combined-based and tedana-based classifiers?

Best,

Eneko

tedana will always increase TSNR. Any method that removes signal variance will increase TSNR. You can multiple your data by 0 and get infinite TSNR. TSNR is a useful measure for how much signal you remove, but, seeing how it affect classification accuracy, like you’re doing here, is a much better measure of efficacy.

For the bigger Q, I’ll start with the pro-tedana theory, which is there is a task condition variation in the noise (i.e. people move their heads more or alter their breathing for one type of stimulus, but not another). If that is the case, tedana might be appropriately removing noise and appropriately reducing accuracy.

Beyond that I don’t think any of the distributed decision trees are perfect. tedana_orig (the default) and kundu both include a lot of decision criteria with arbitrary thresholds and can reject good components. This is a core reason tedana_reports.html is always created & is a way to look for problematic decisions. In practice, the minimal decision tree should be more stable, but it does reject things that are accepted by the other included decision trees. minimal relies more directly on the kappa and rho elbow thresholds (the dashed lined in the scatter plots in the report. ( Outputs of tedana — tedana 24.0.2 documentation ). The elbows should be at plausible inflection points in the line plots of sorted kappa & rho values. If accuracy drops in runs where the kappa elbow seems too high or the rho elbow seems too low, that could cause problems. Maybe you can share the reports of some runs with larger drops in accuracy.

Dan

Thank you very much for your informative comments @e.urunuela @handwerkerd !

First, I apologize for the length of this post—I wanted to thoroughly explore your suggestions before responding.

To address your initial questions: we are using a block design in our localizer task (3 runs), with 10 second category blocks being separated by 10 second fixation blocks. I don’t think our classifier can learn any shortcuts – we cross validate our accuracy results across 3 folds (train on run 1 and 2, test on 3; train on run 1 and 3, test on 2; etc.). Both the tedana and the no-tedana pipelines go through the same data split and seeds.

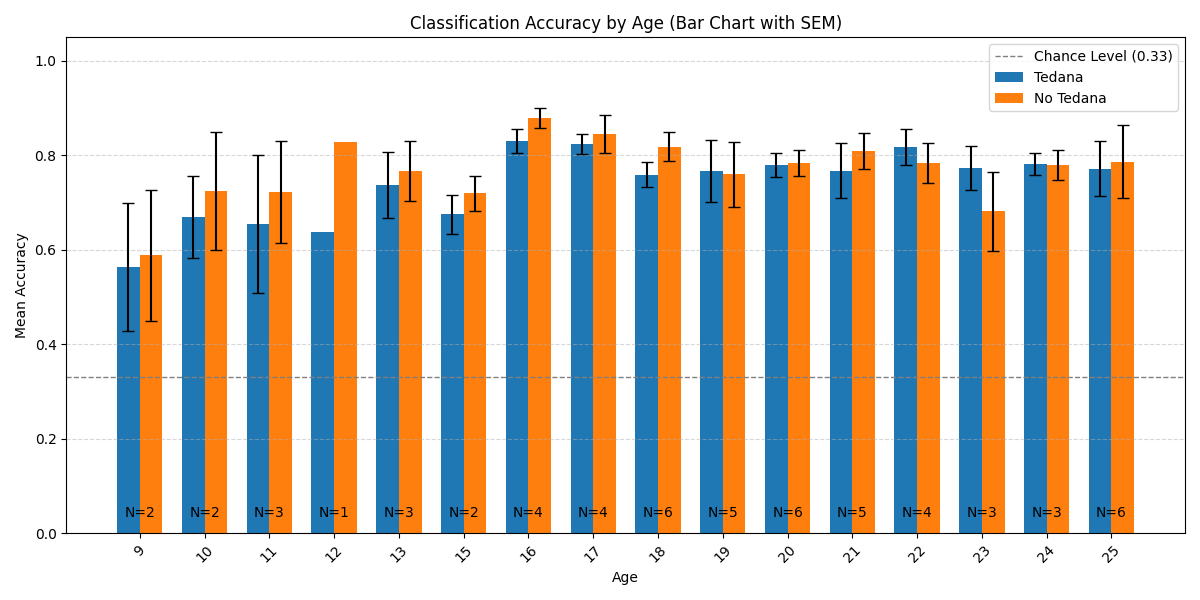
One thing I probably should have mentioned but didn’t in my original post, is that we are doing a developmental study (ages 8-25), thus our data includes children. After looking at the data more closely, what we ended up seeing was a suggestion that there is an age related effect on the difference in accuracy, which I previously overlooked.

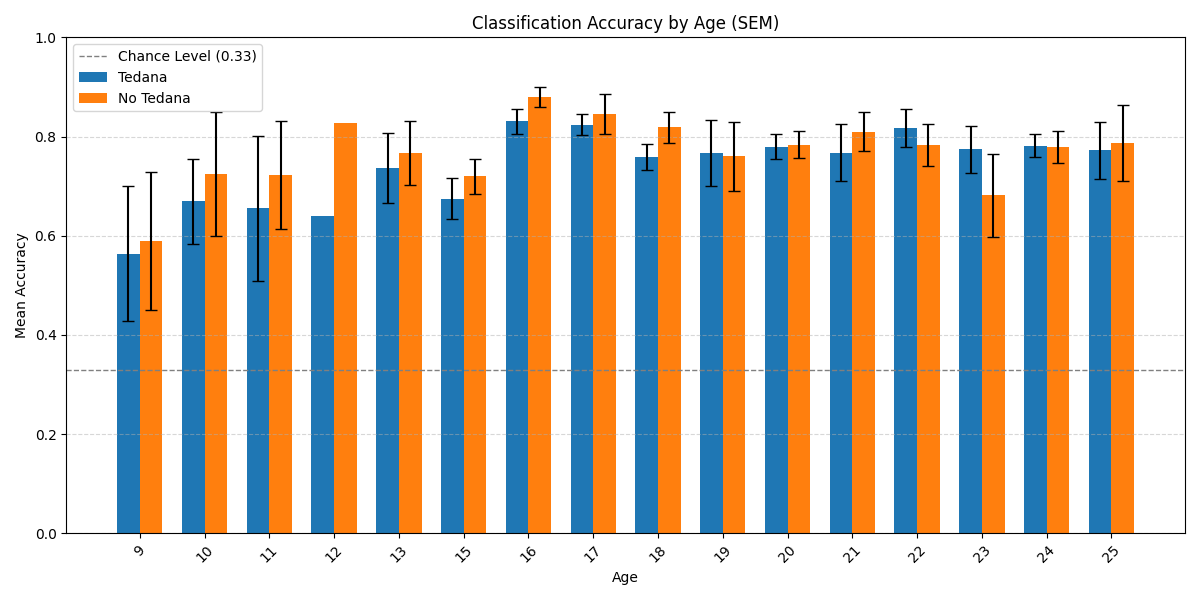
Here is the distribution of accuracy scores across ages:

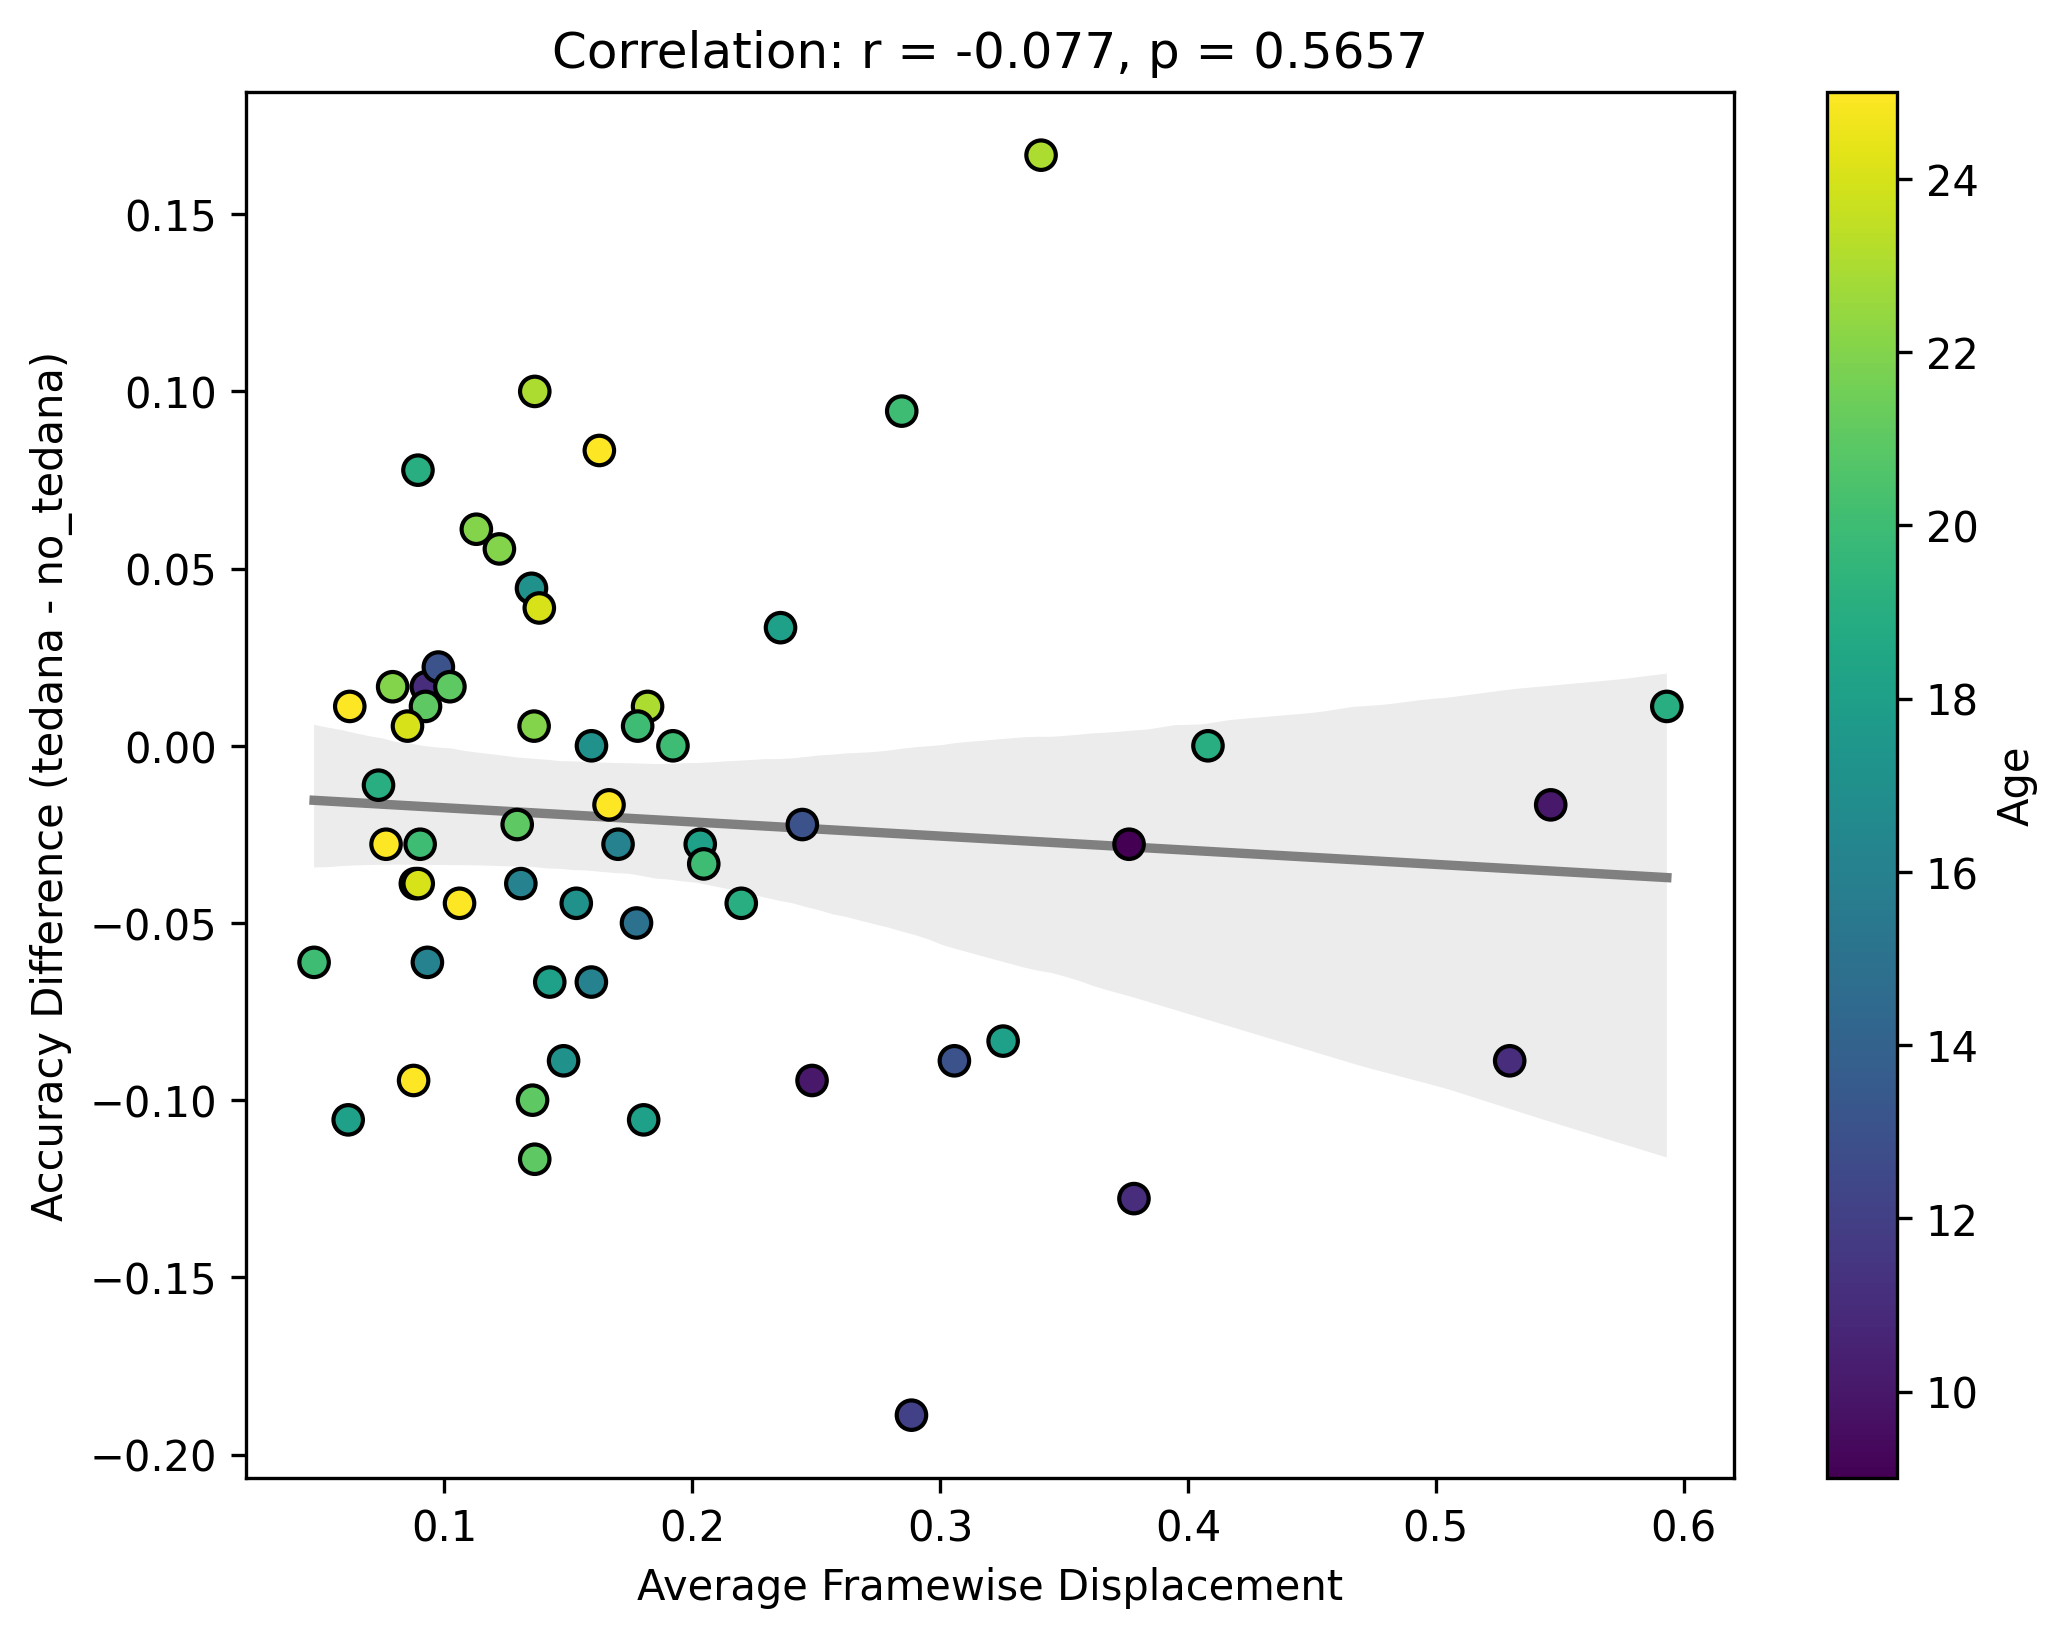
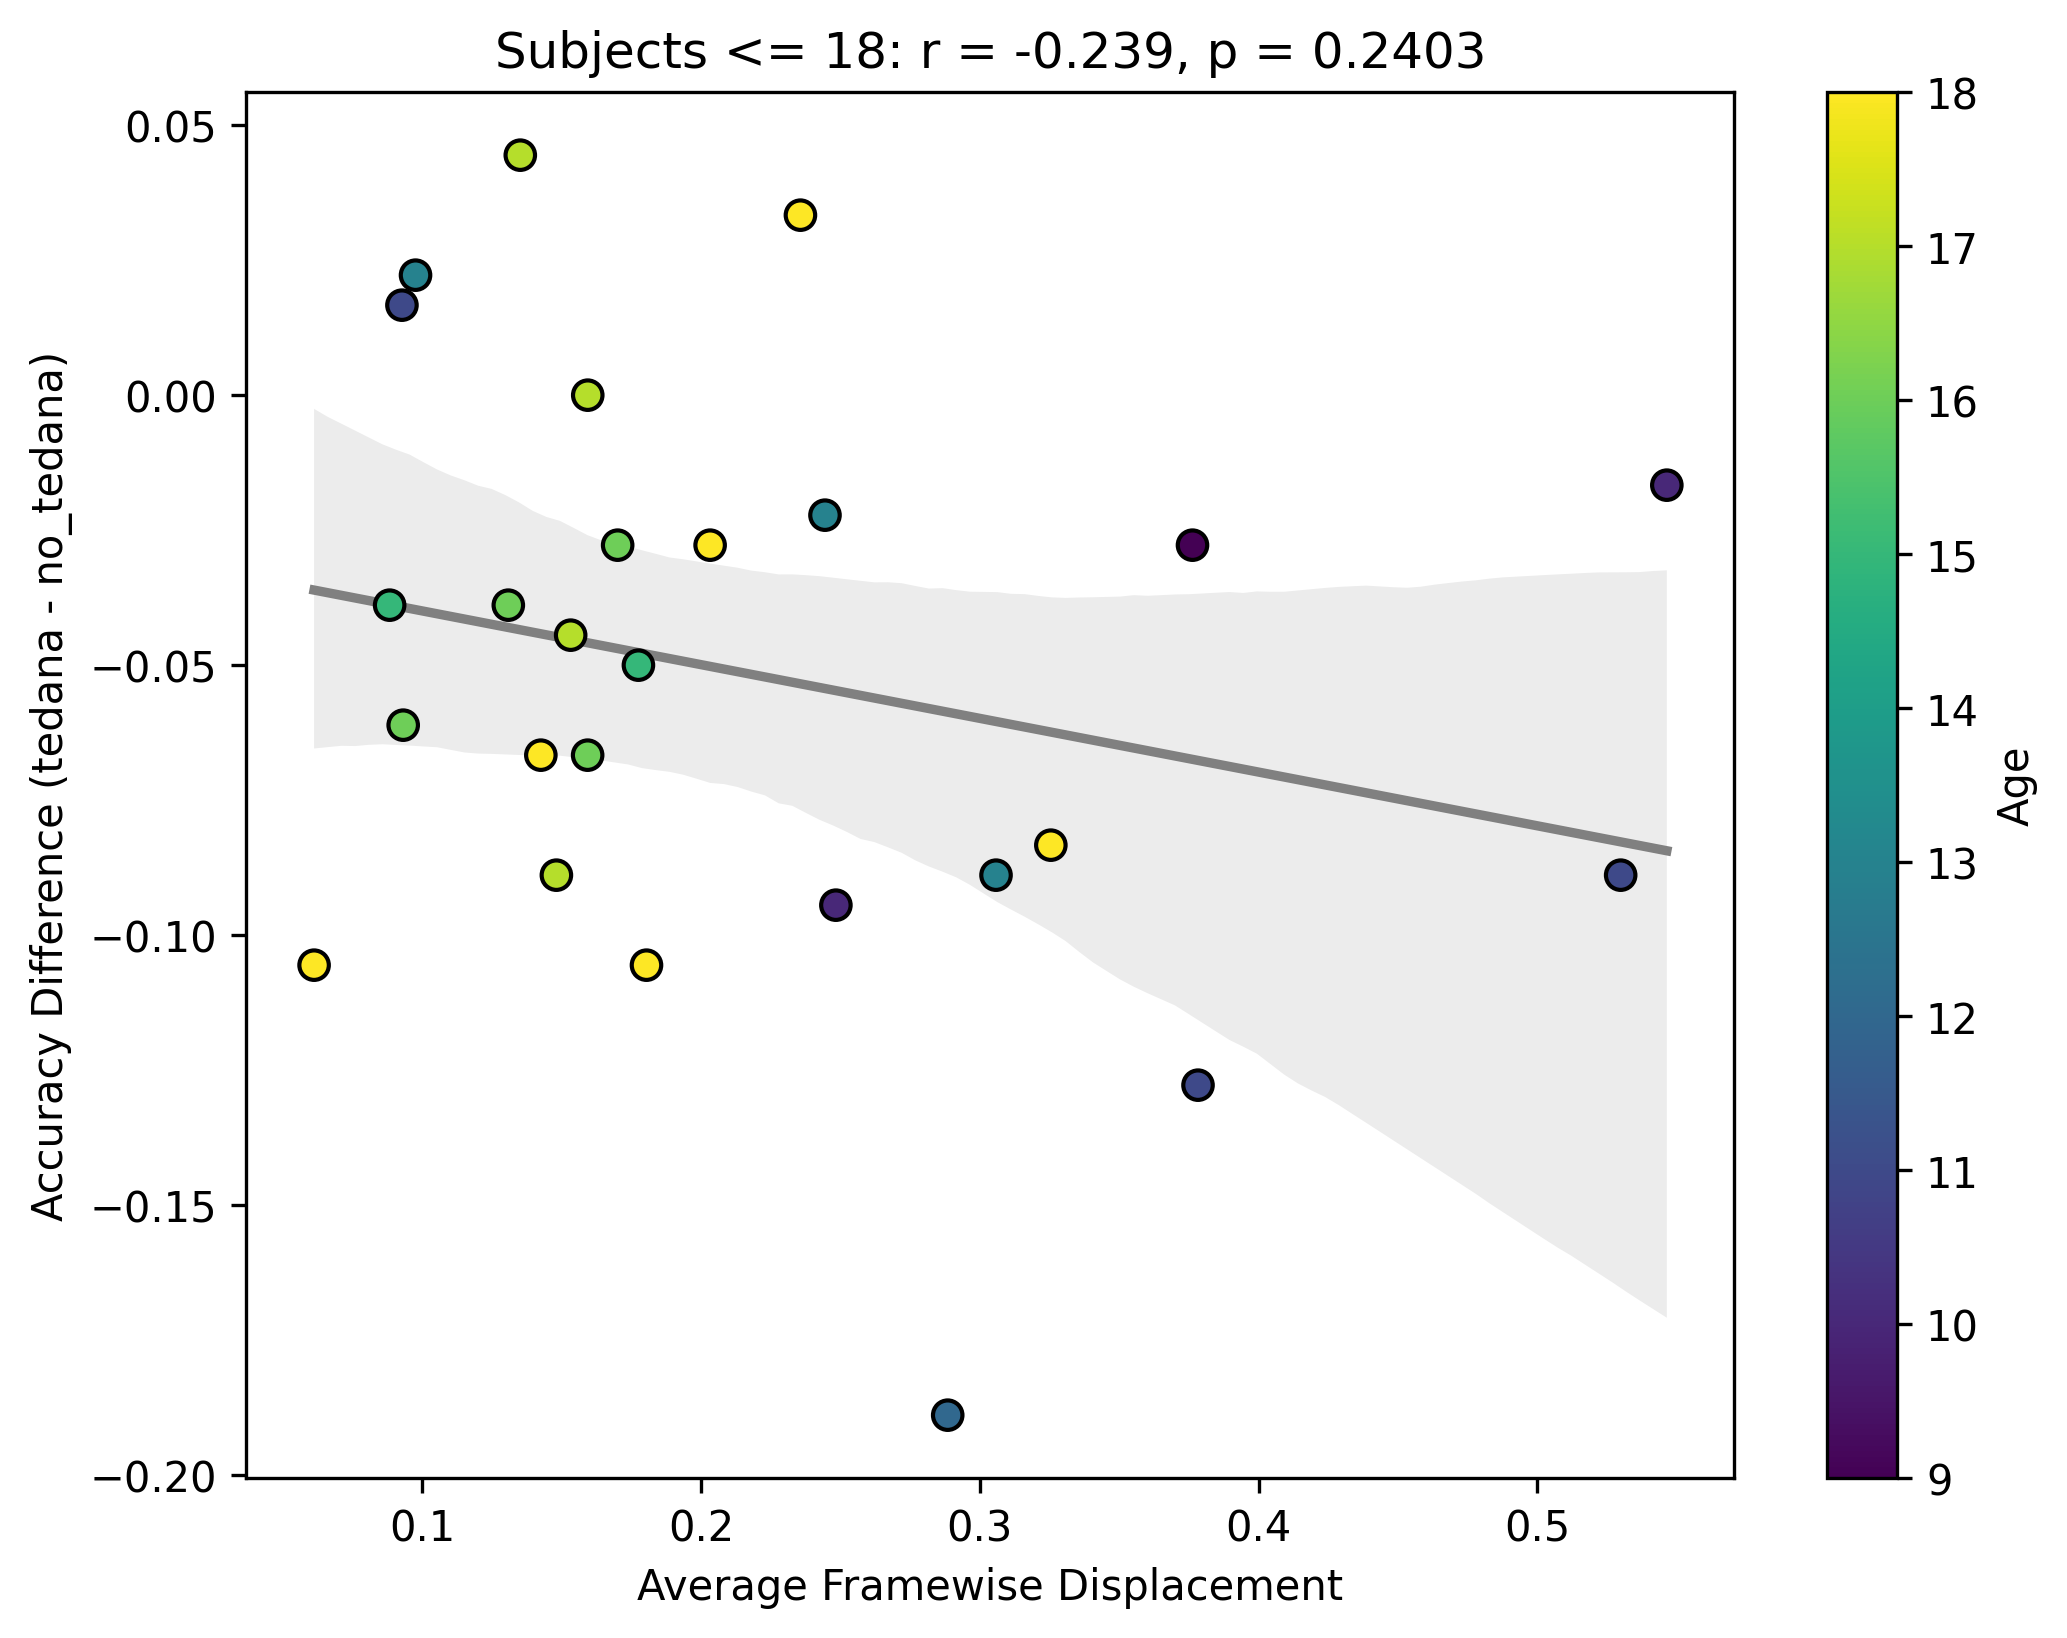
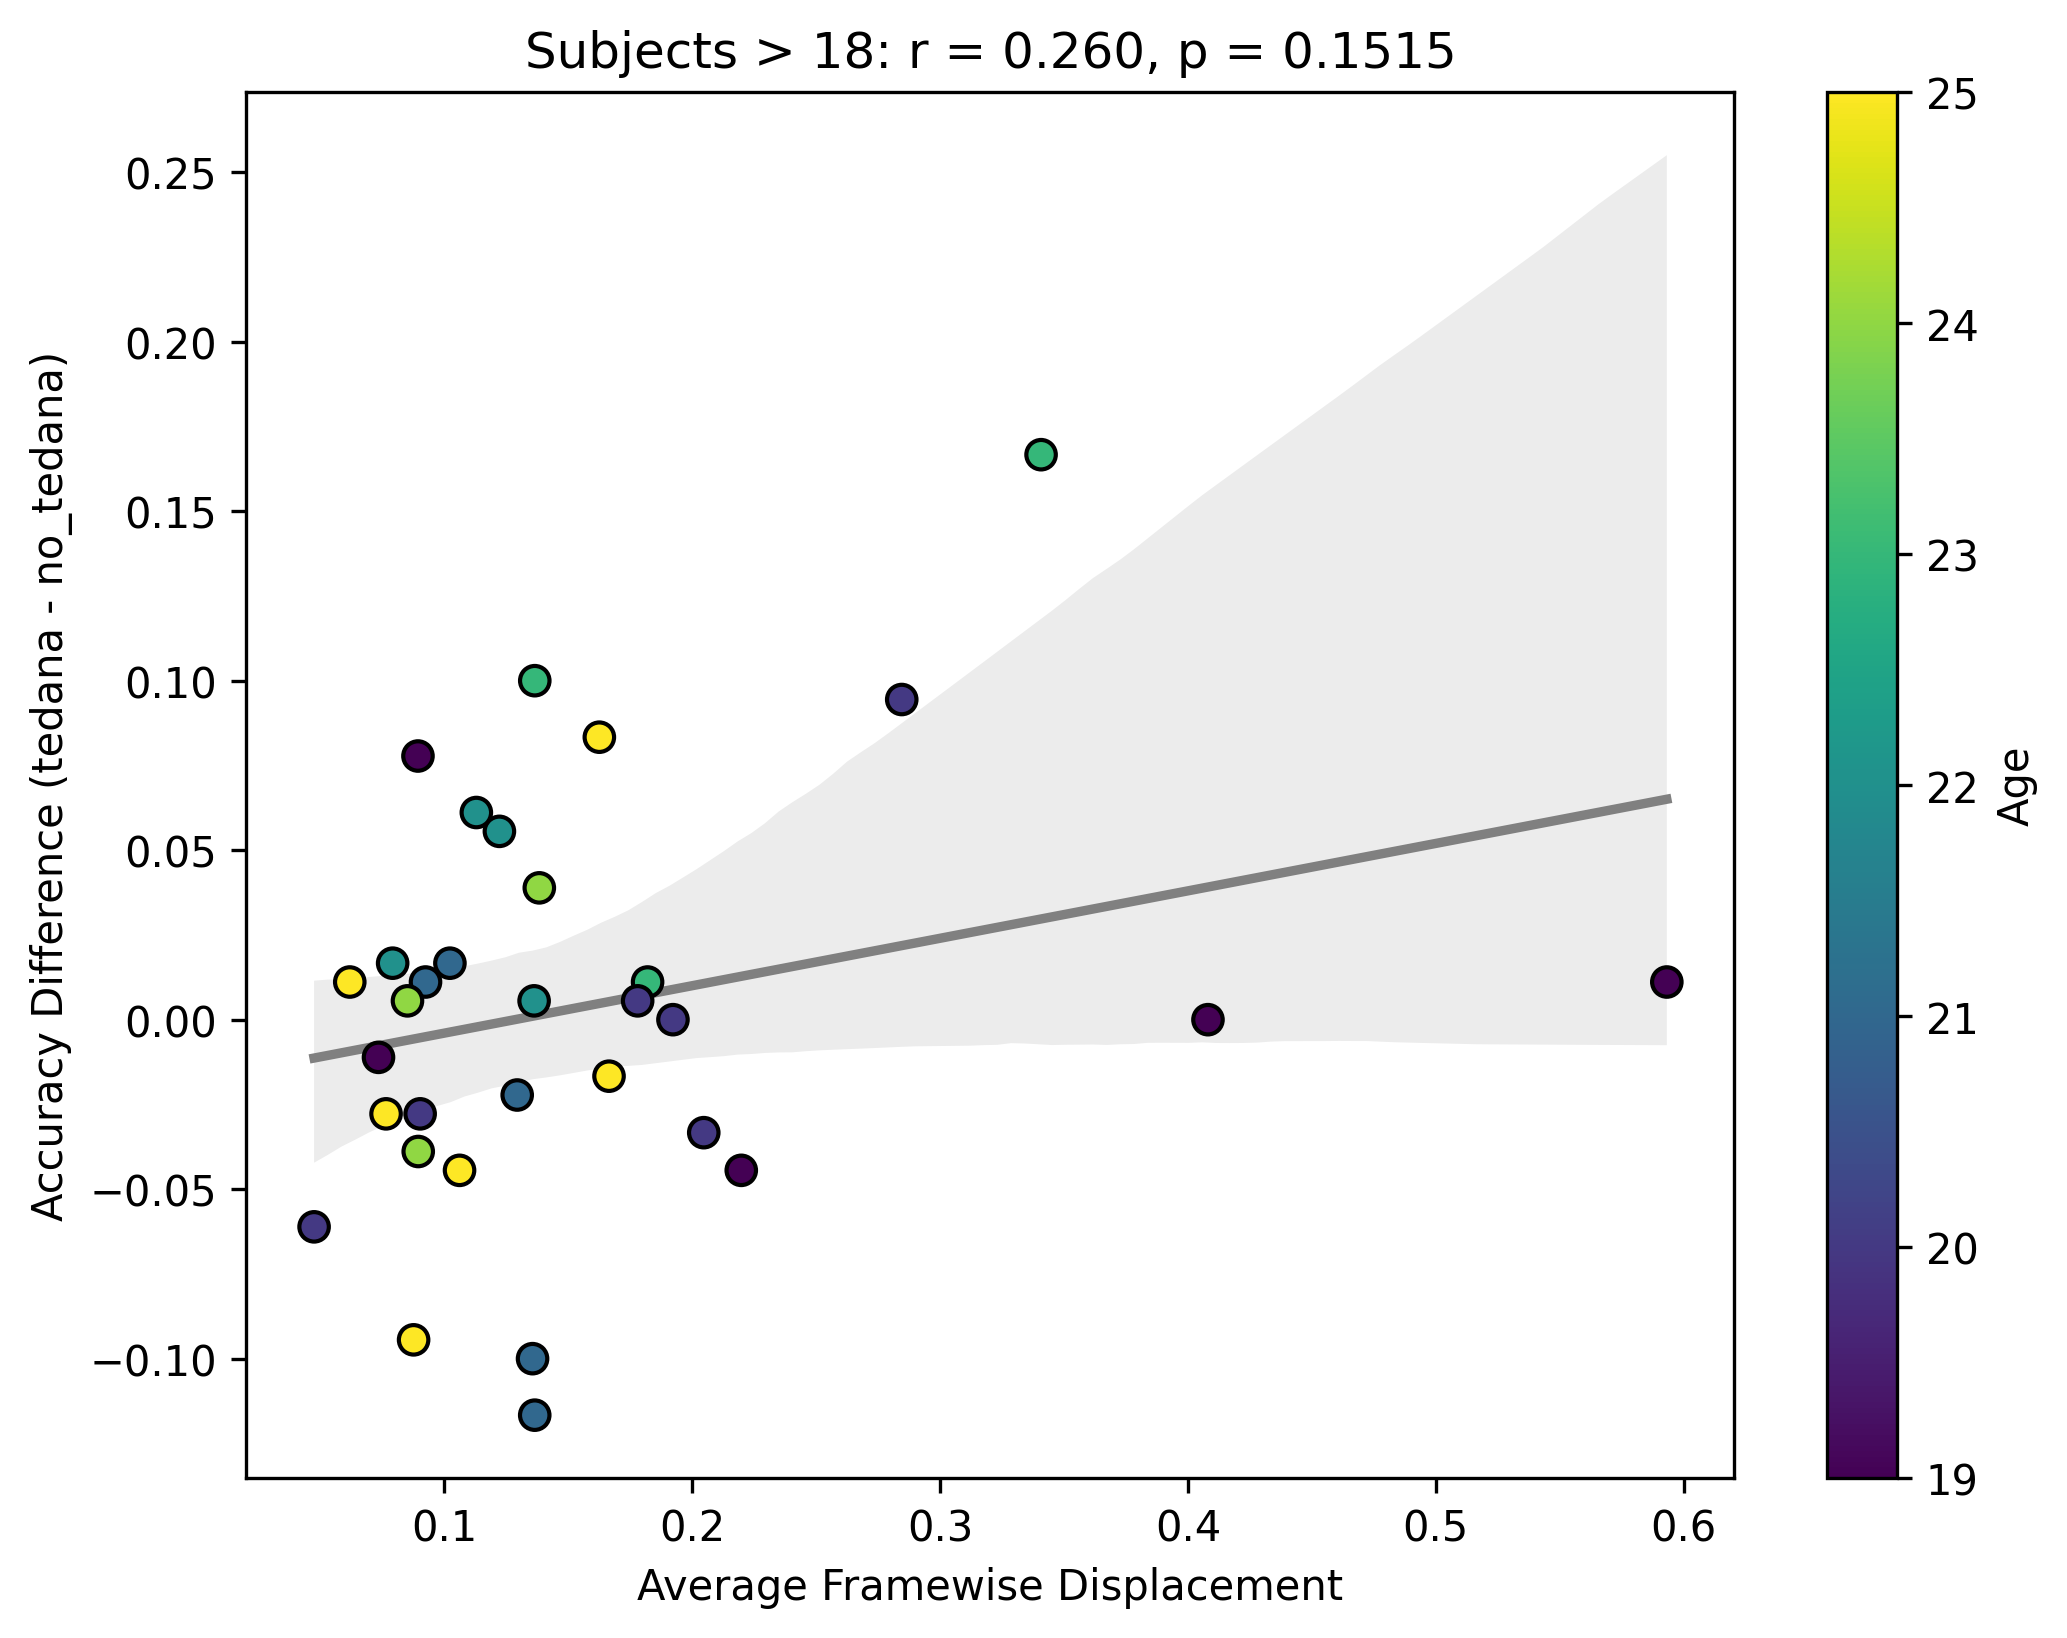
Looking closely you can see that tedana seems to consistently yield a lower accuracy in subjects aged 18 or less. We hypothesise this is due to children generally moving more in the scanner, so we ran a correlation between the subjects’ framewise displacements (average across all TRs of the 3 runs) and the accuracy difference, and found the following (FD vs Accuracy Difference):


N total: 59; N <= 18: 27; N > 18: 32

The correlations were not statistically significant, but aligned with the expected directions, at least for children. I think this might partially be due to the fact that we haven’t scanned enough children yet (especially aged 10 or lower), thus the effect is much weaker. In any case though, I guess it would be premature to say this is solely due to motion.

I ran a bunch of analyses correlating various statistics outputted by tedana with the difference between the tedana and no-tedana classifier accuracy, both at subject level and group level. Some of these analyses also suggested an age related effect.

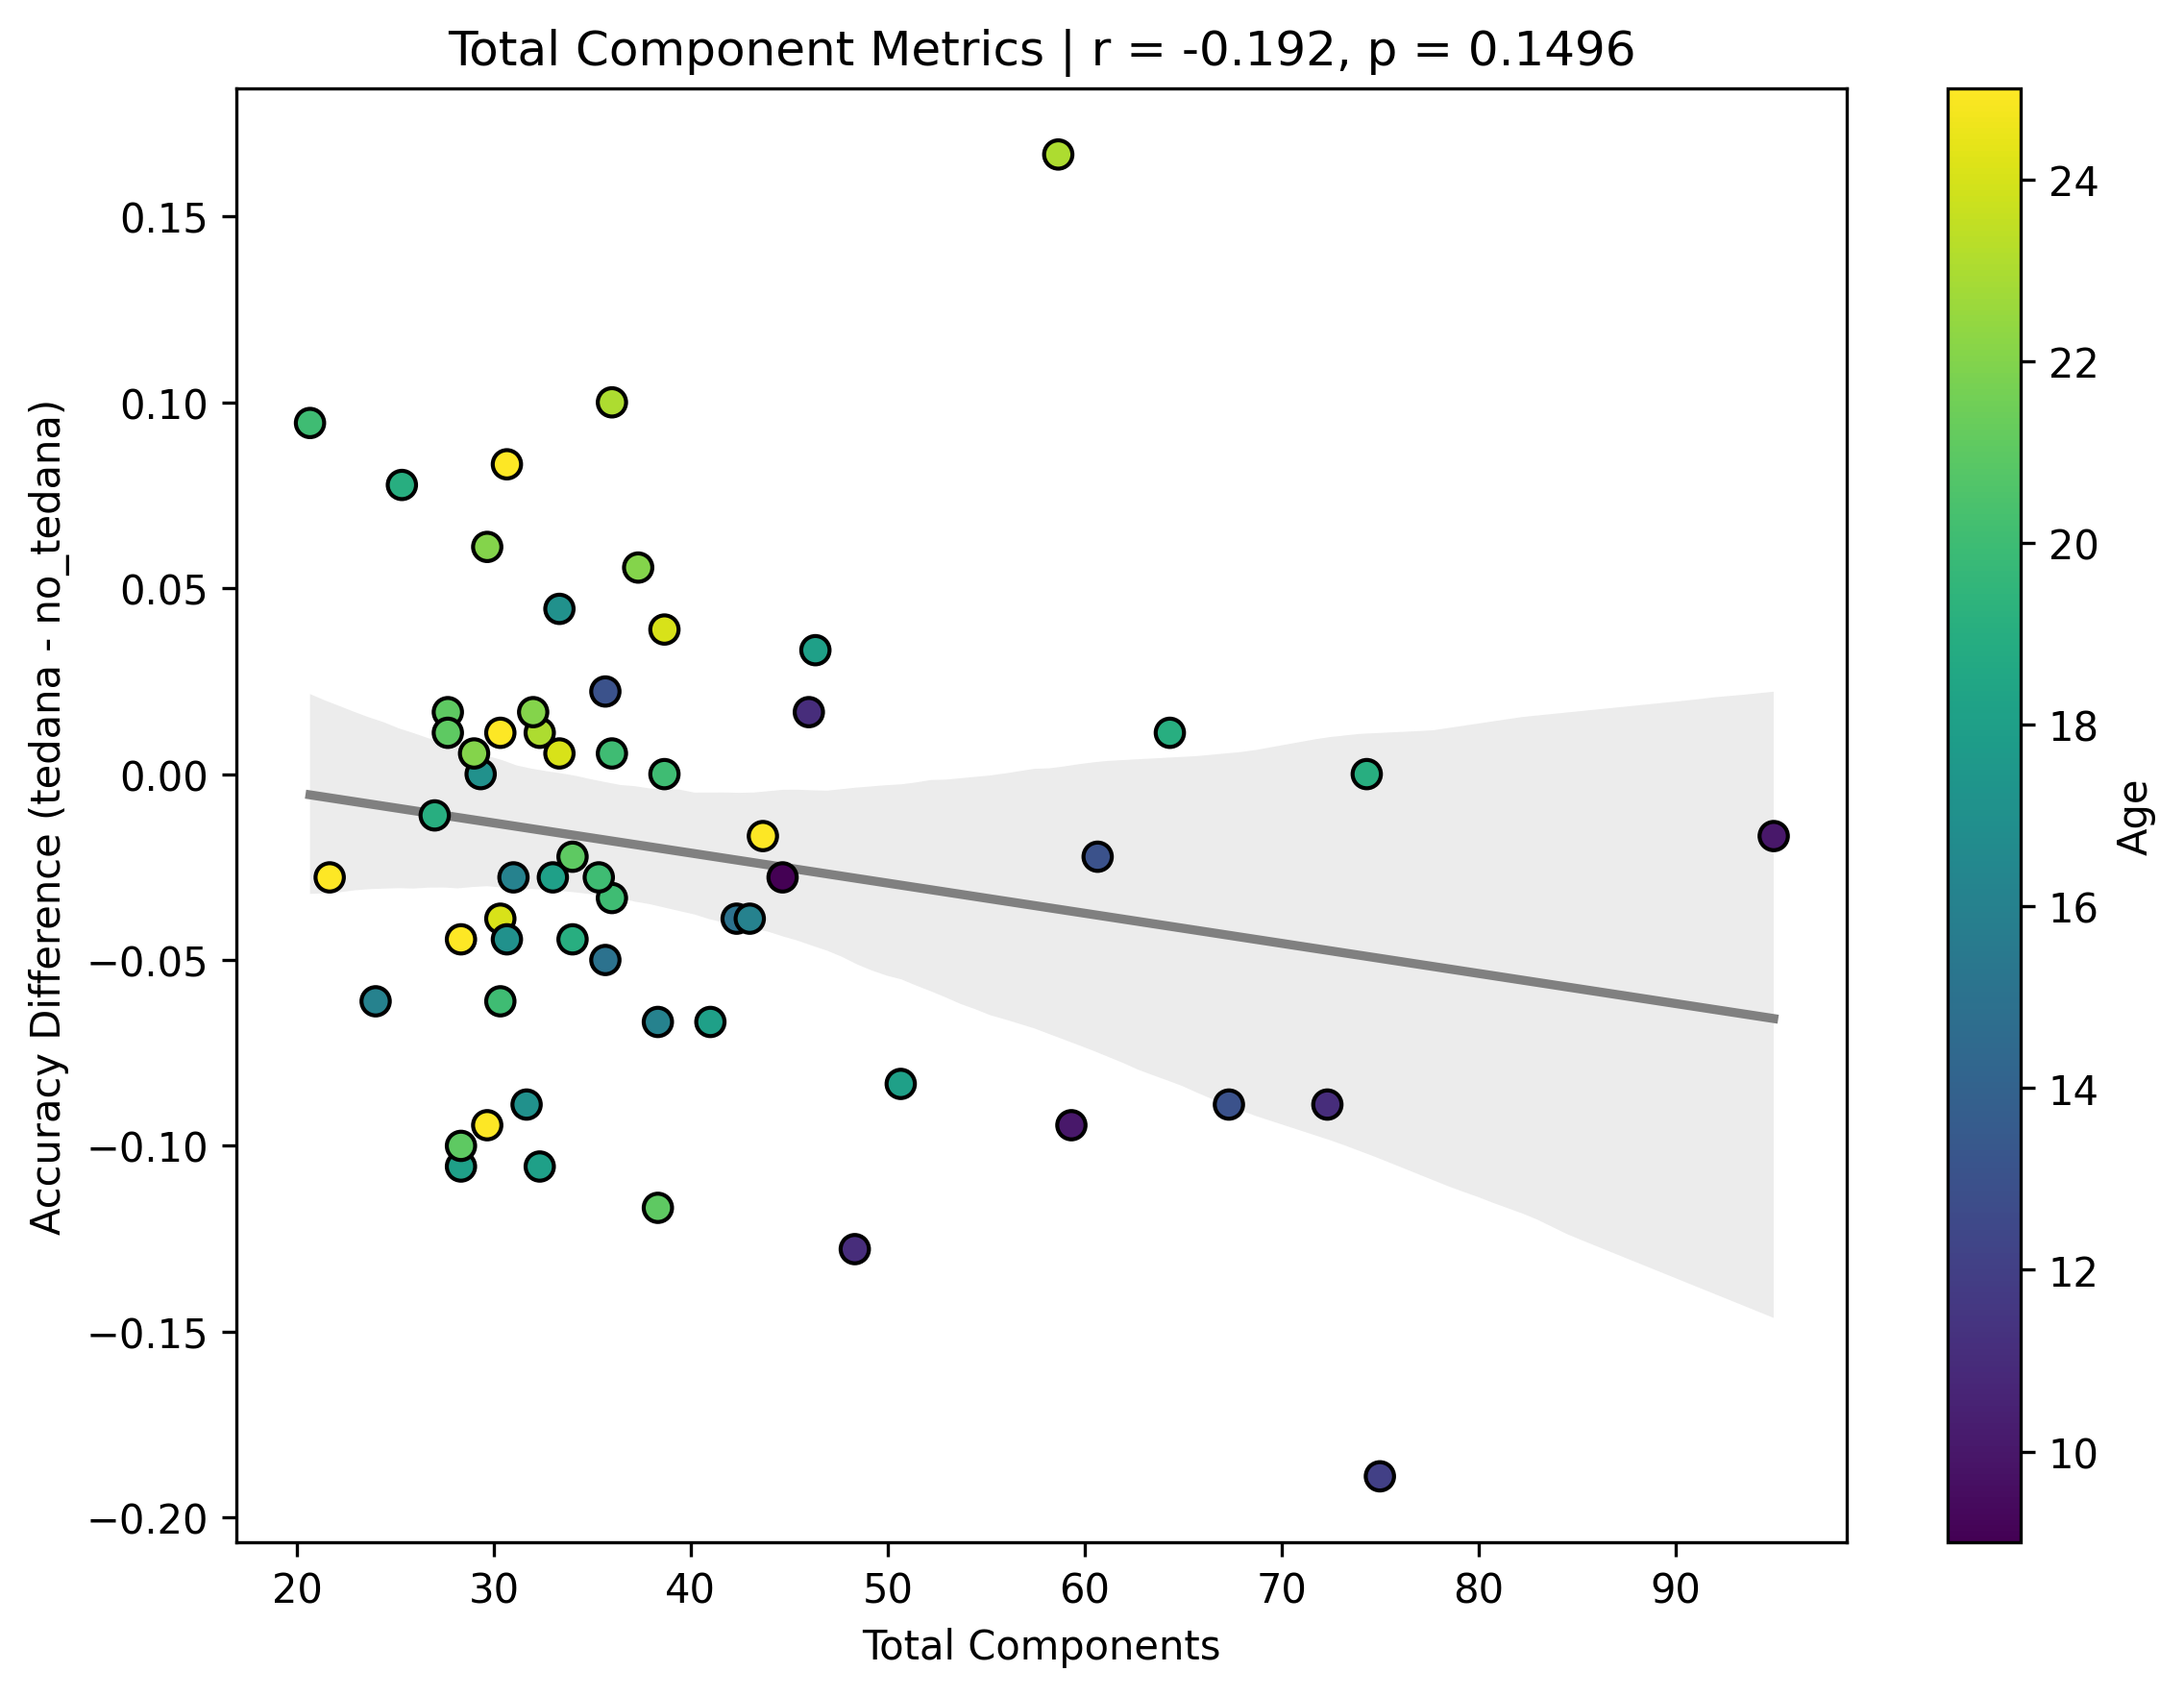
Firstly, it seems that the more components TEDPCA creates, the worse the difference becomes – and in general, more components are created in children. This effect is not significant, but to me it seems to be the main driver of the issues below:

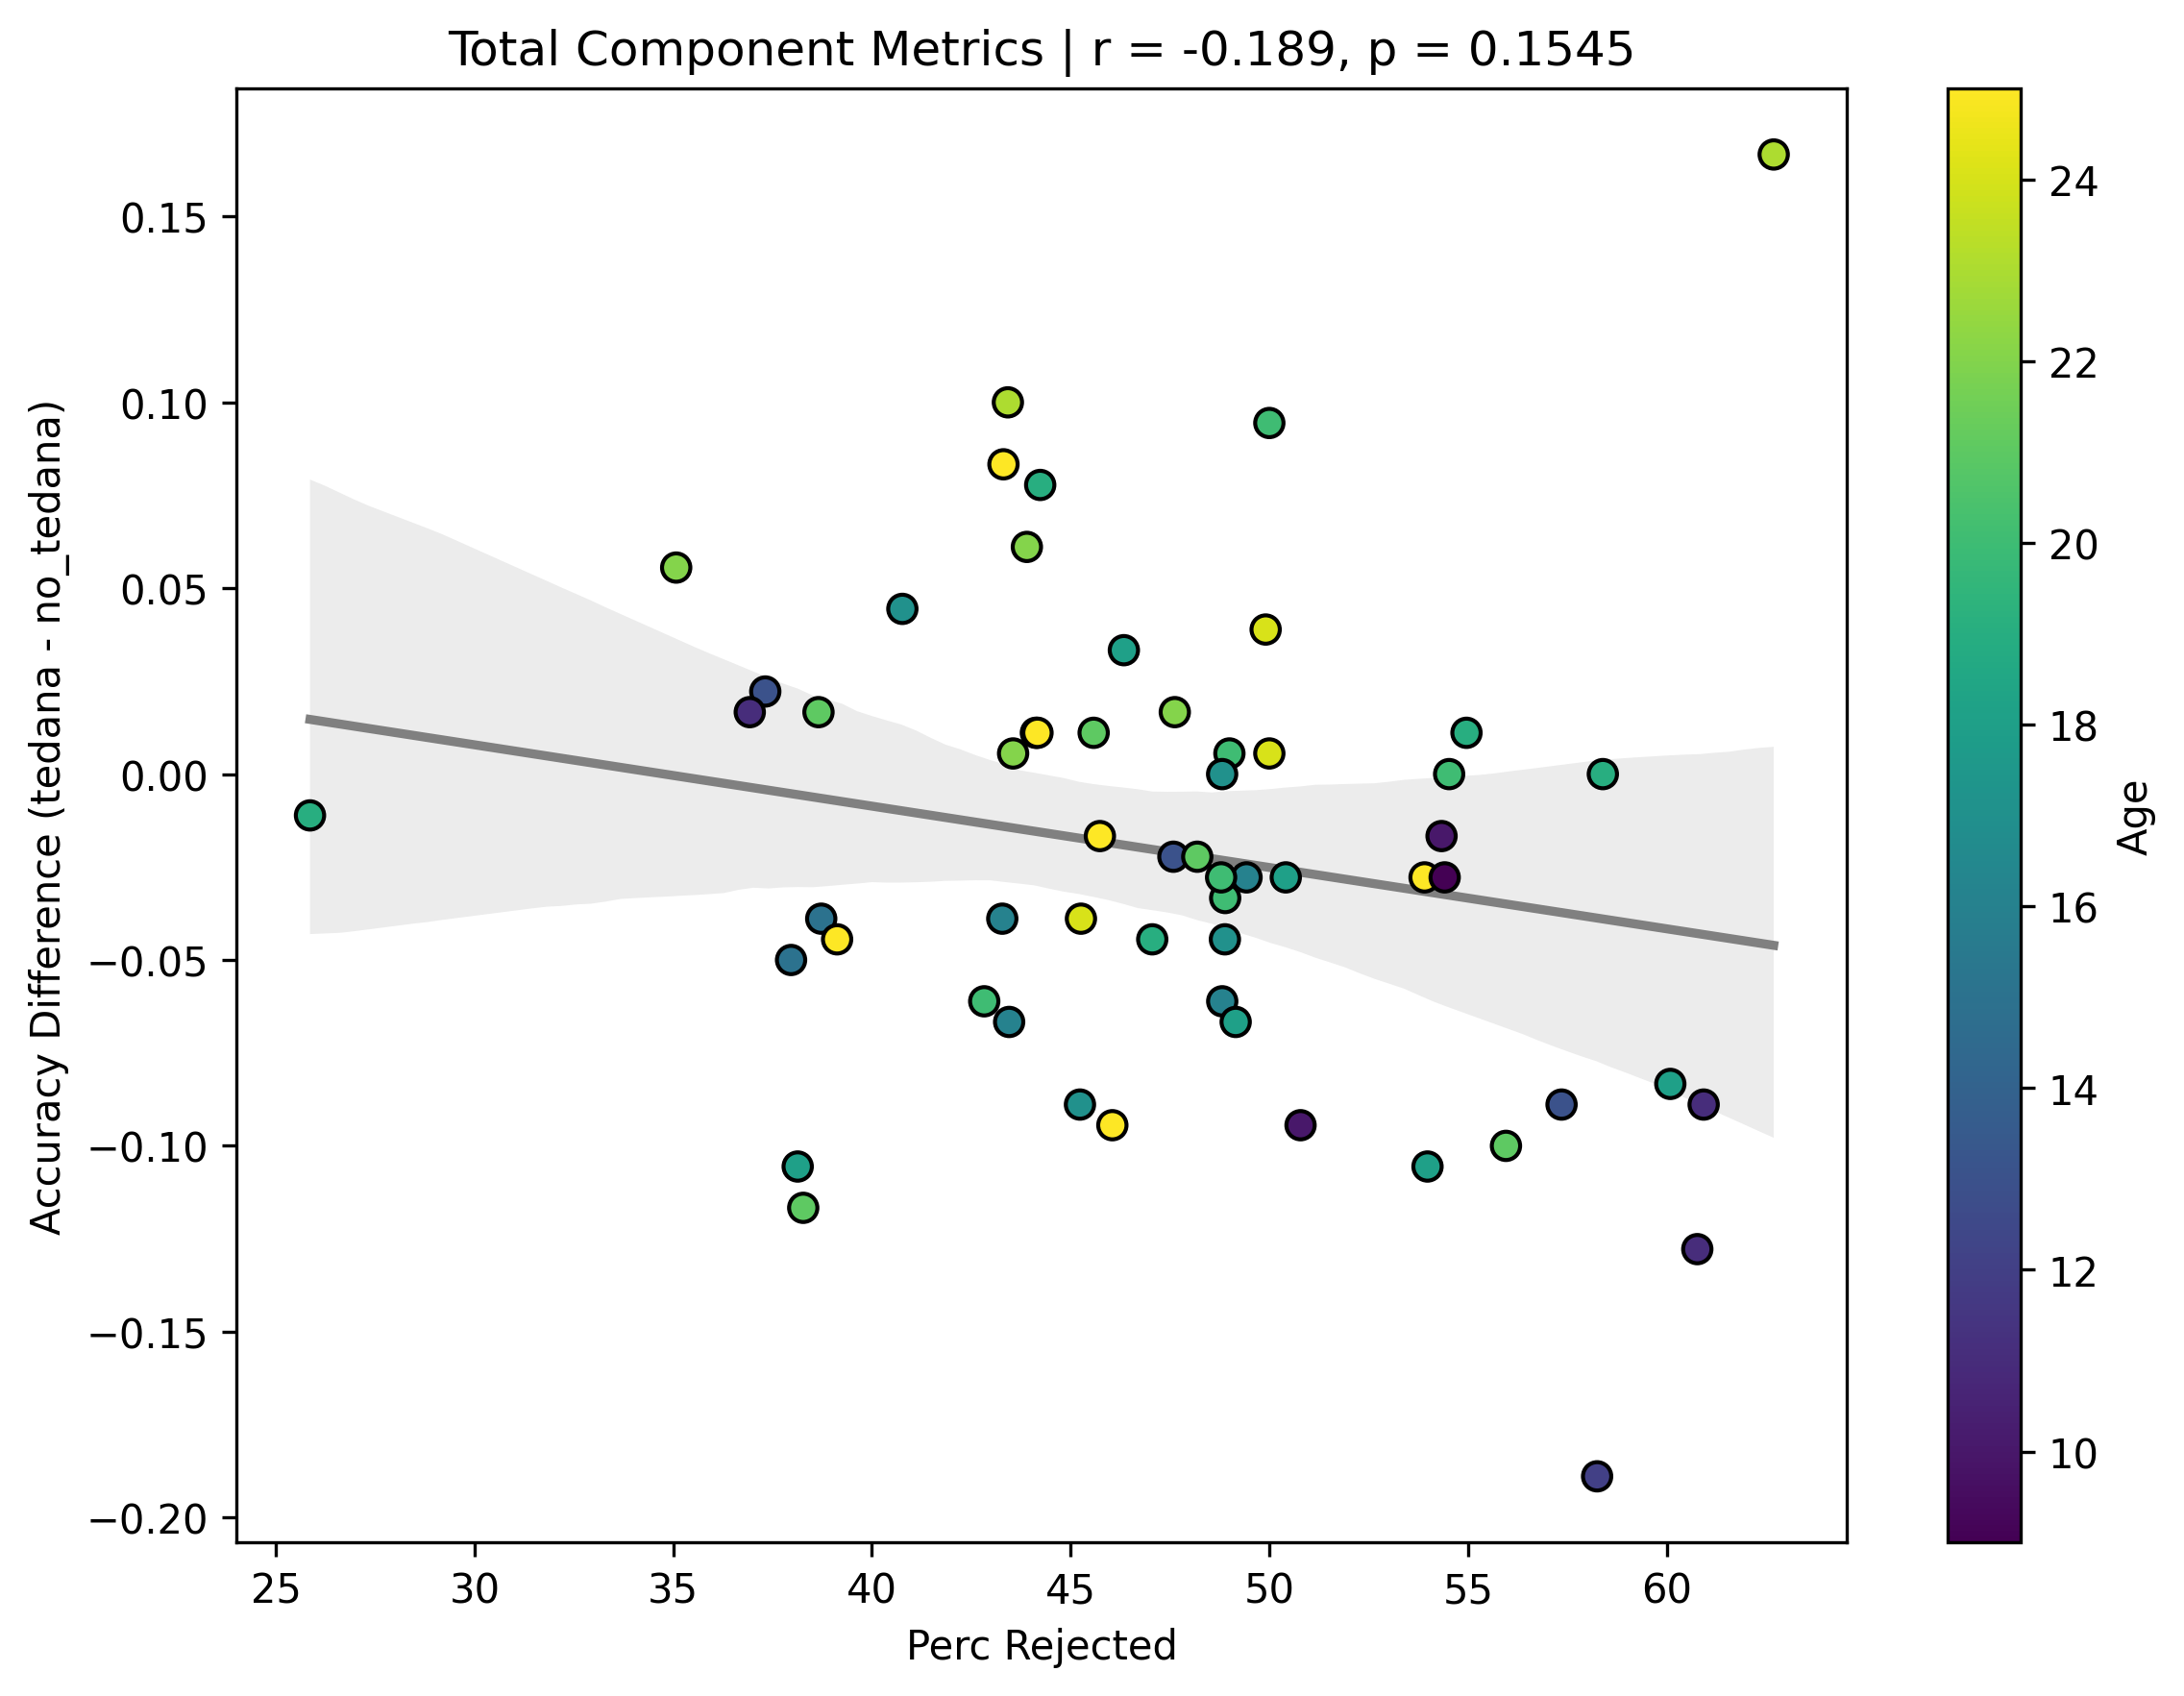
I then looked at percent accepted and percent rejected components (as opposed to raw values, since those would correlate with total amount of components created), and found that the bigger the proportion of rejected components is, the worse the difference – and kids seem to have a higher proportion of components being rejected. I’ll only attach the Percent Rejected vs Accuracy Difference plot here, since the percent accepted one would be identical but flipped.

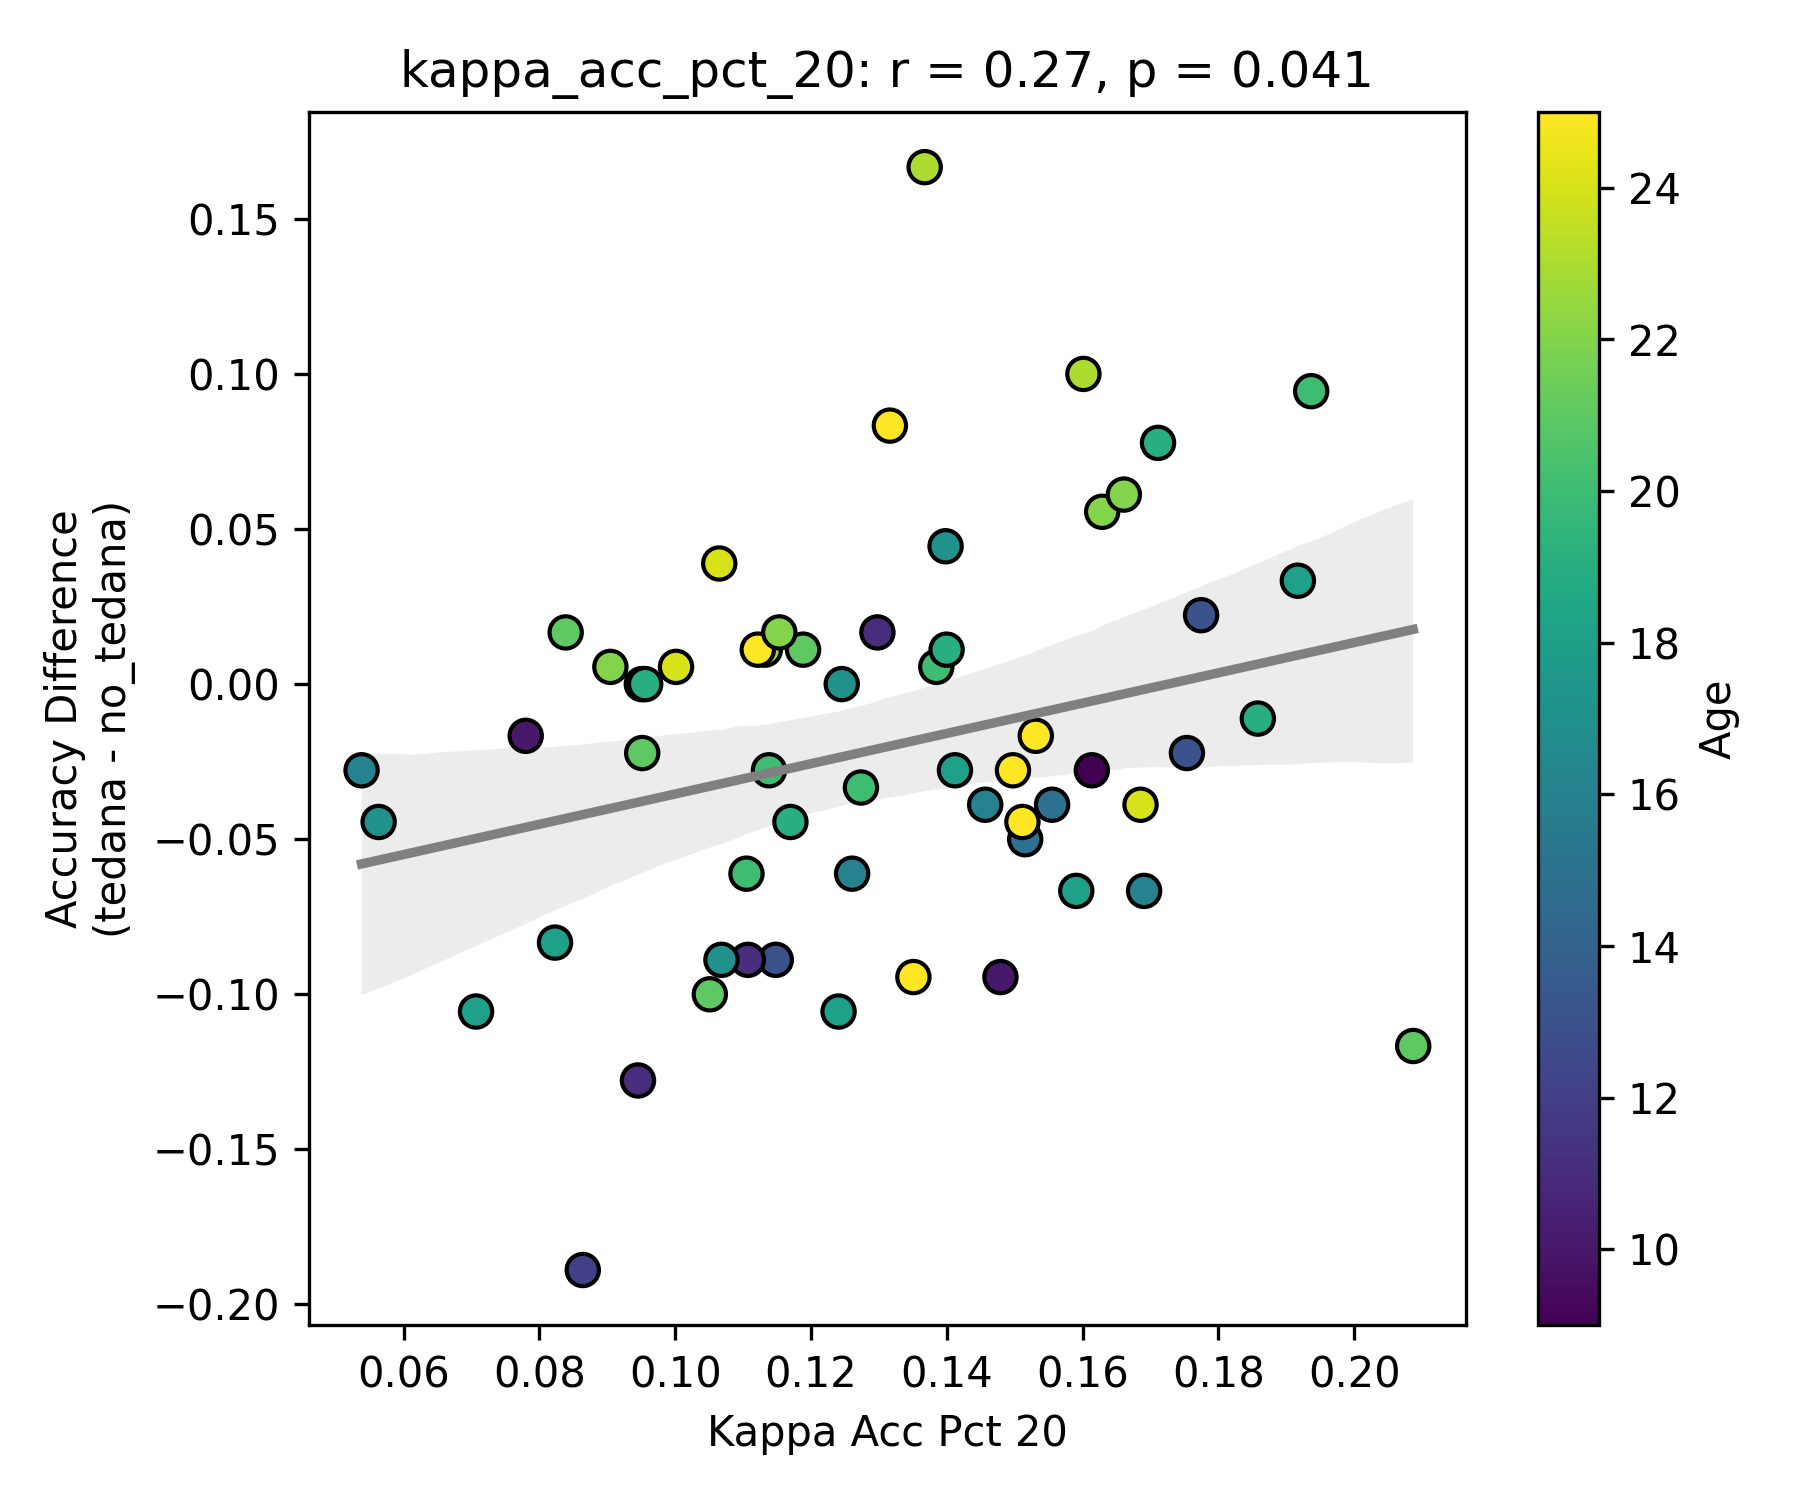
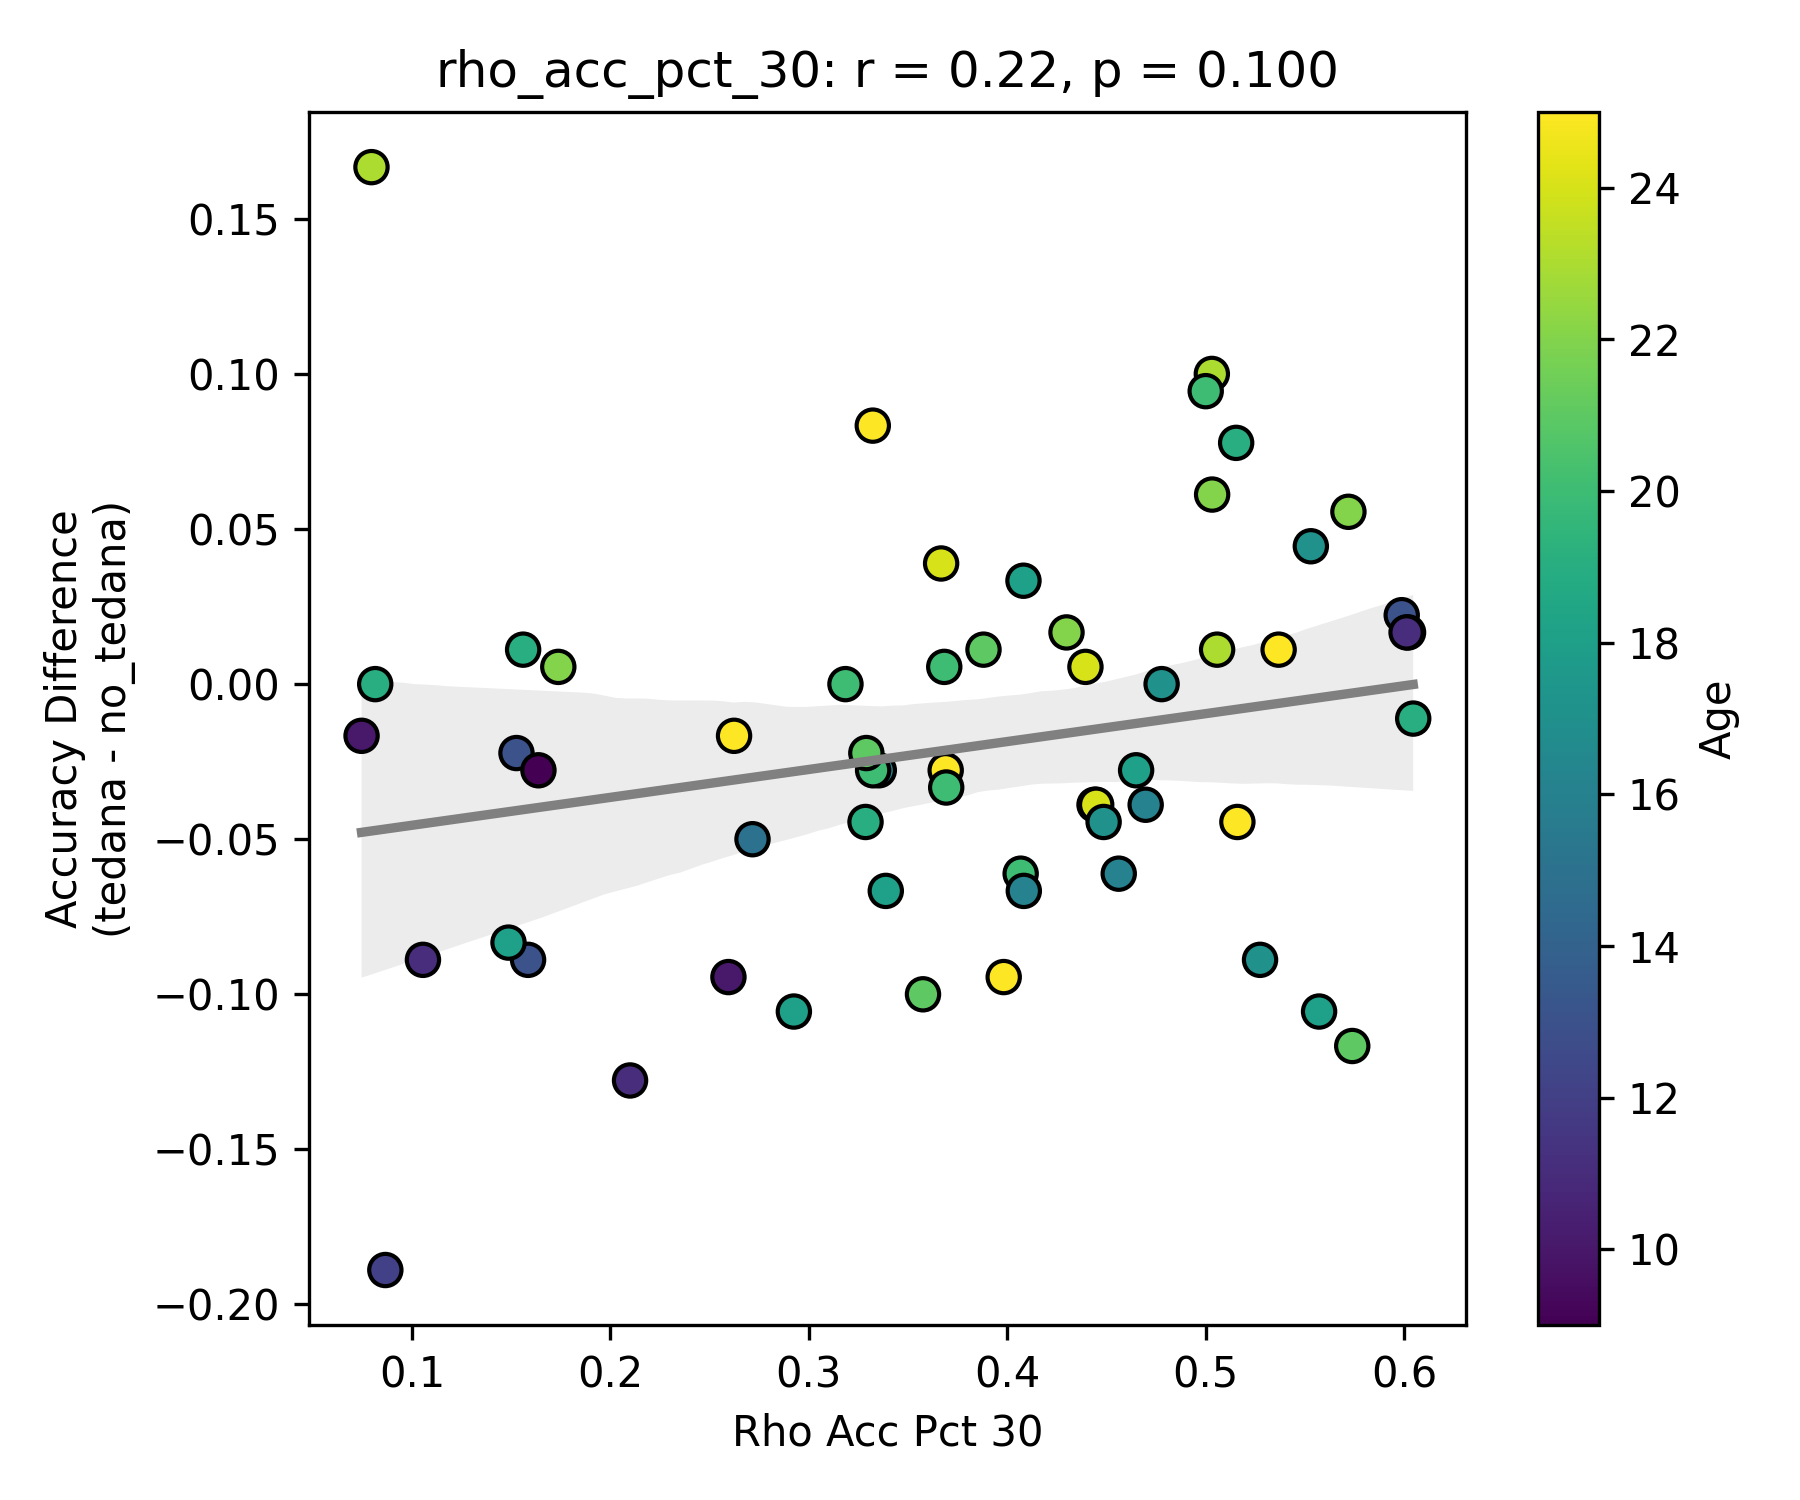
Visually inspecting some subjects’ reports, I found that that the subjects that have more components close to the Rho/Kappa elbows seem to give worse accuracy. So I though I would look at the number of total, accepted, and rejected components within 10/20/30% of the kappa and rho elbow values (the range netween the actual value multiplied by 0.9 and 1.1, 0.8 and 1.2, and 0.7 and 1.3), and used those values as percentages of total components - I computed, for each run, the fraction of components rejected (or accepted) within 10/20/30% of the kappa and rho elbows, then averaged those run‑level percentages to yield a per‑subject mean percentage that we correlate against accuracy difference. I switched to percentages because raw “count within X% of the elbow” will naturally be higher in runs or subjects that simply have more components overall, whereas a percentage (run‑level count / total components, then averaged across runs) normalises for each run’s size.

Please excuse me if this is a naive way of doing this type of analysis, I wasn’t sure how else I could capture the influence of the elbow values. From my understanding, it seems to have an effect.

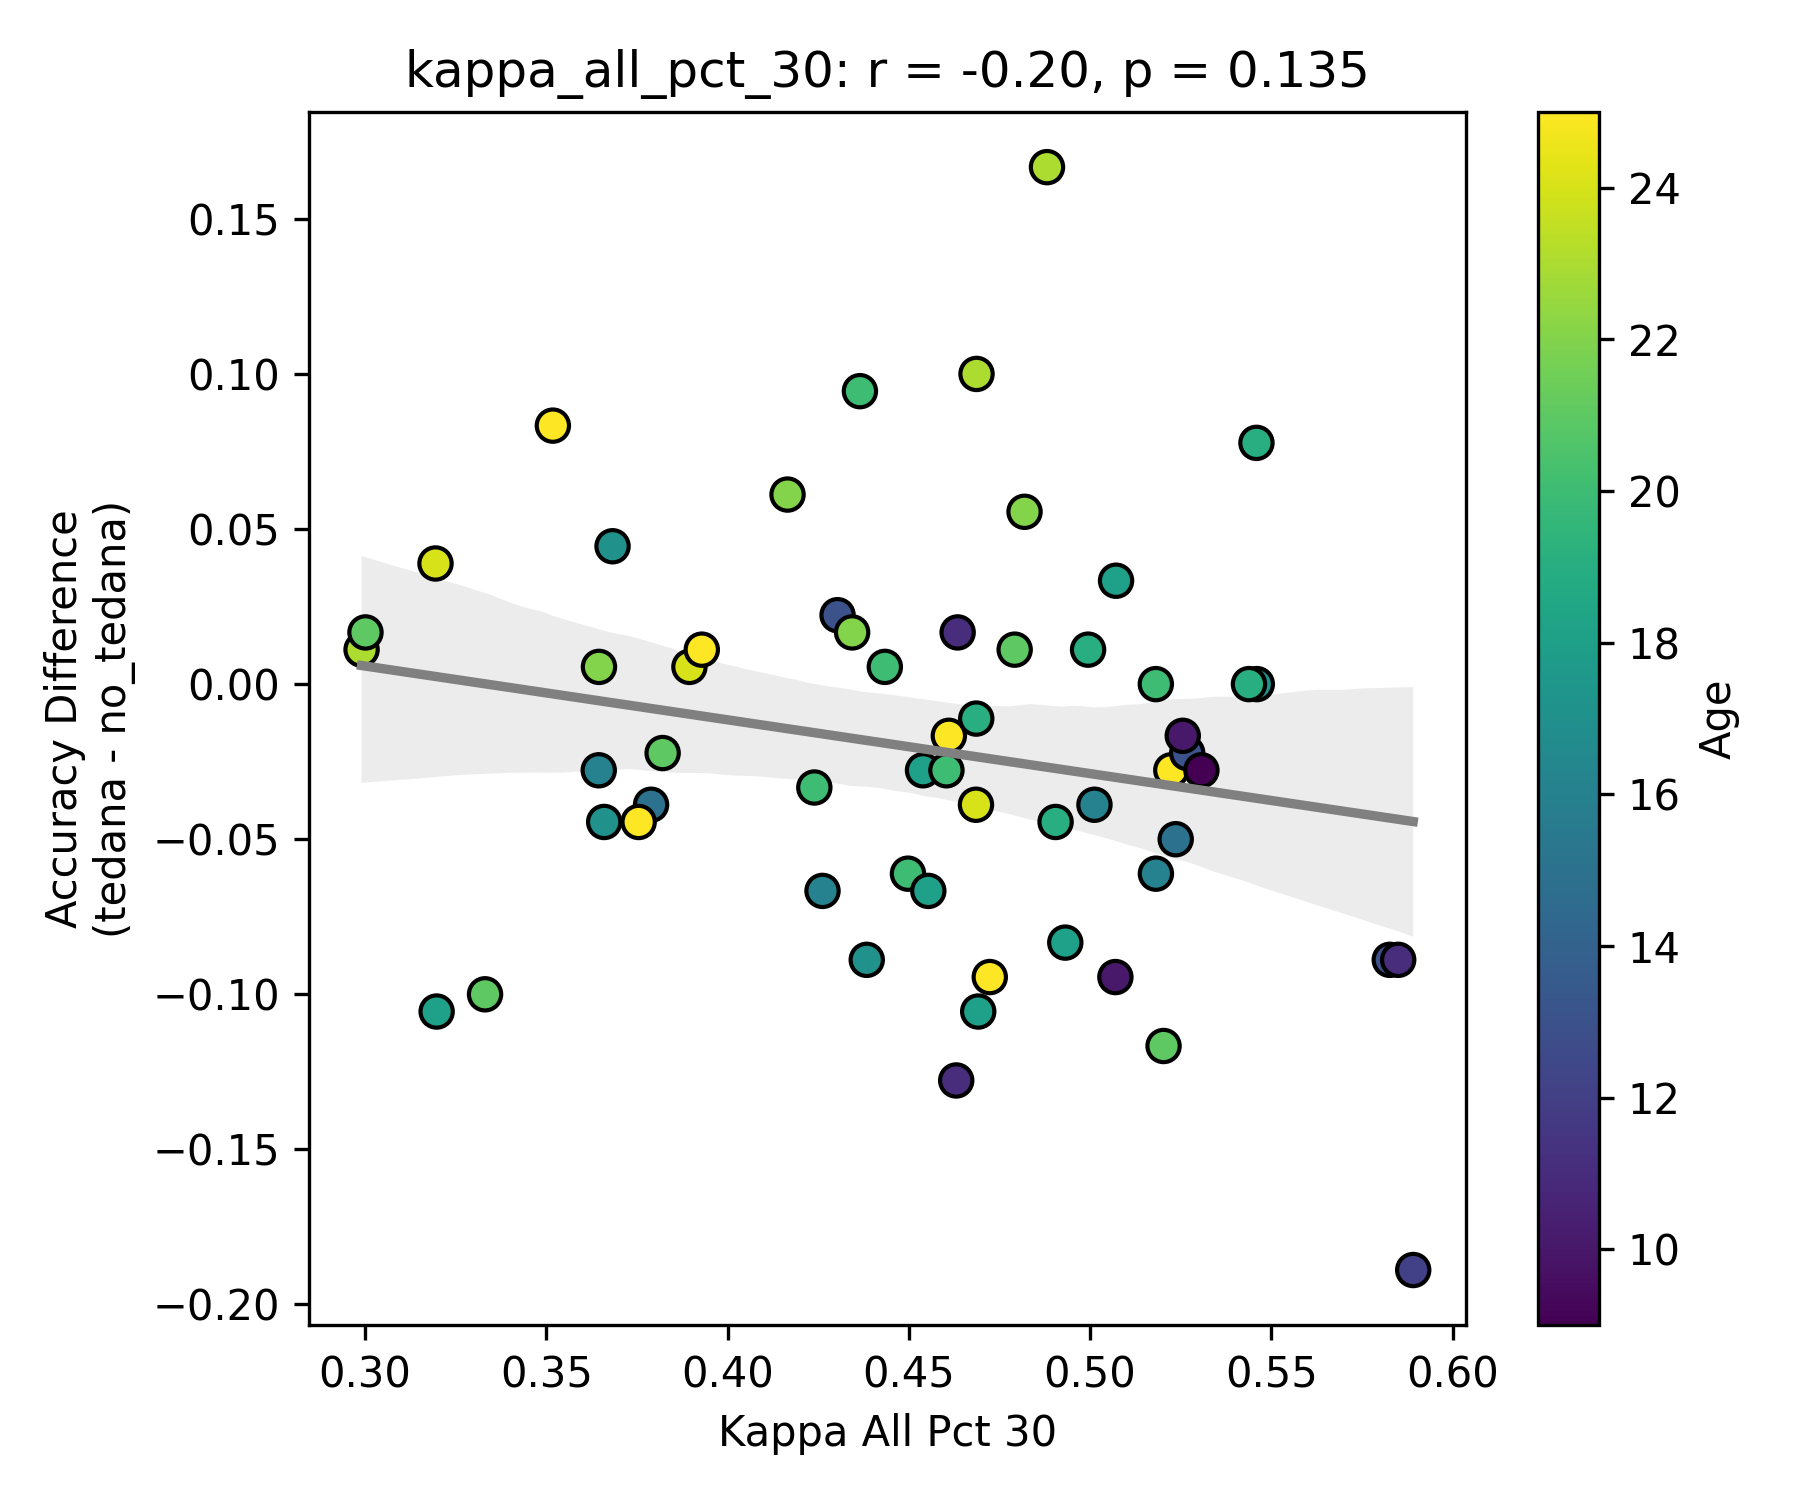
First, looking at values next to the kappa elbow – it seems that the more components are close to it, the worse the performance (no effect in within 10% of kappa value):

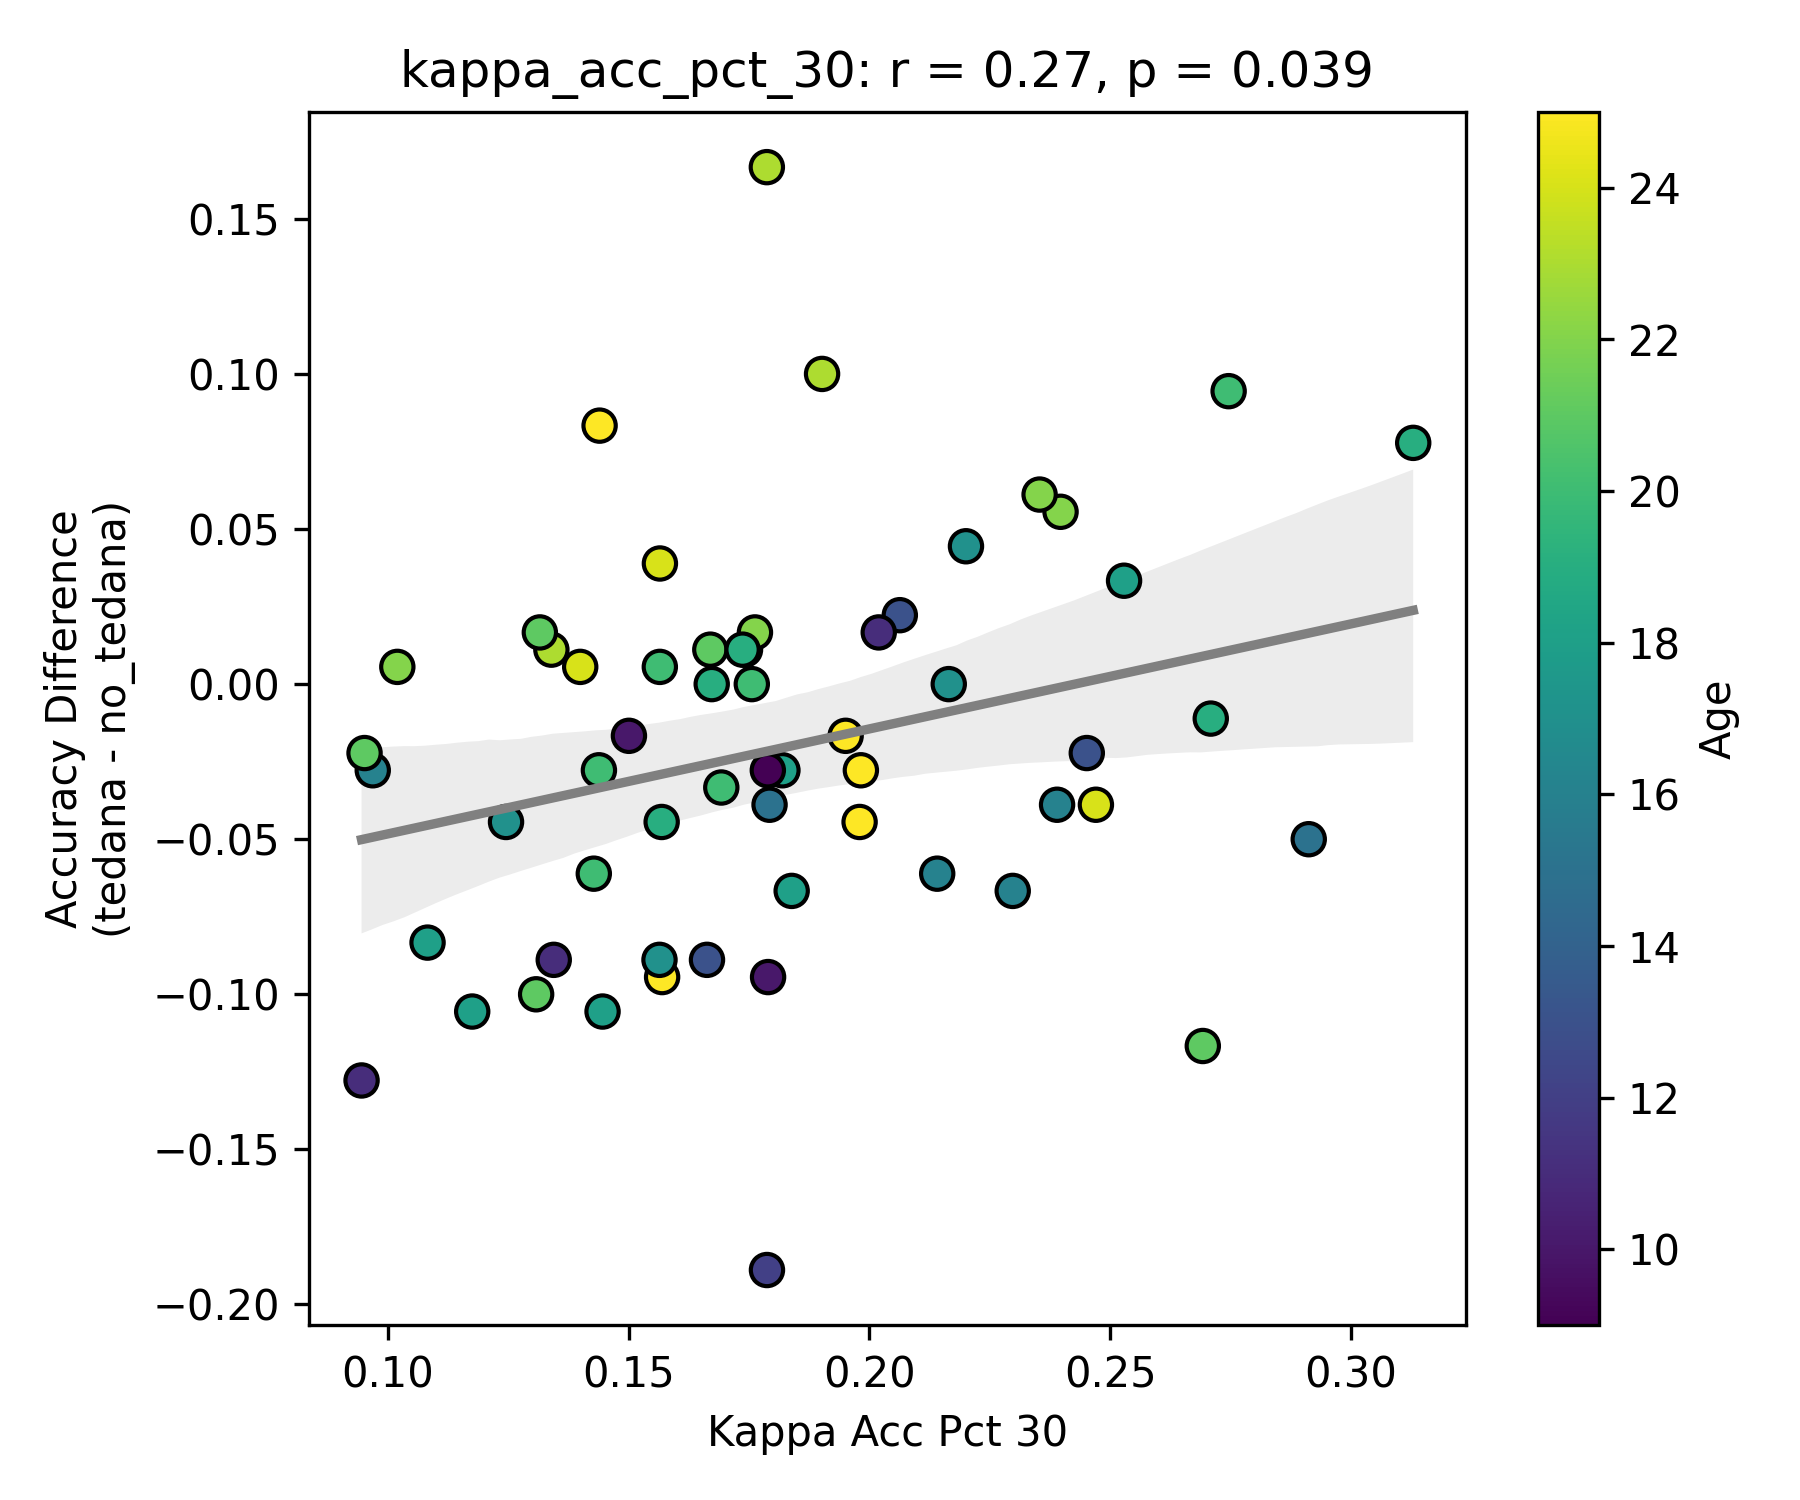
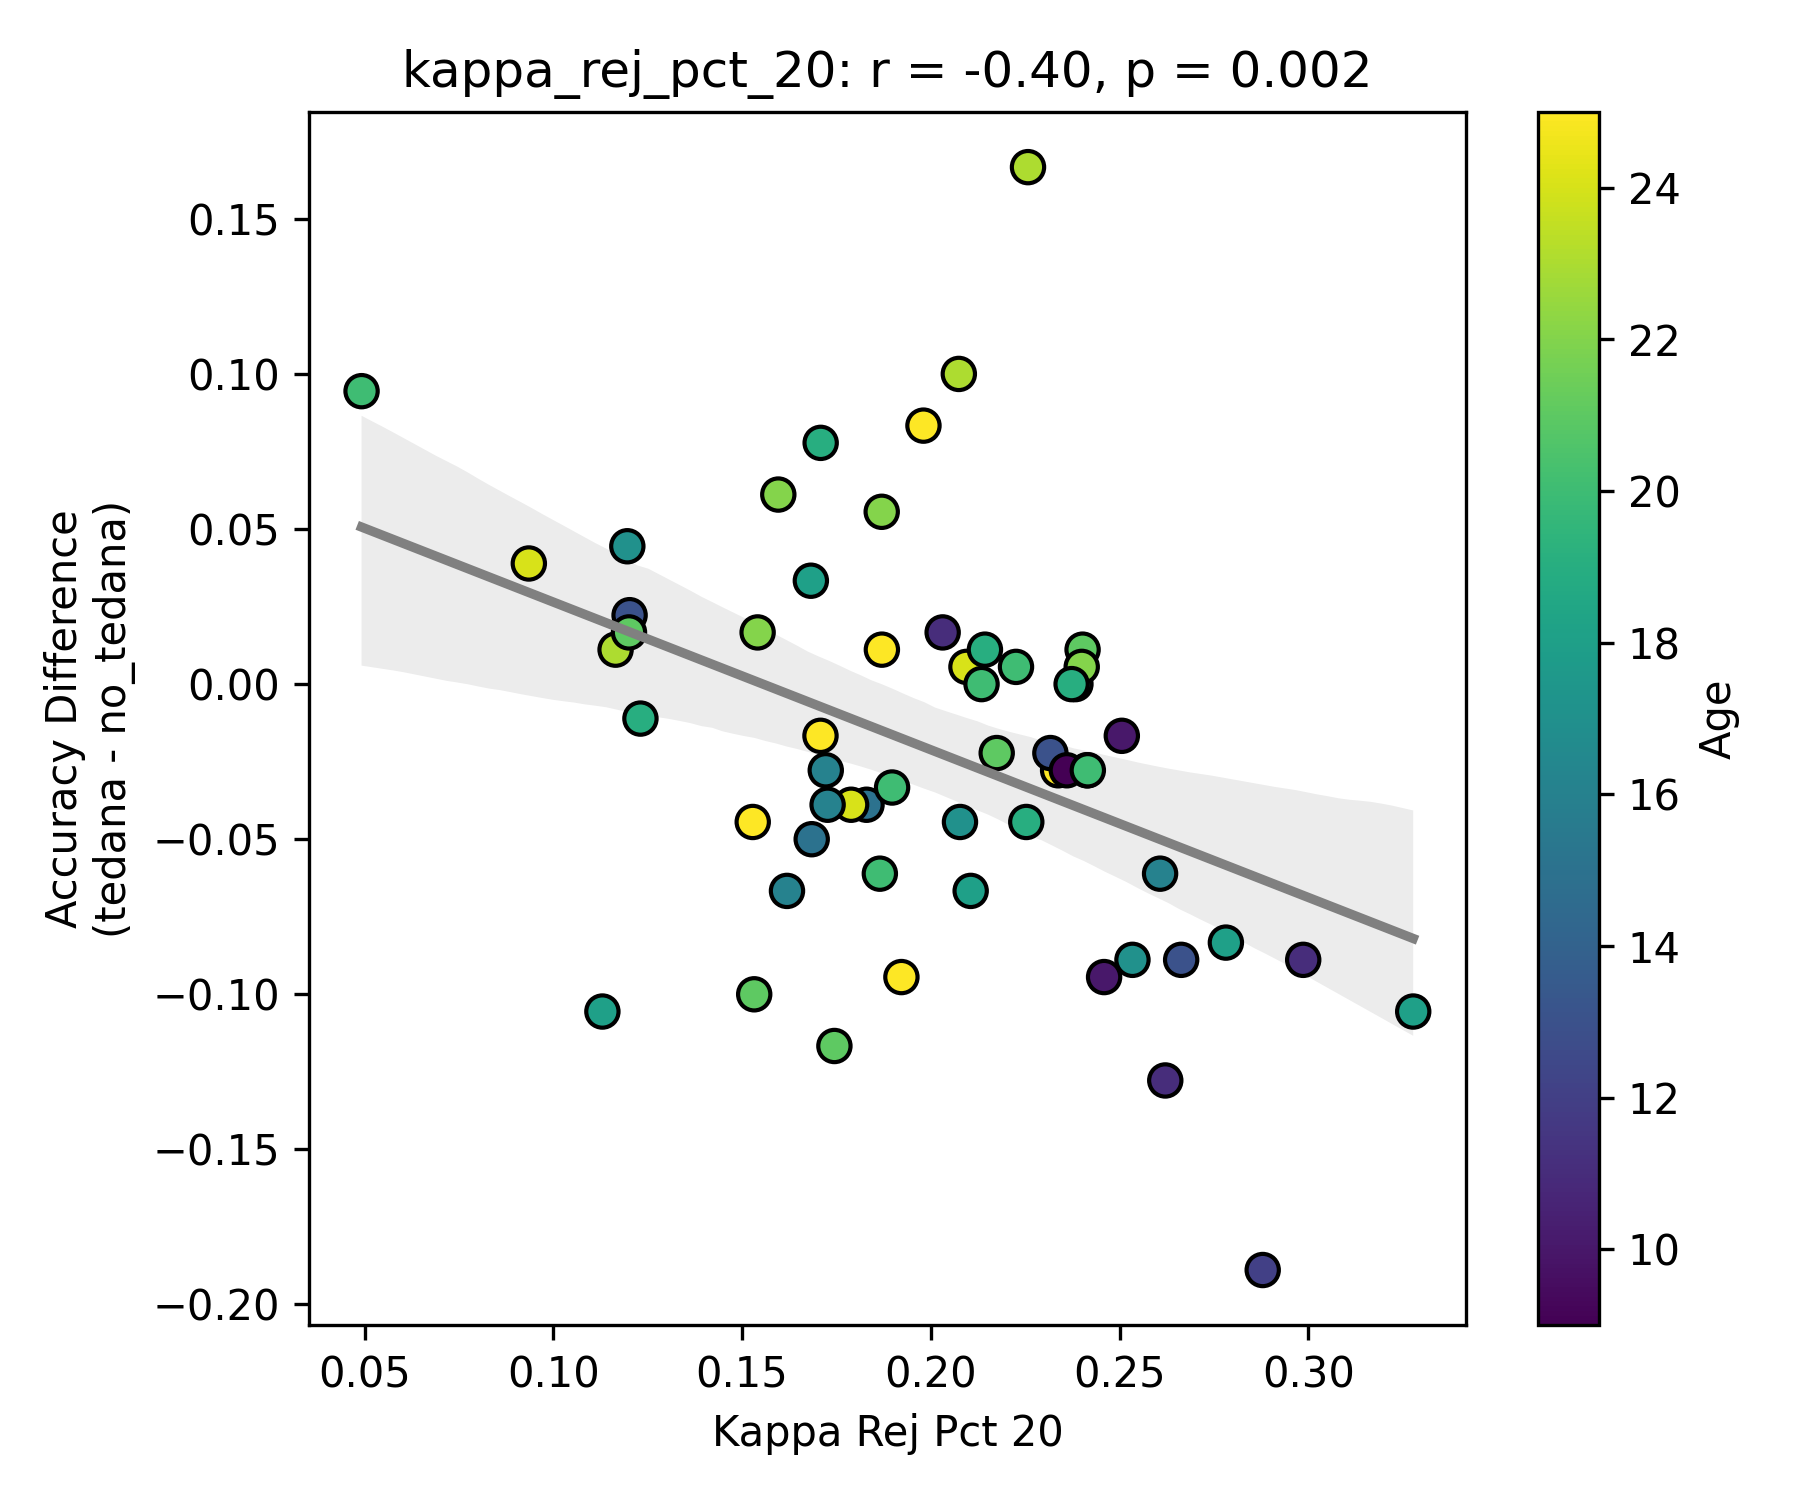
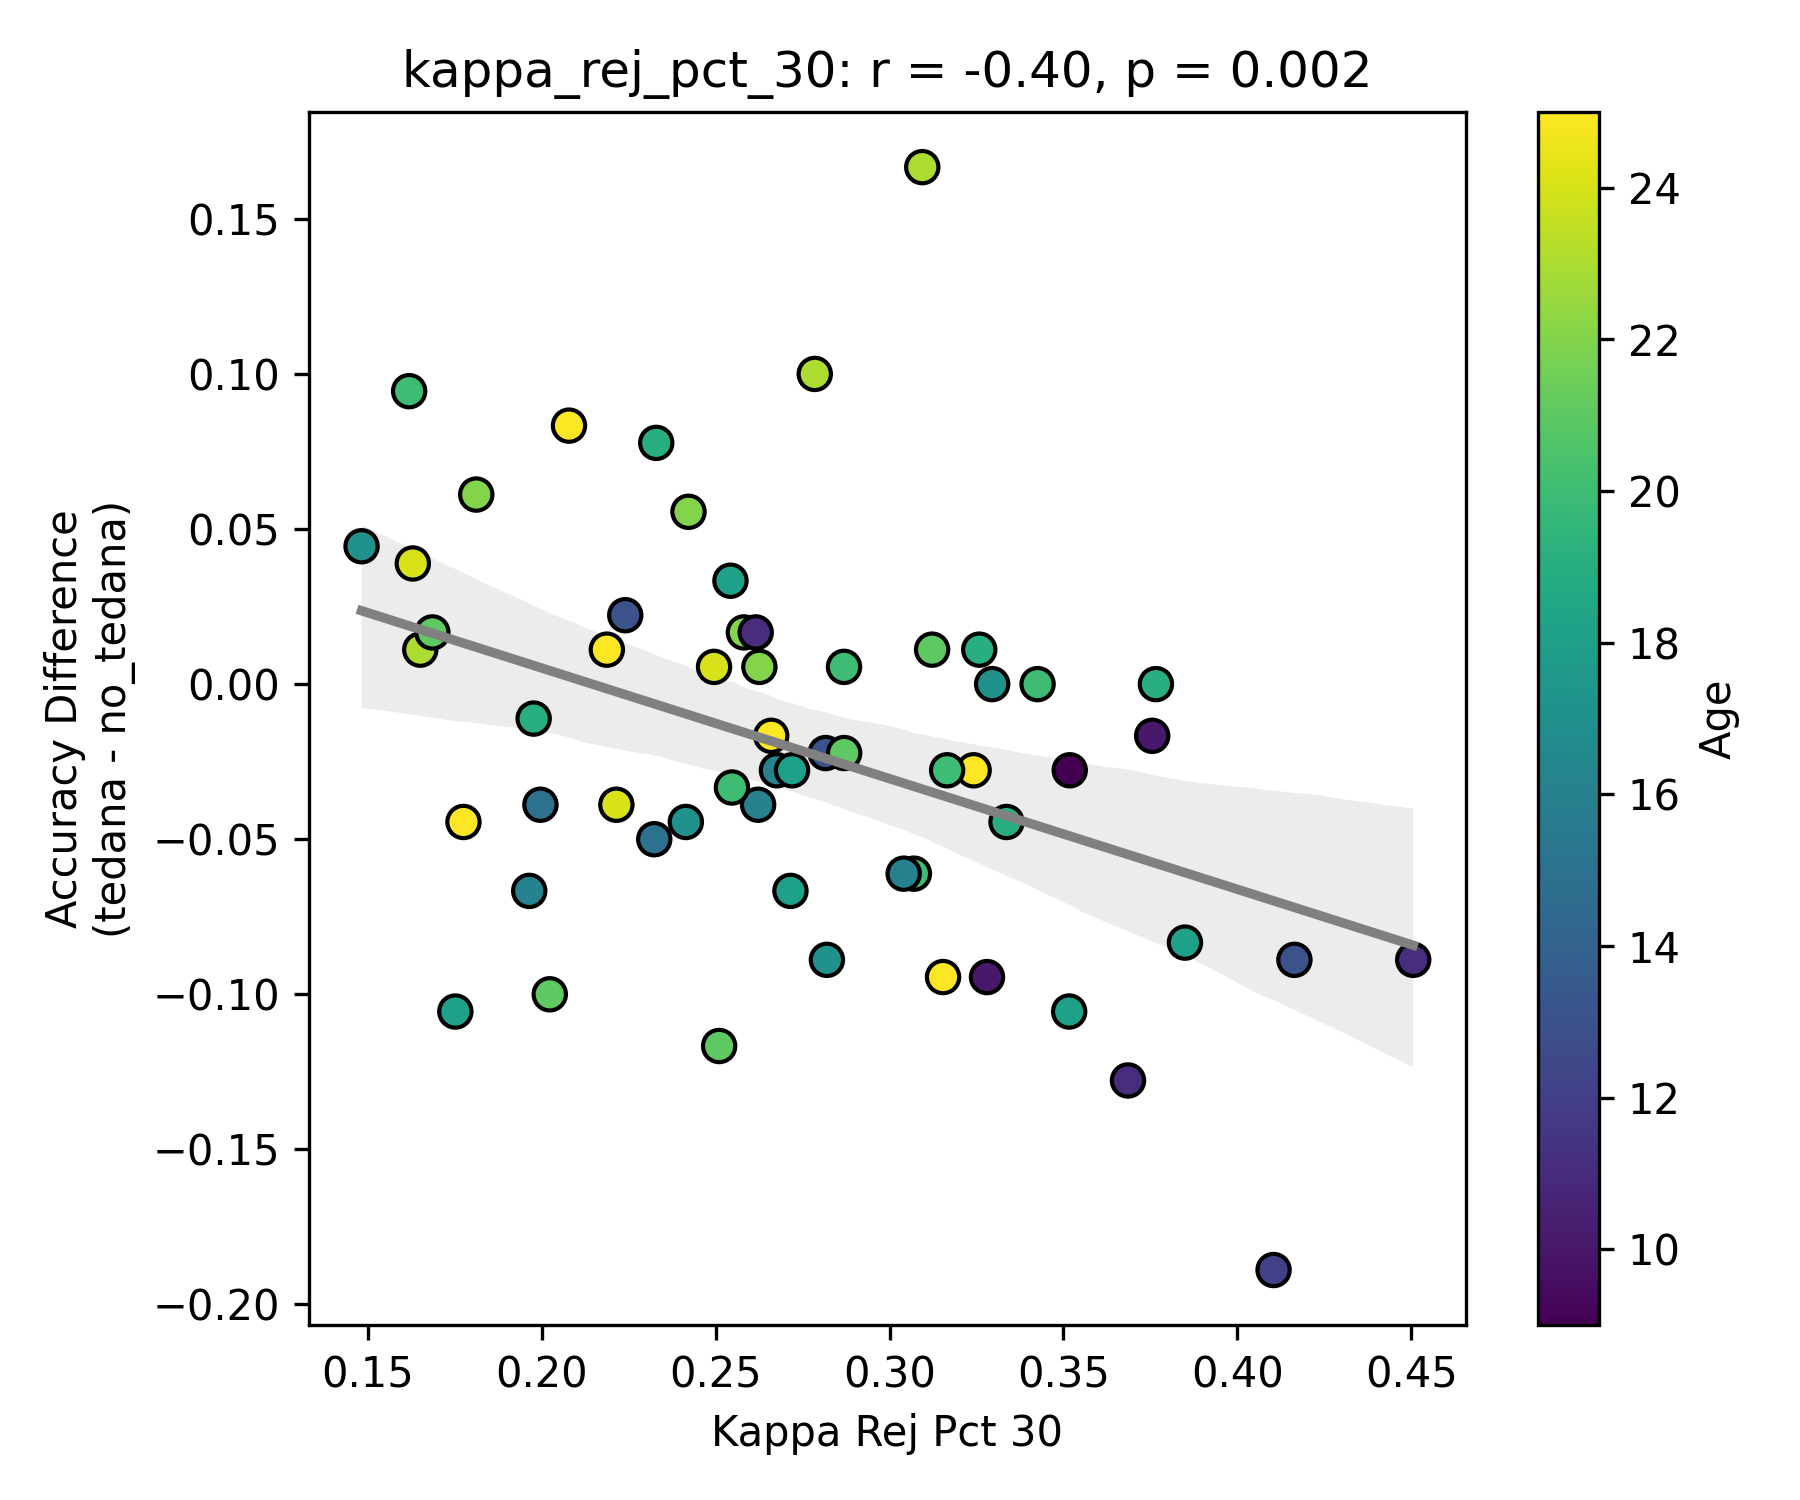
This effect is significant when looking at only the accepted/rejected components close to the kappa elbow:

The percentage of rejected components being close to the elbow appears to be age related.

I understand that a higher component kappa value = a higher likelihood of a component representing BOLD signal. What I assume this is implying is that some components laying close to the elbow do carry meaningful signal, but are still being rejected due to them not hitting a certain threshold (I know this is not only determined by how close a component is to the kappa elbow, but it seems to play a role in it?). So potentially tedana is rejecting too many components?

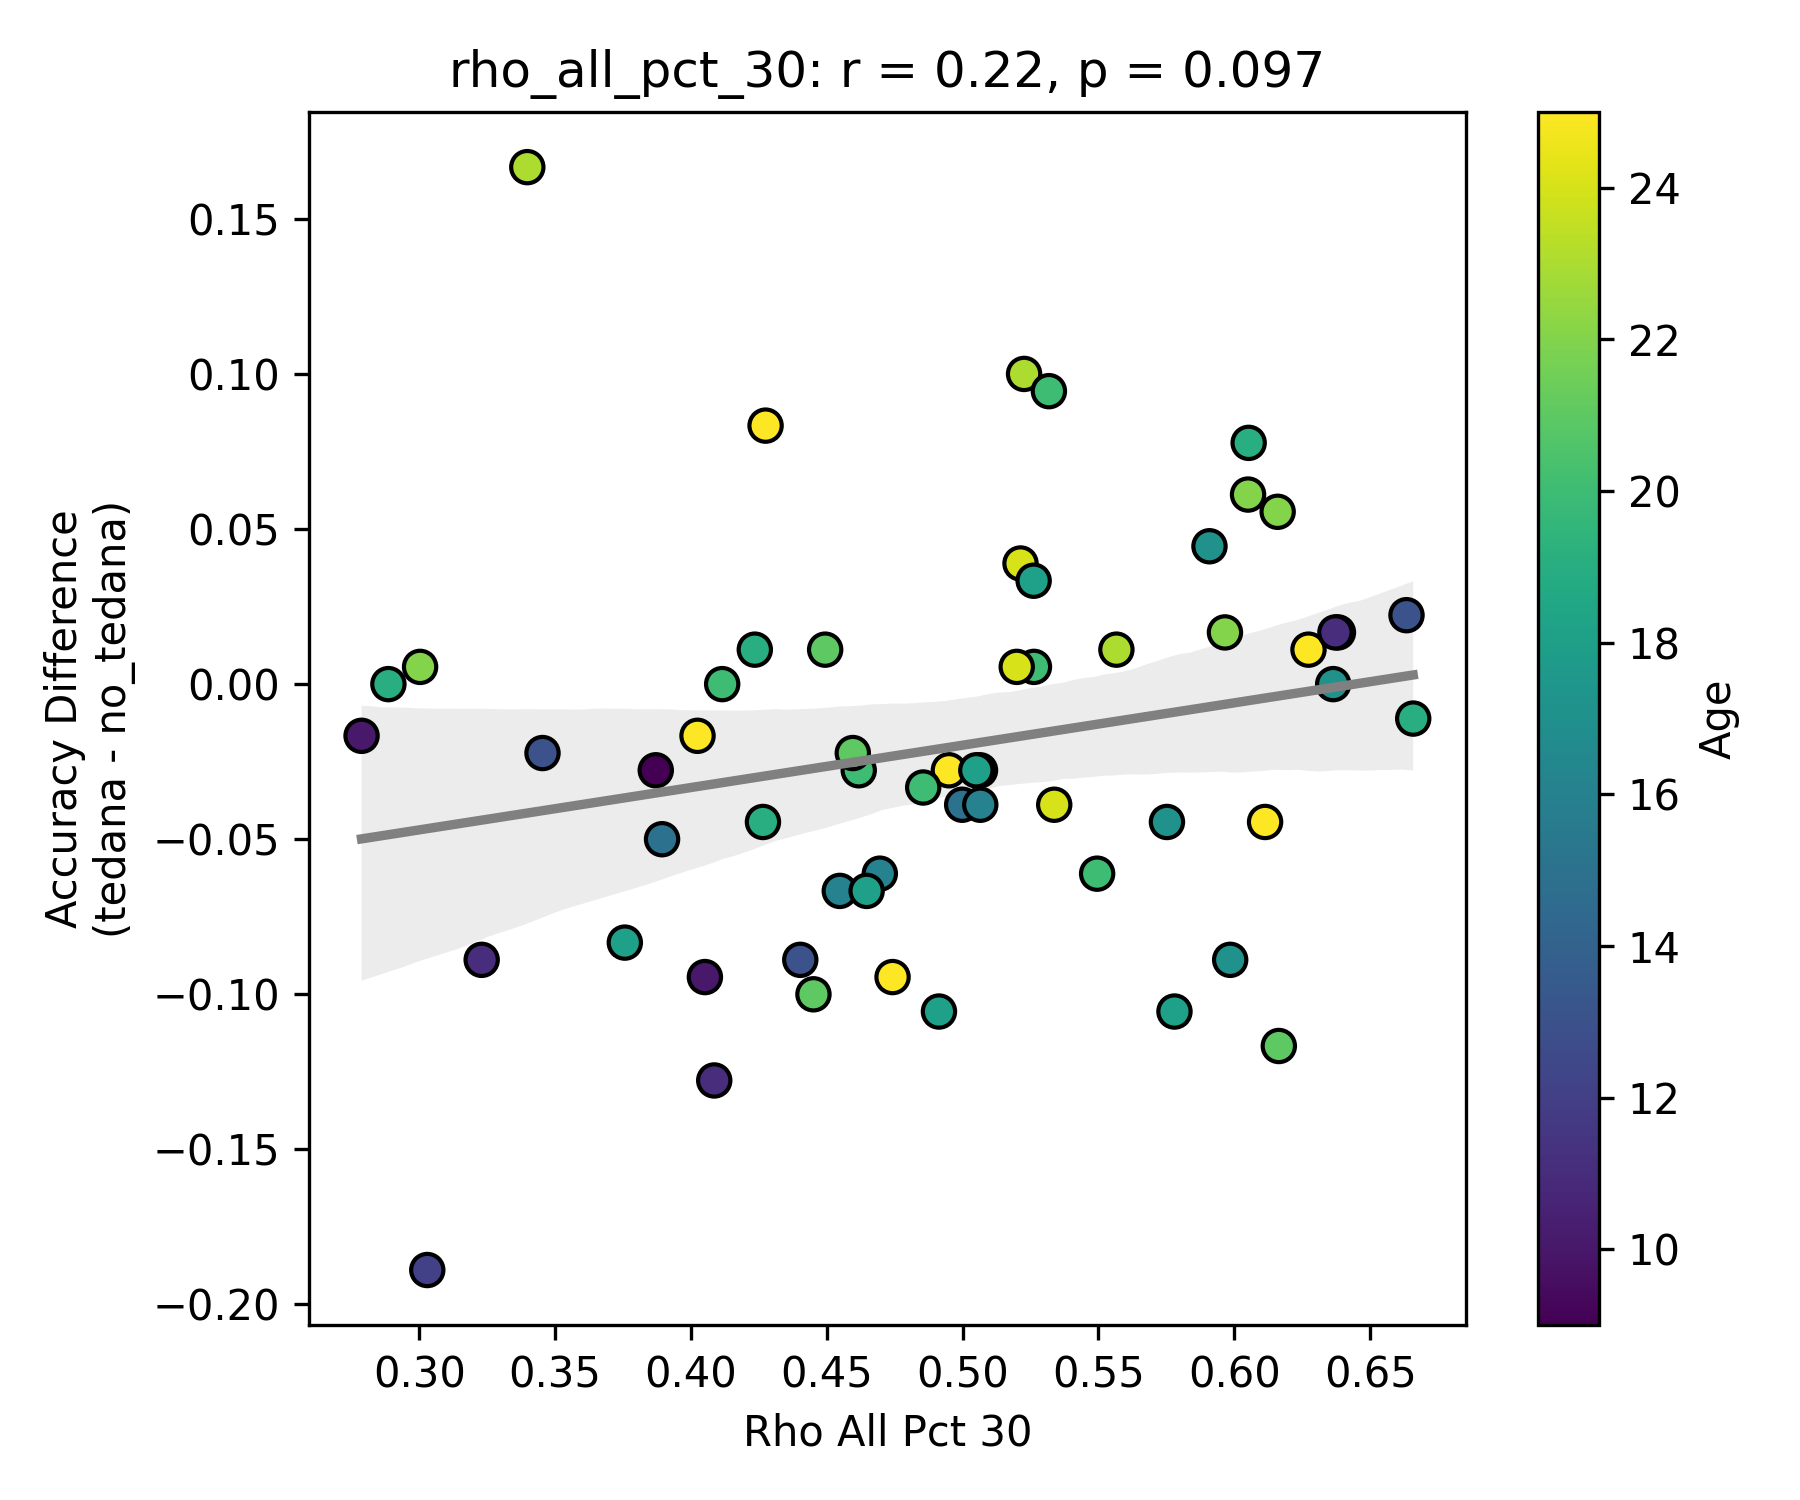
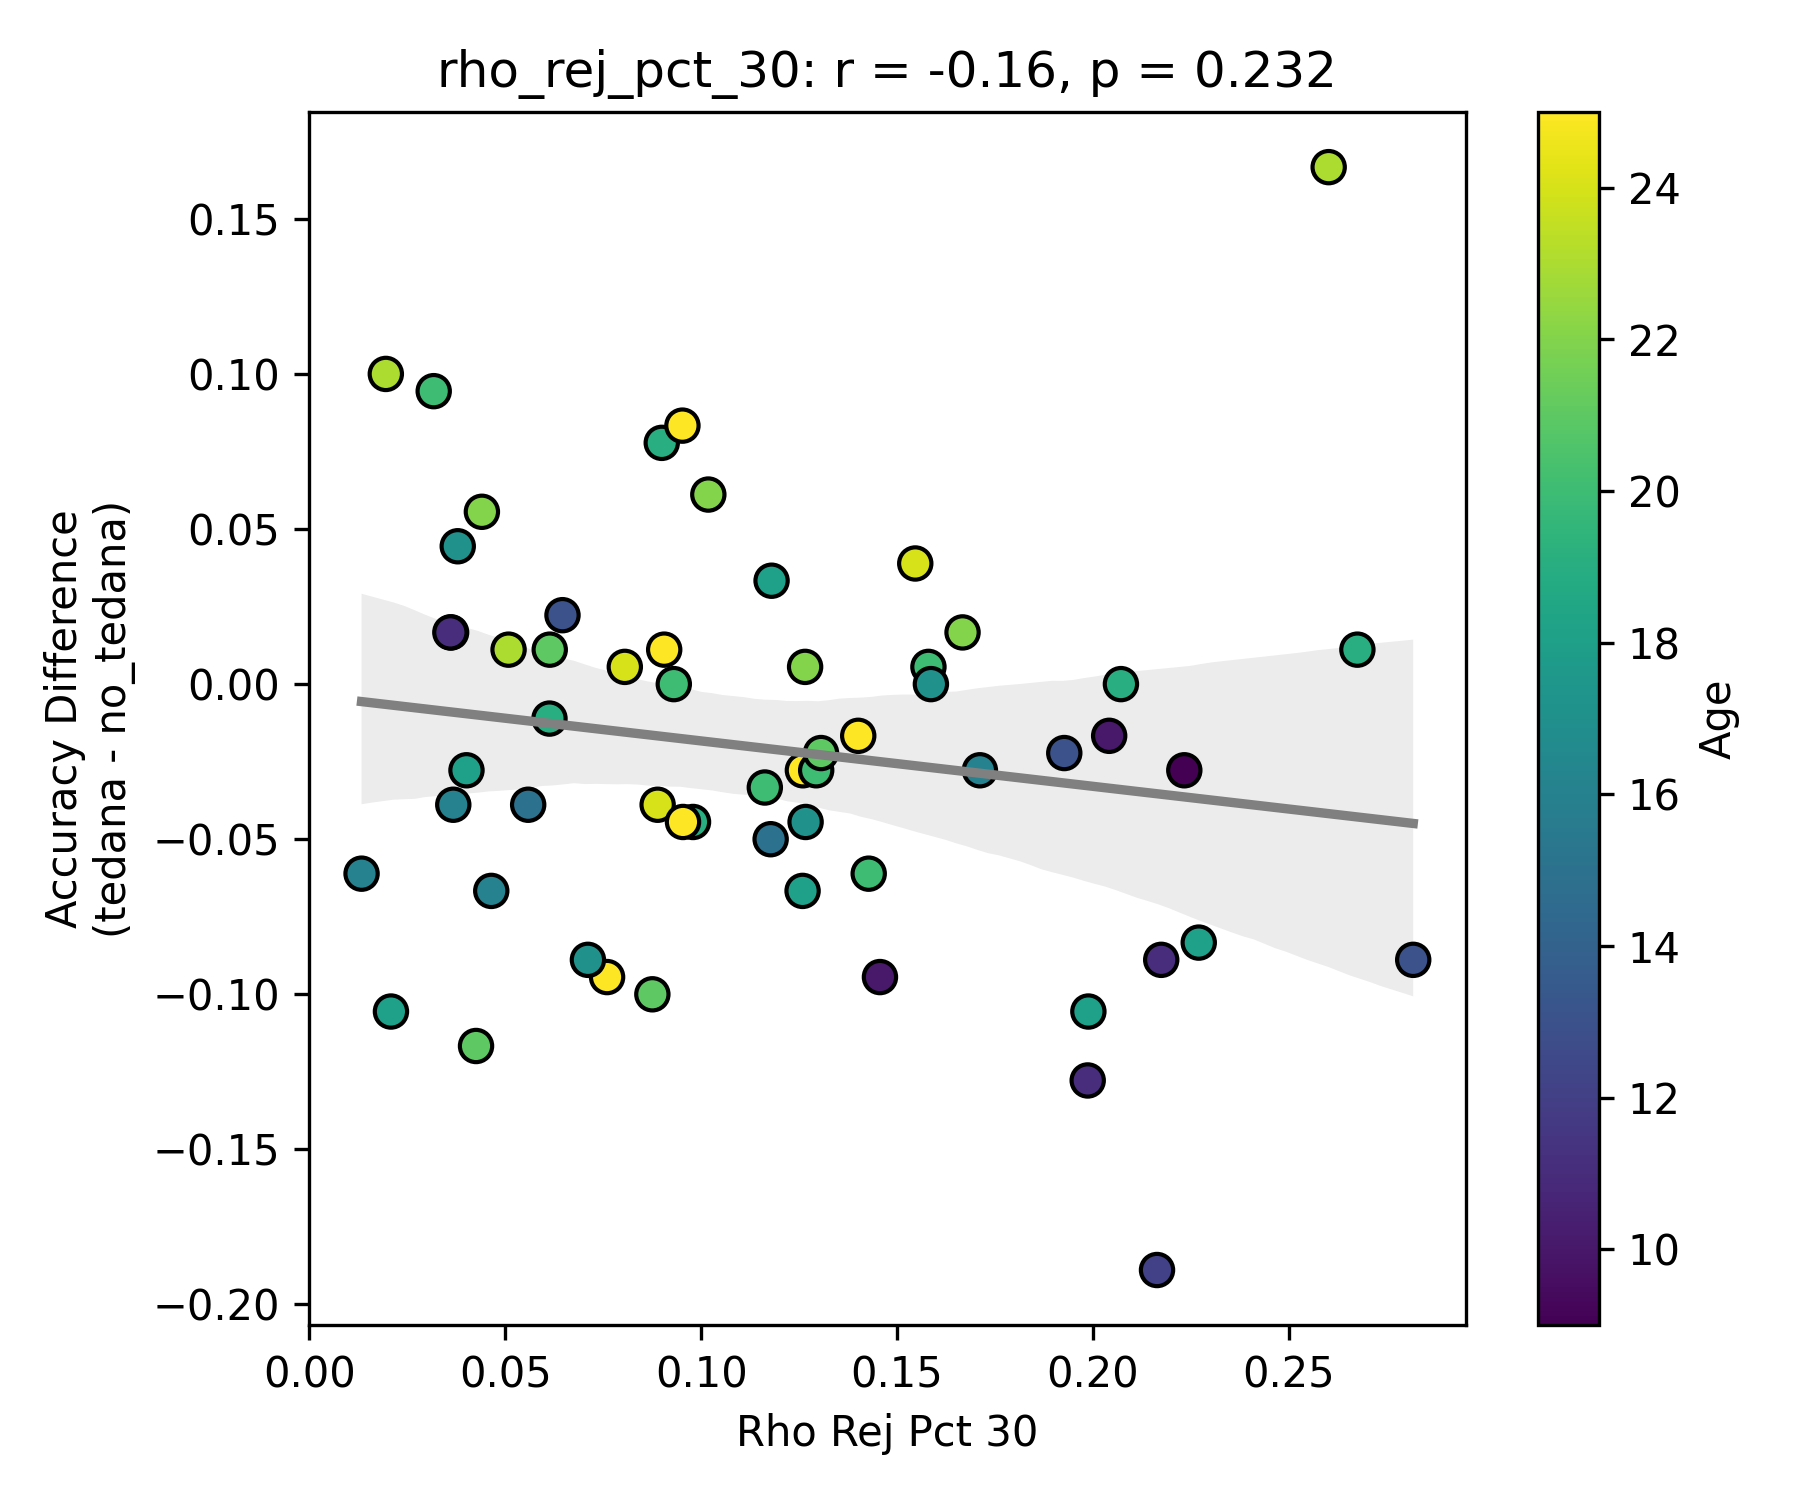
This effect is not as apparent while looking the same analysis done in regards to the rho elbow, and it is not significant. I’ll attach some only the most significant plots here (significance order is 30%, 20%, 10%).


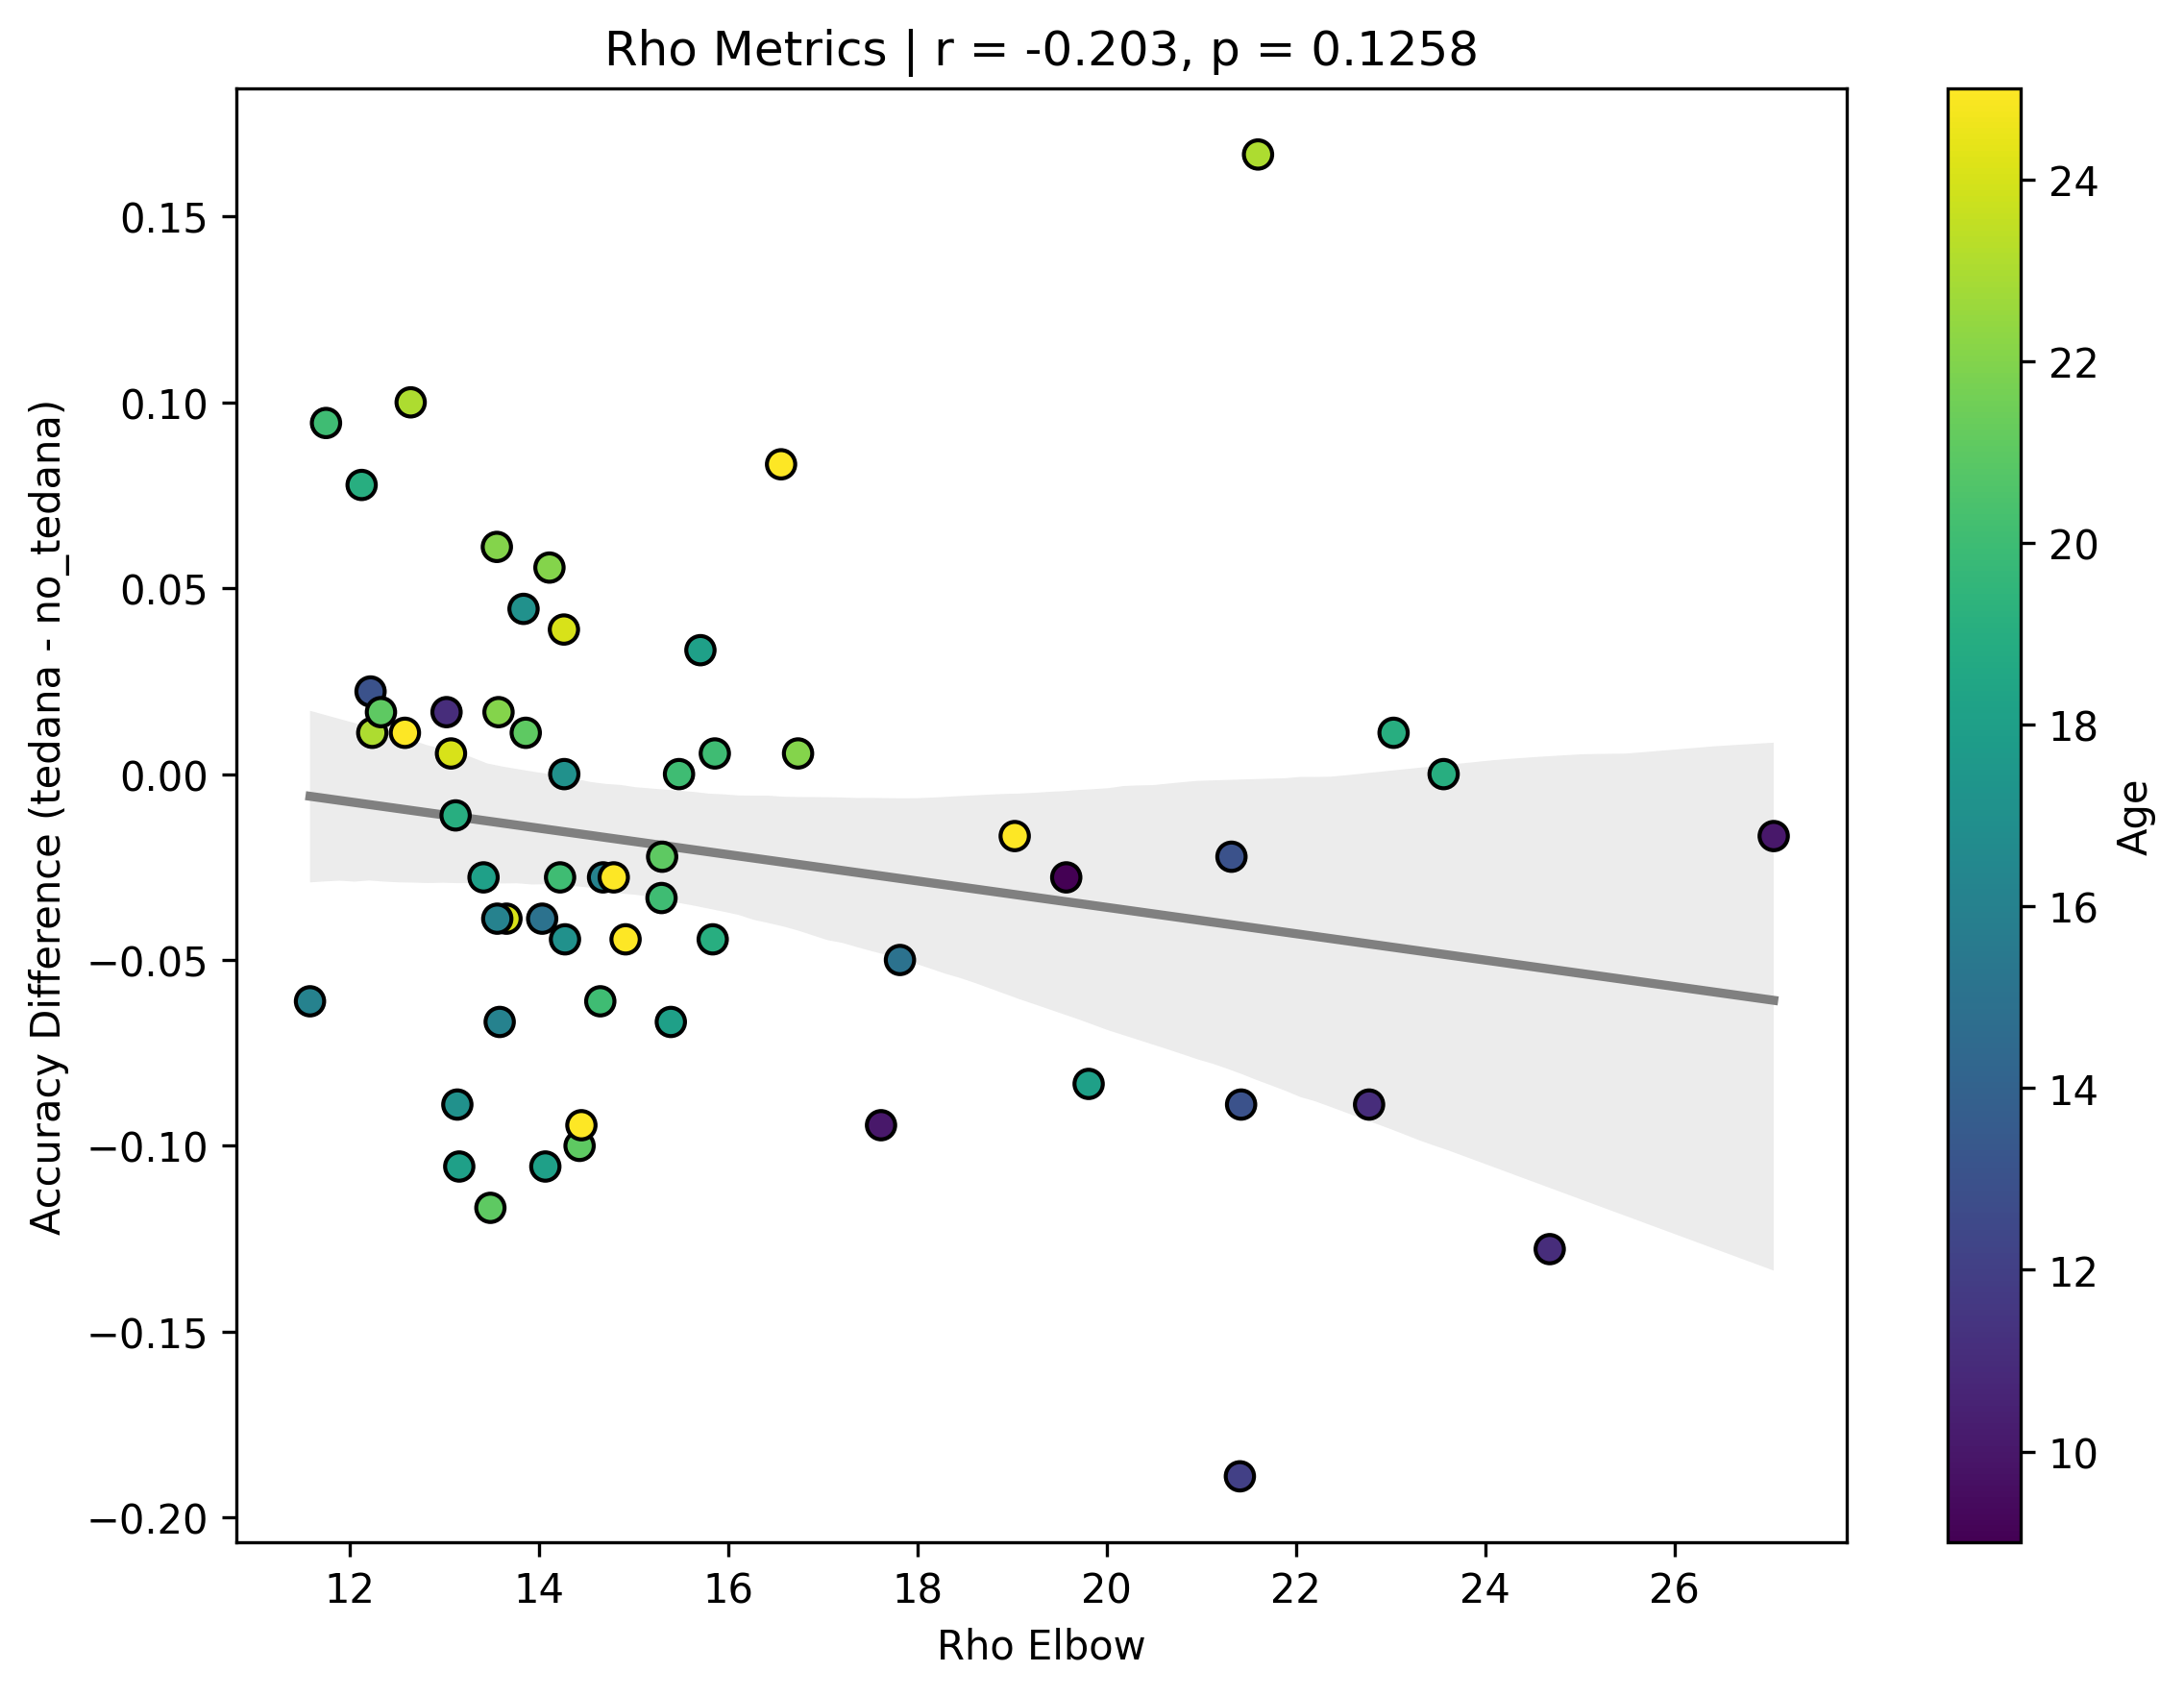
The actual rho elbow value seems to be lower in subjects with a worse accuracy difference (this is not the case for the kappa elbow value), and this seems to be age related:

Similarly to the above, since a higher row implies a lower likelihood of a component representing BOLD signal, and more rejected components close to it correlate to a worse classifier accuracy difference, tedana might be rejecting too many components below/close to the threshold? And if Rho elbow is lower, decision boundary shifts so more components fall in noise region?

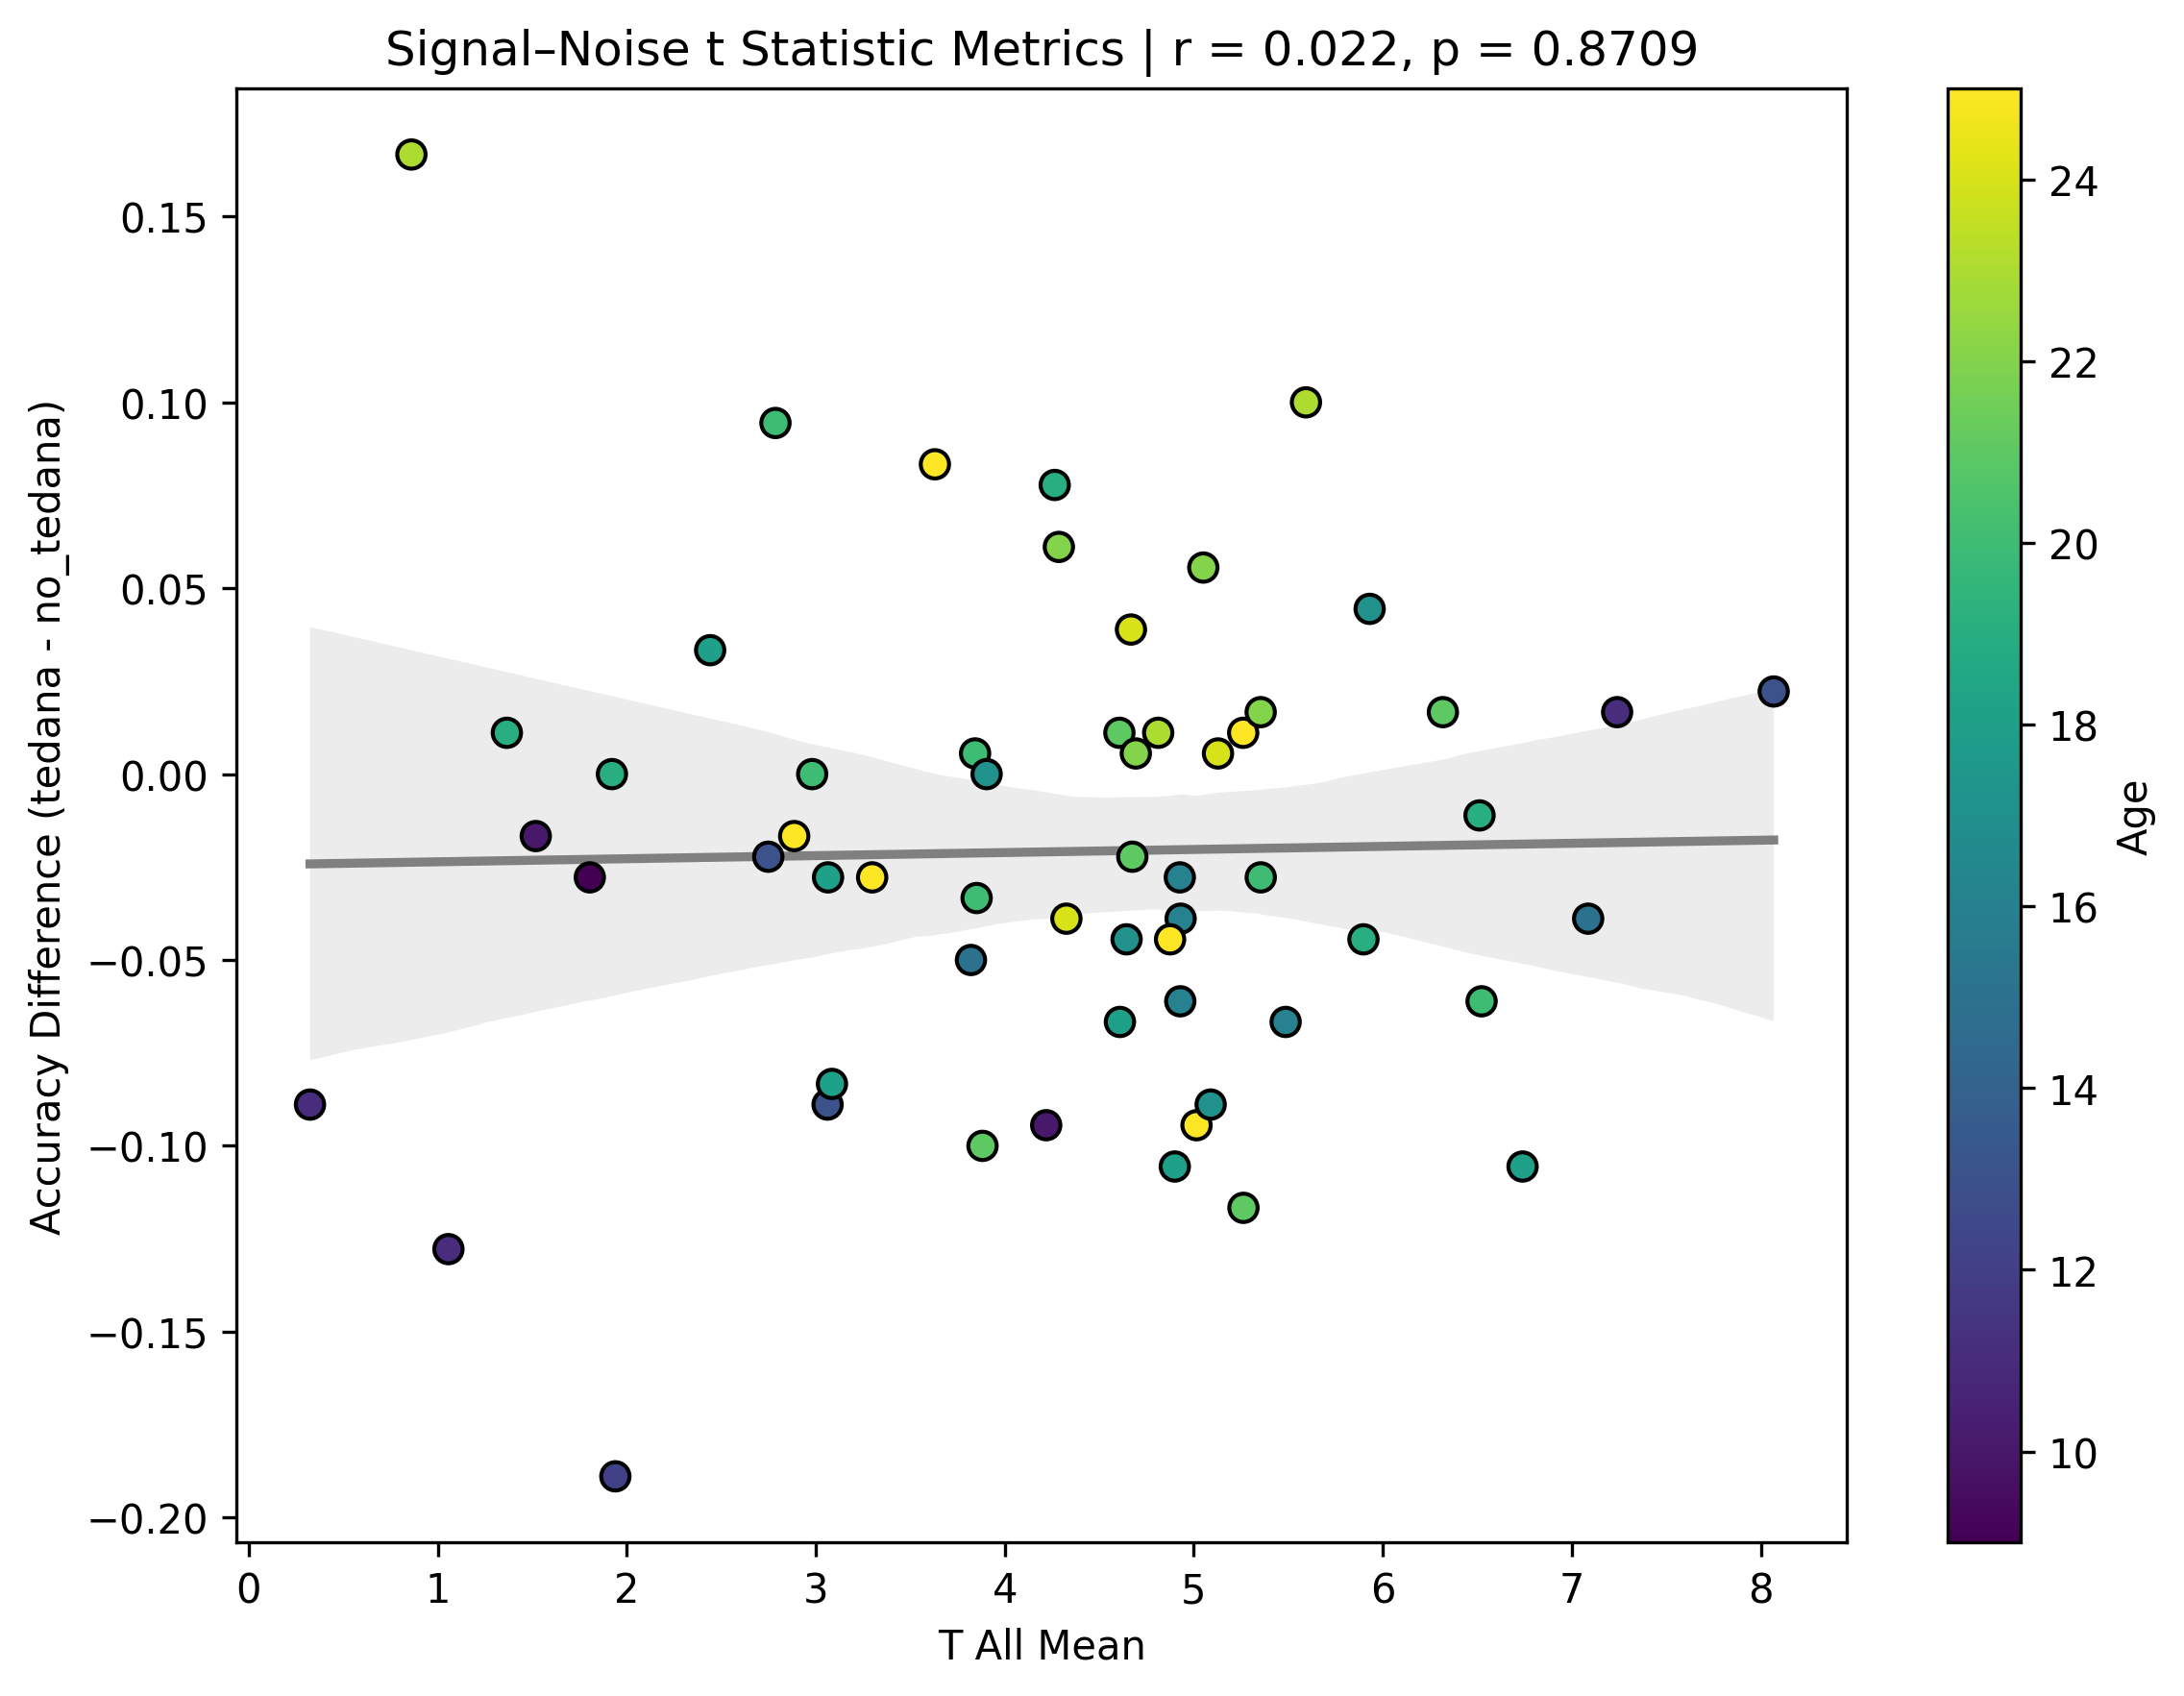
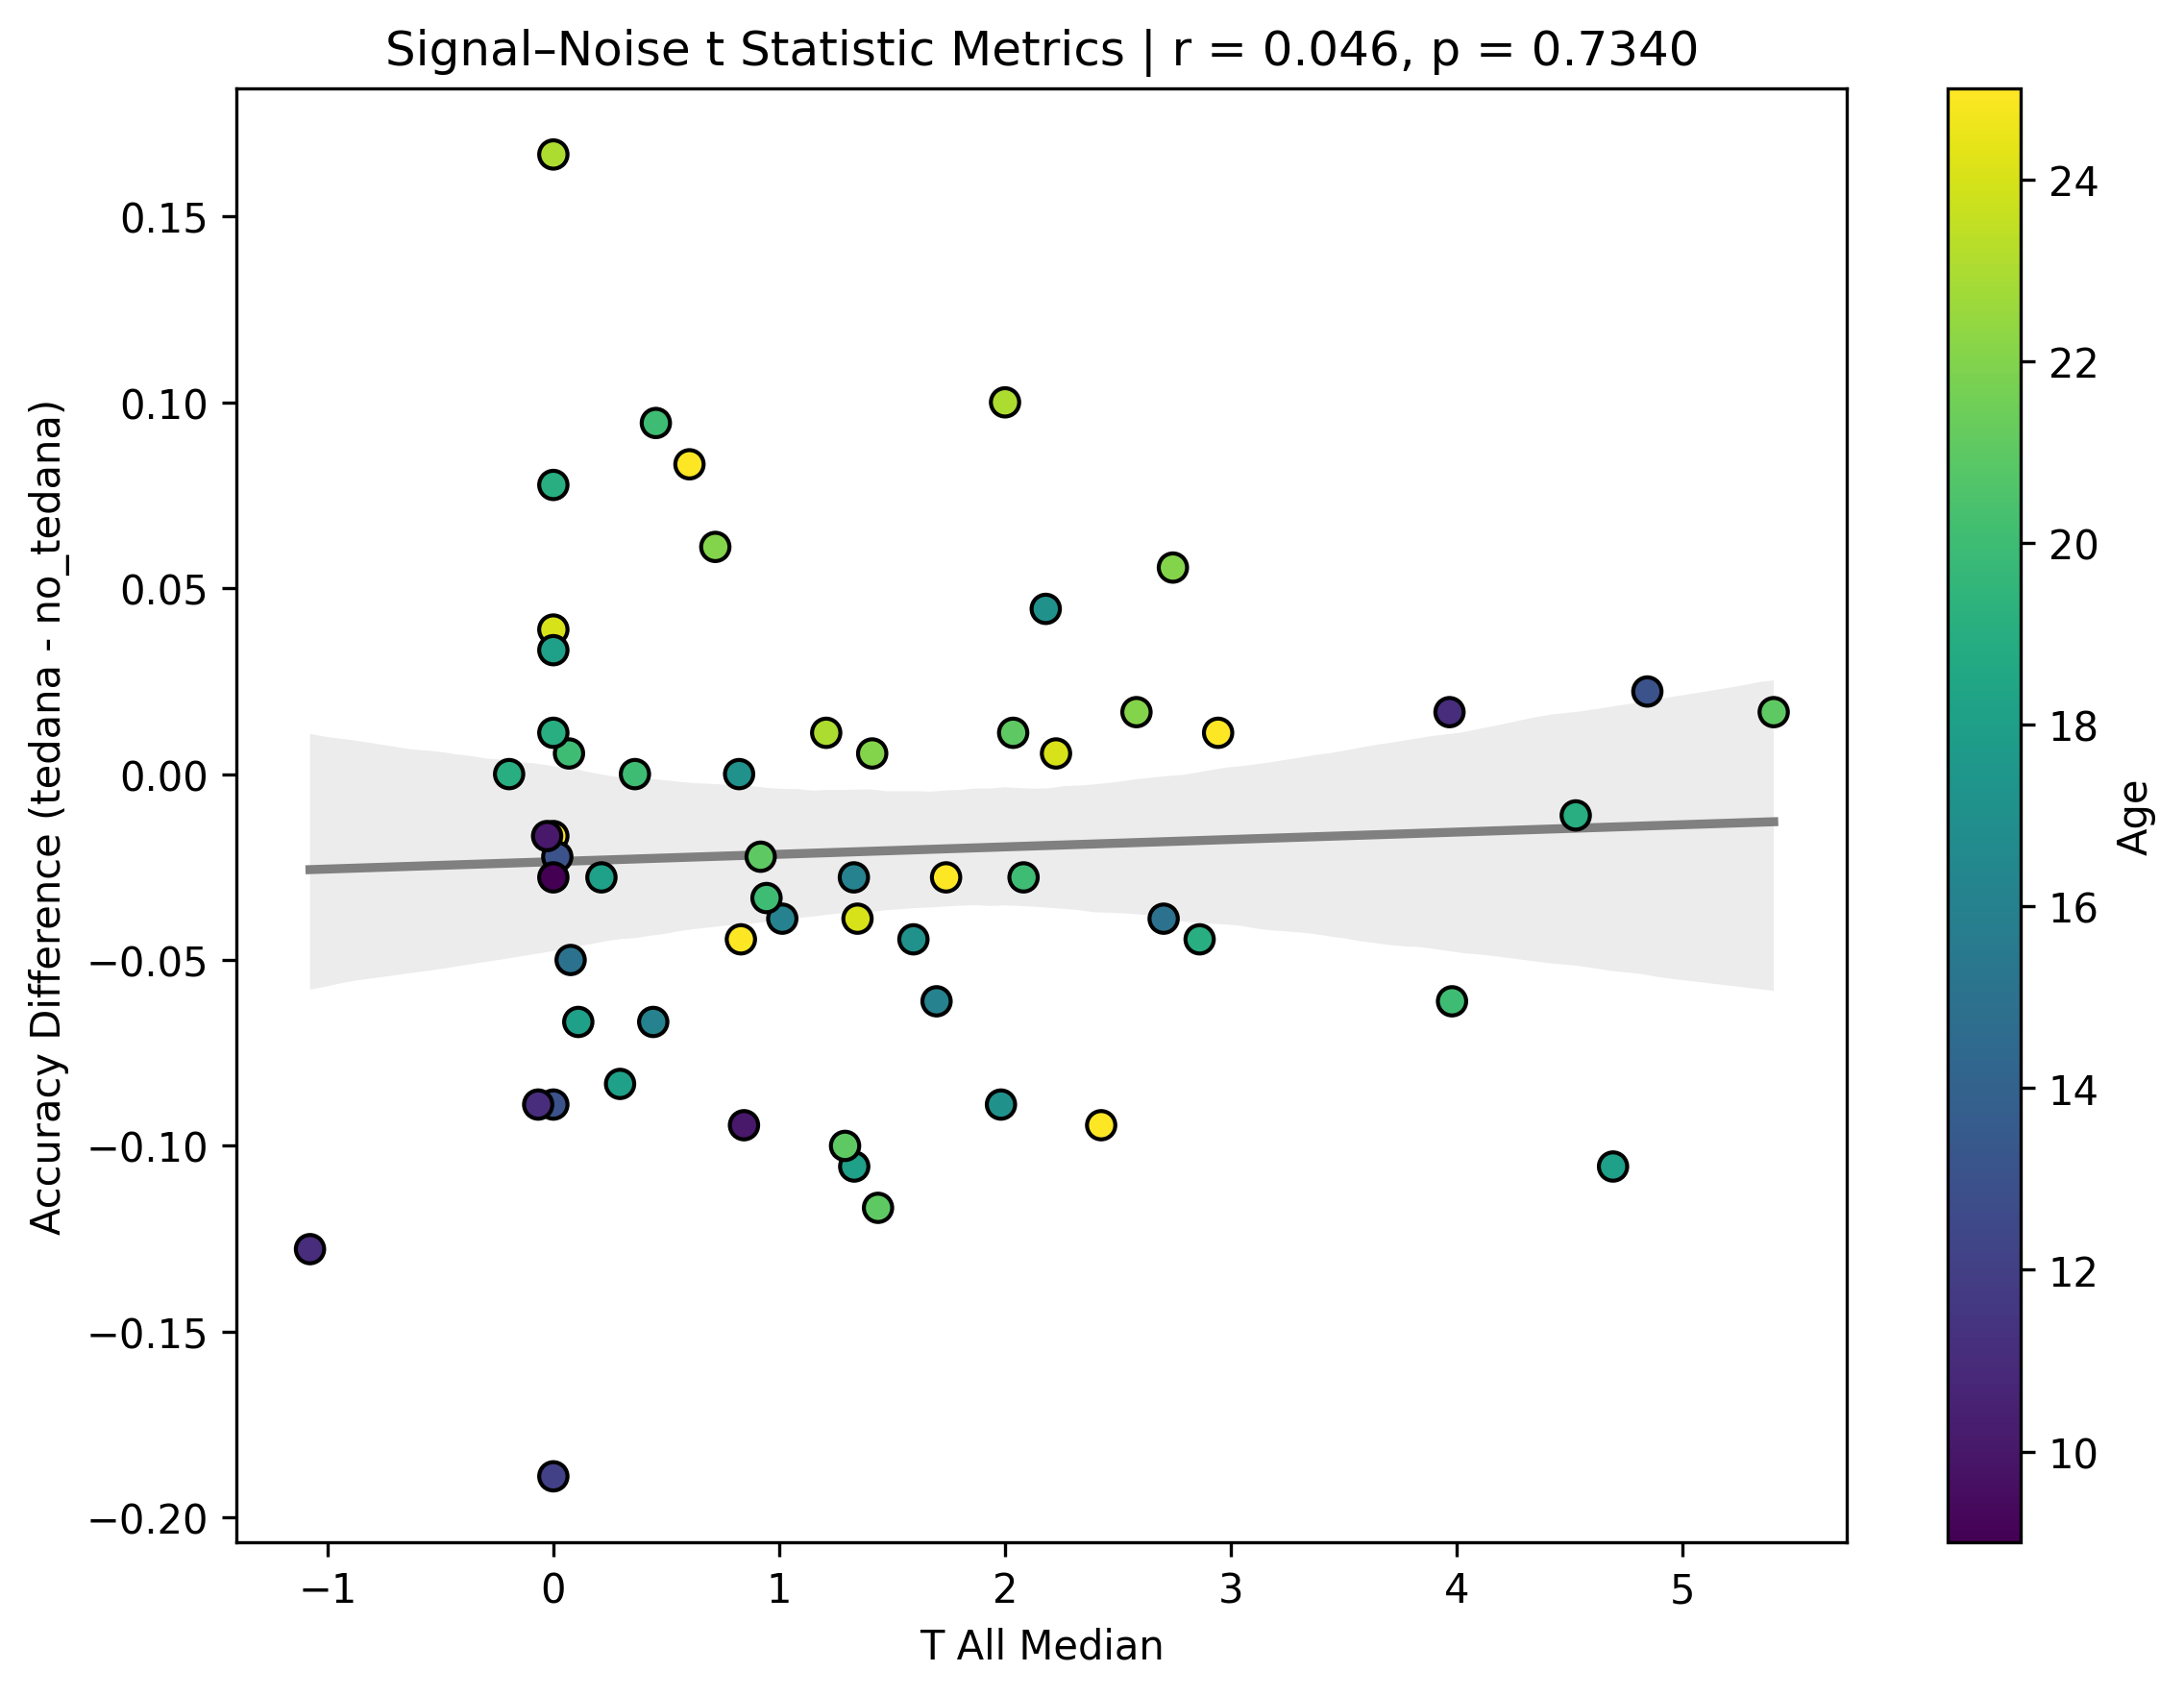
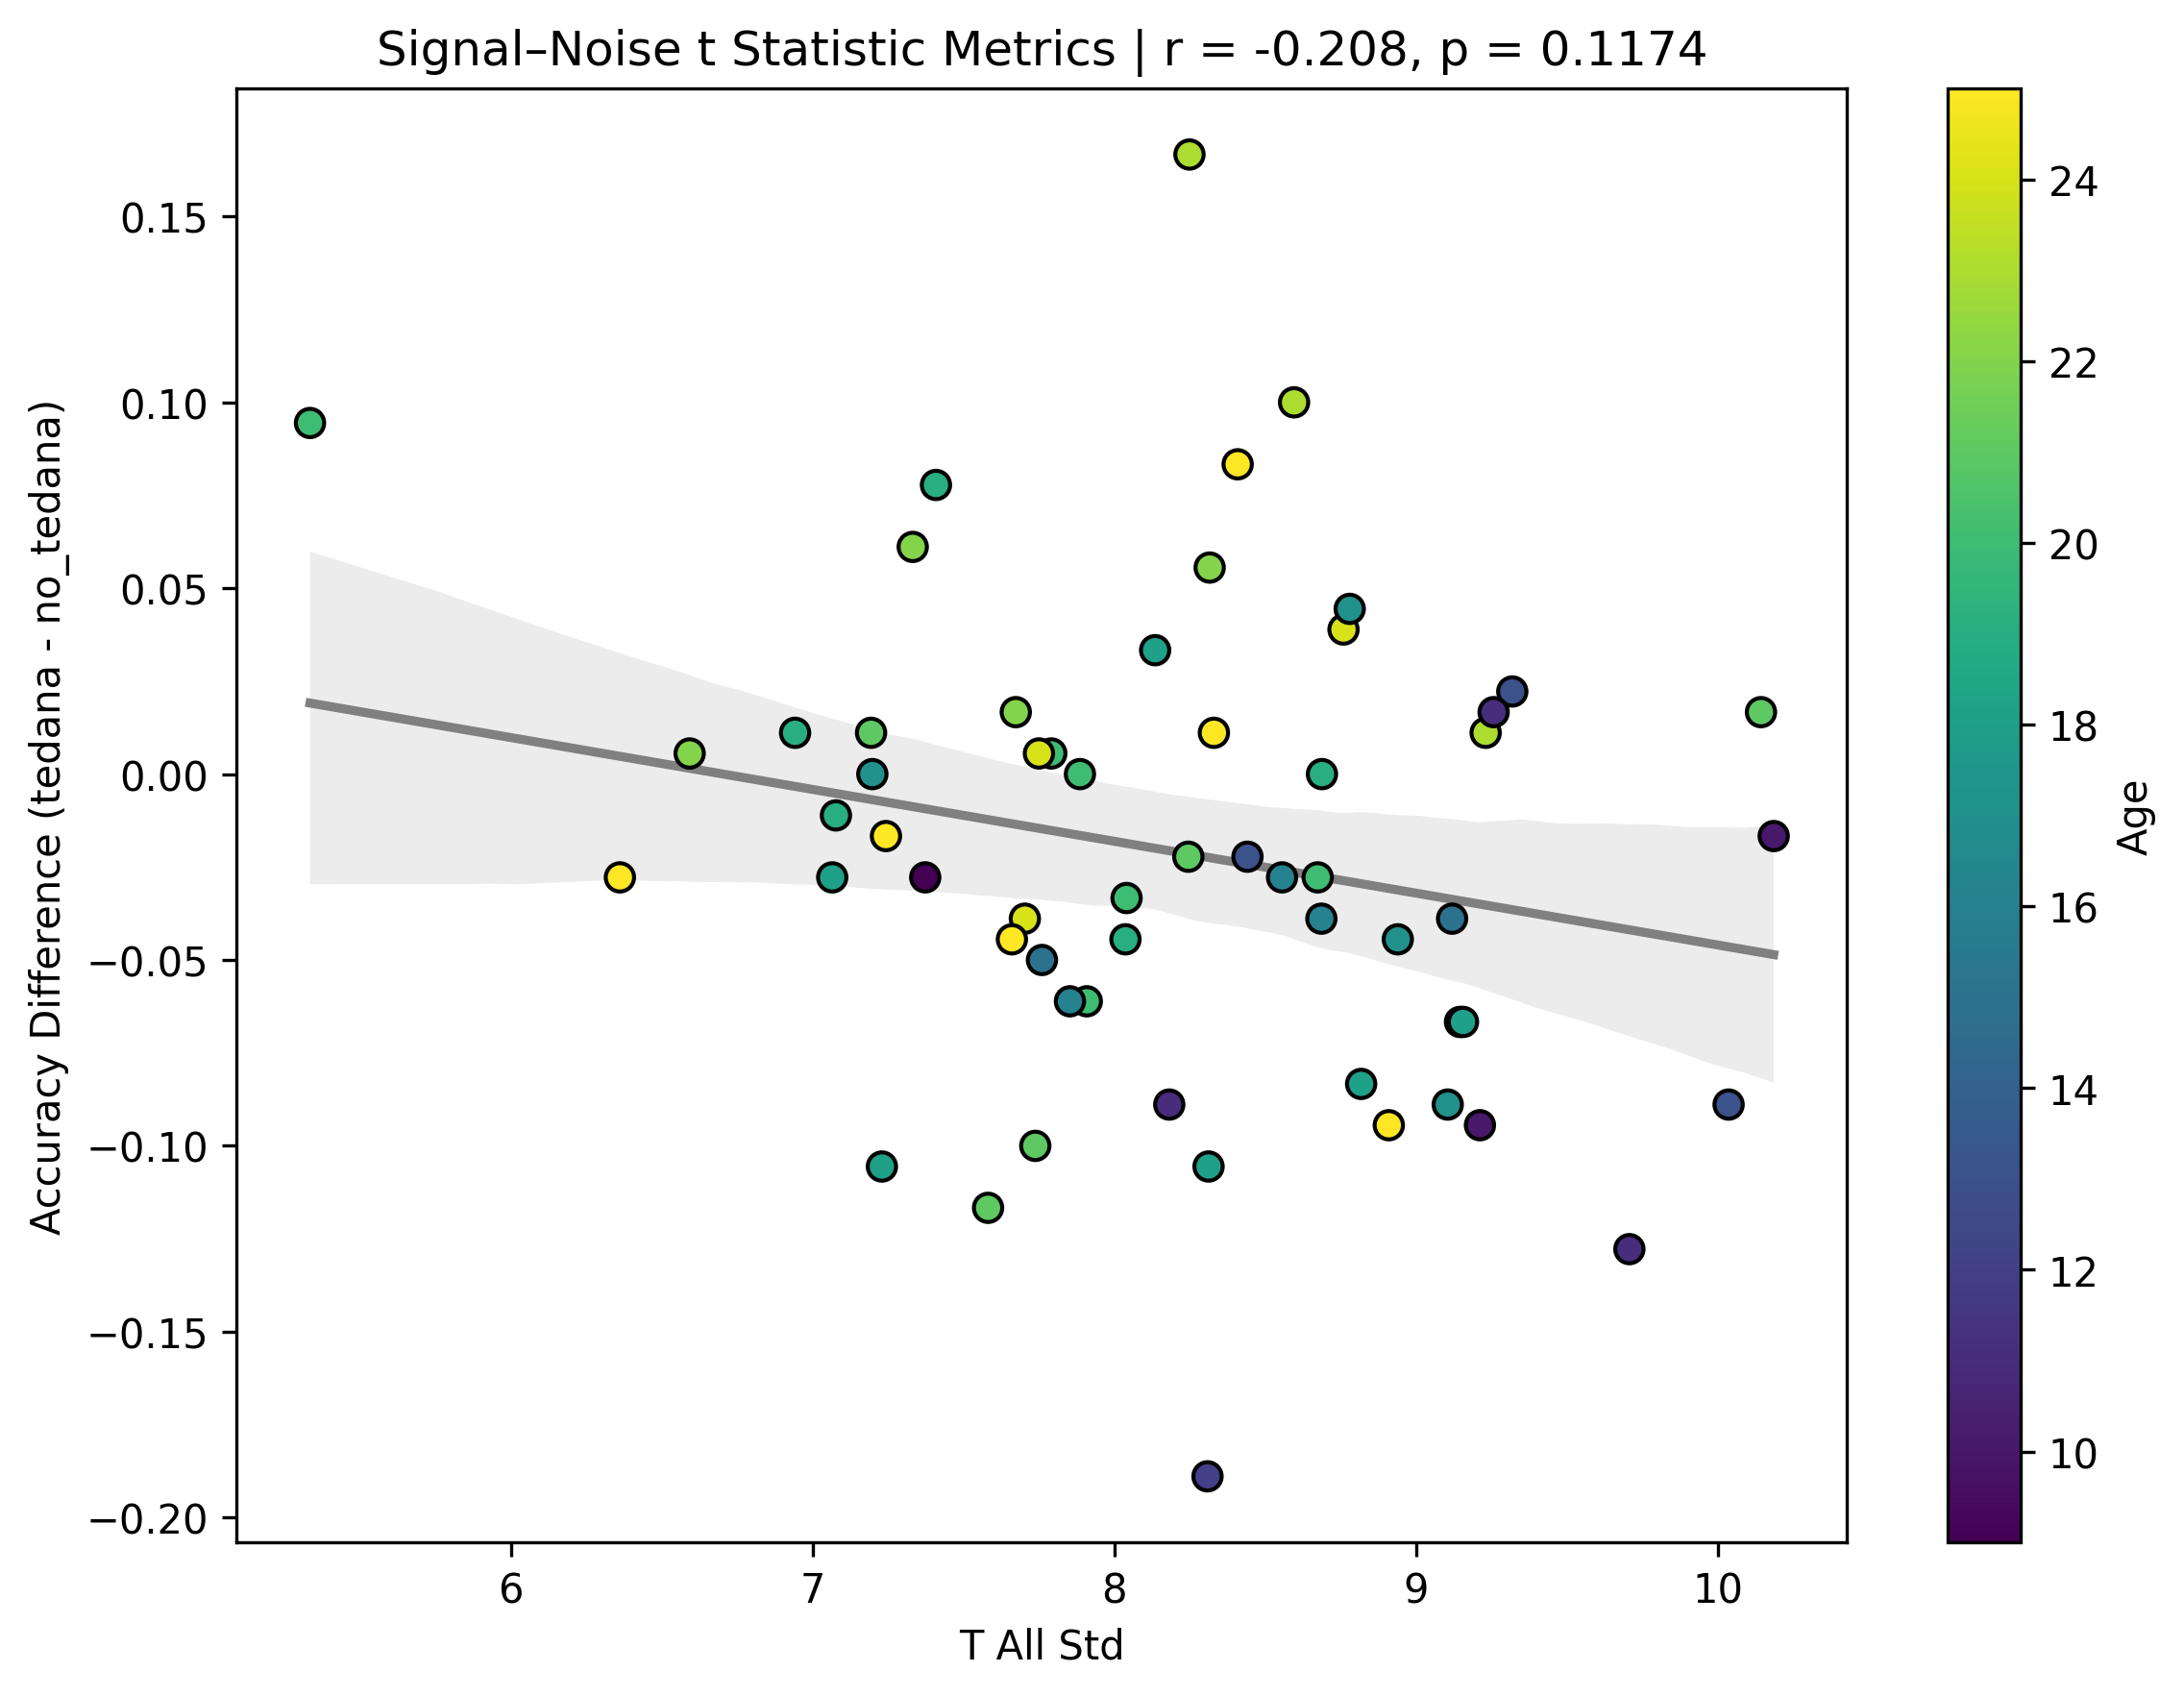
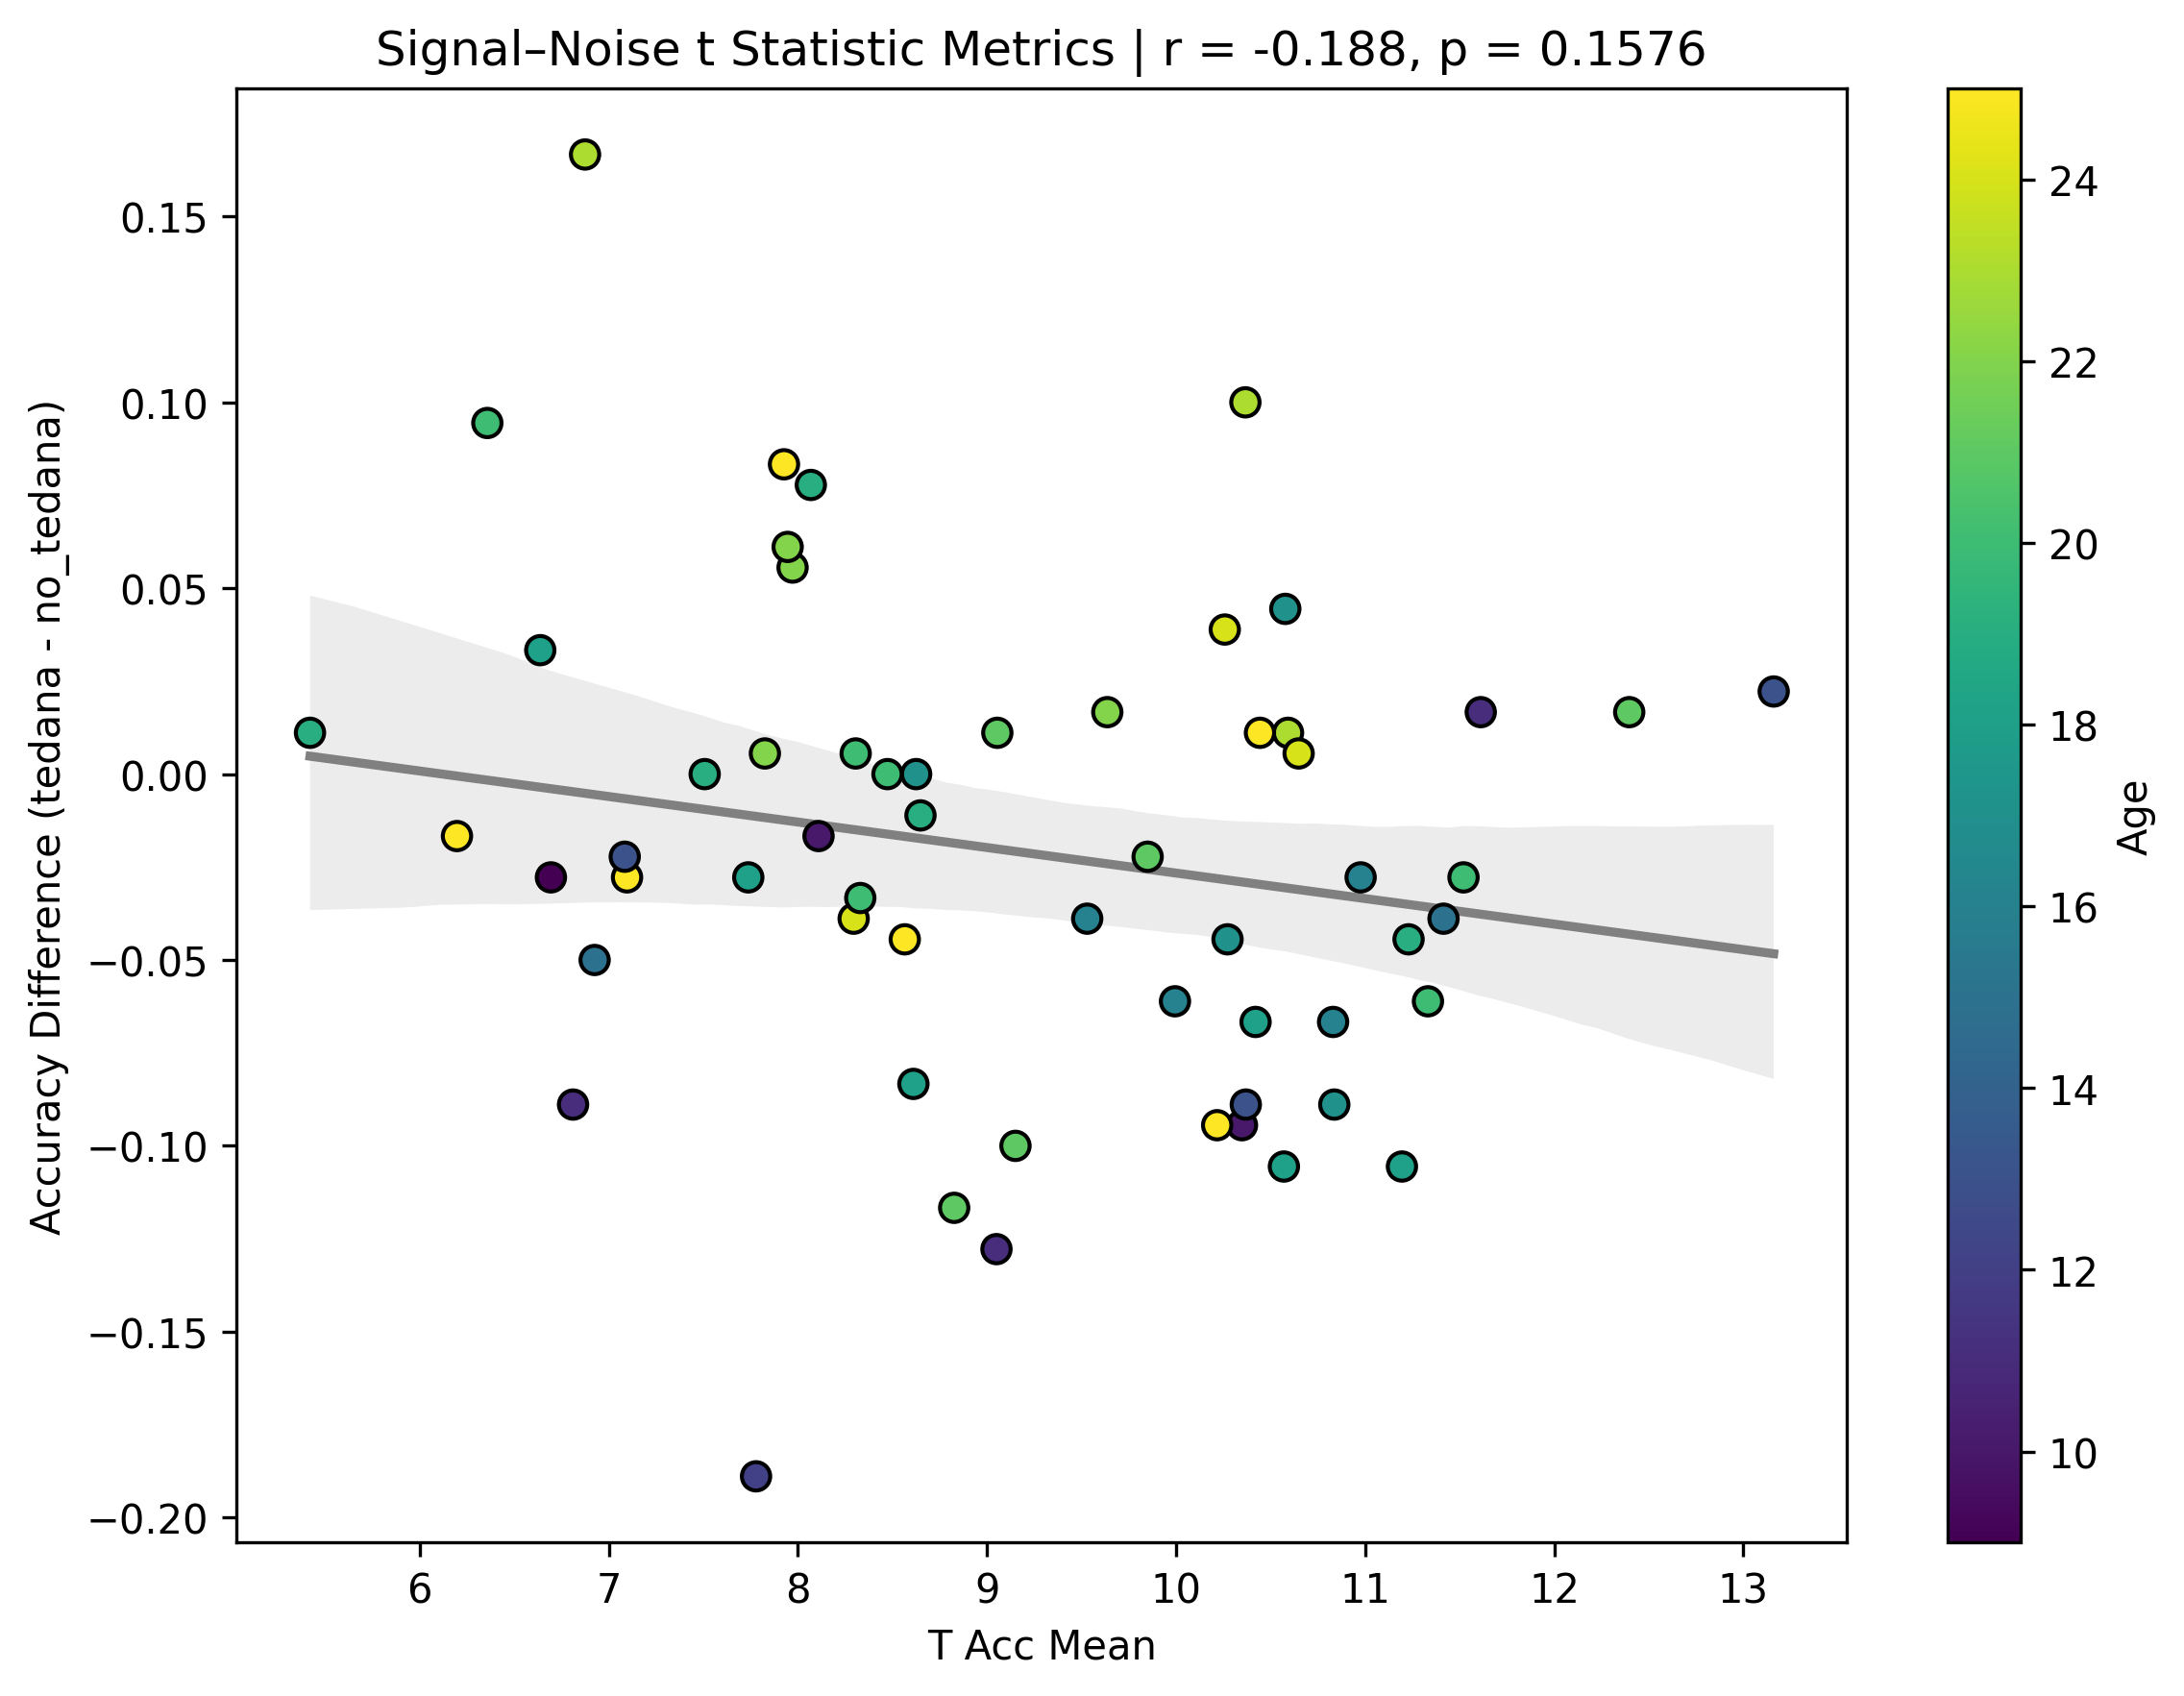
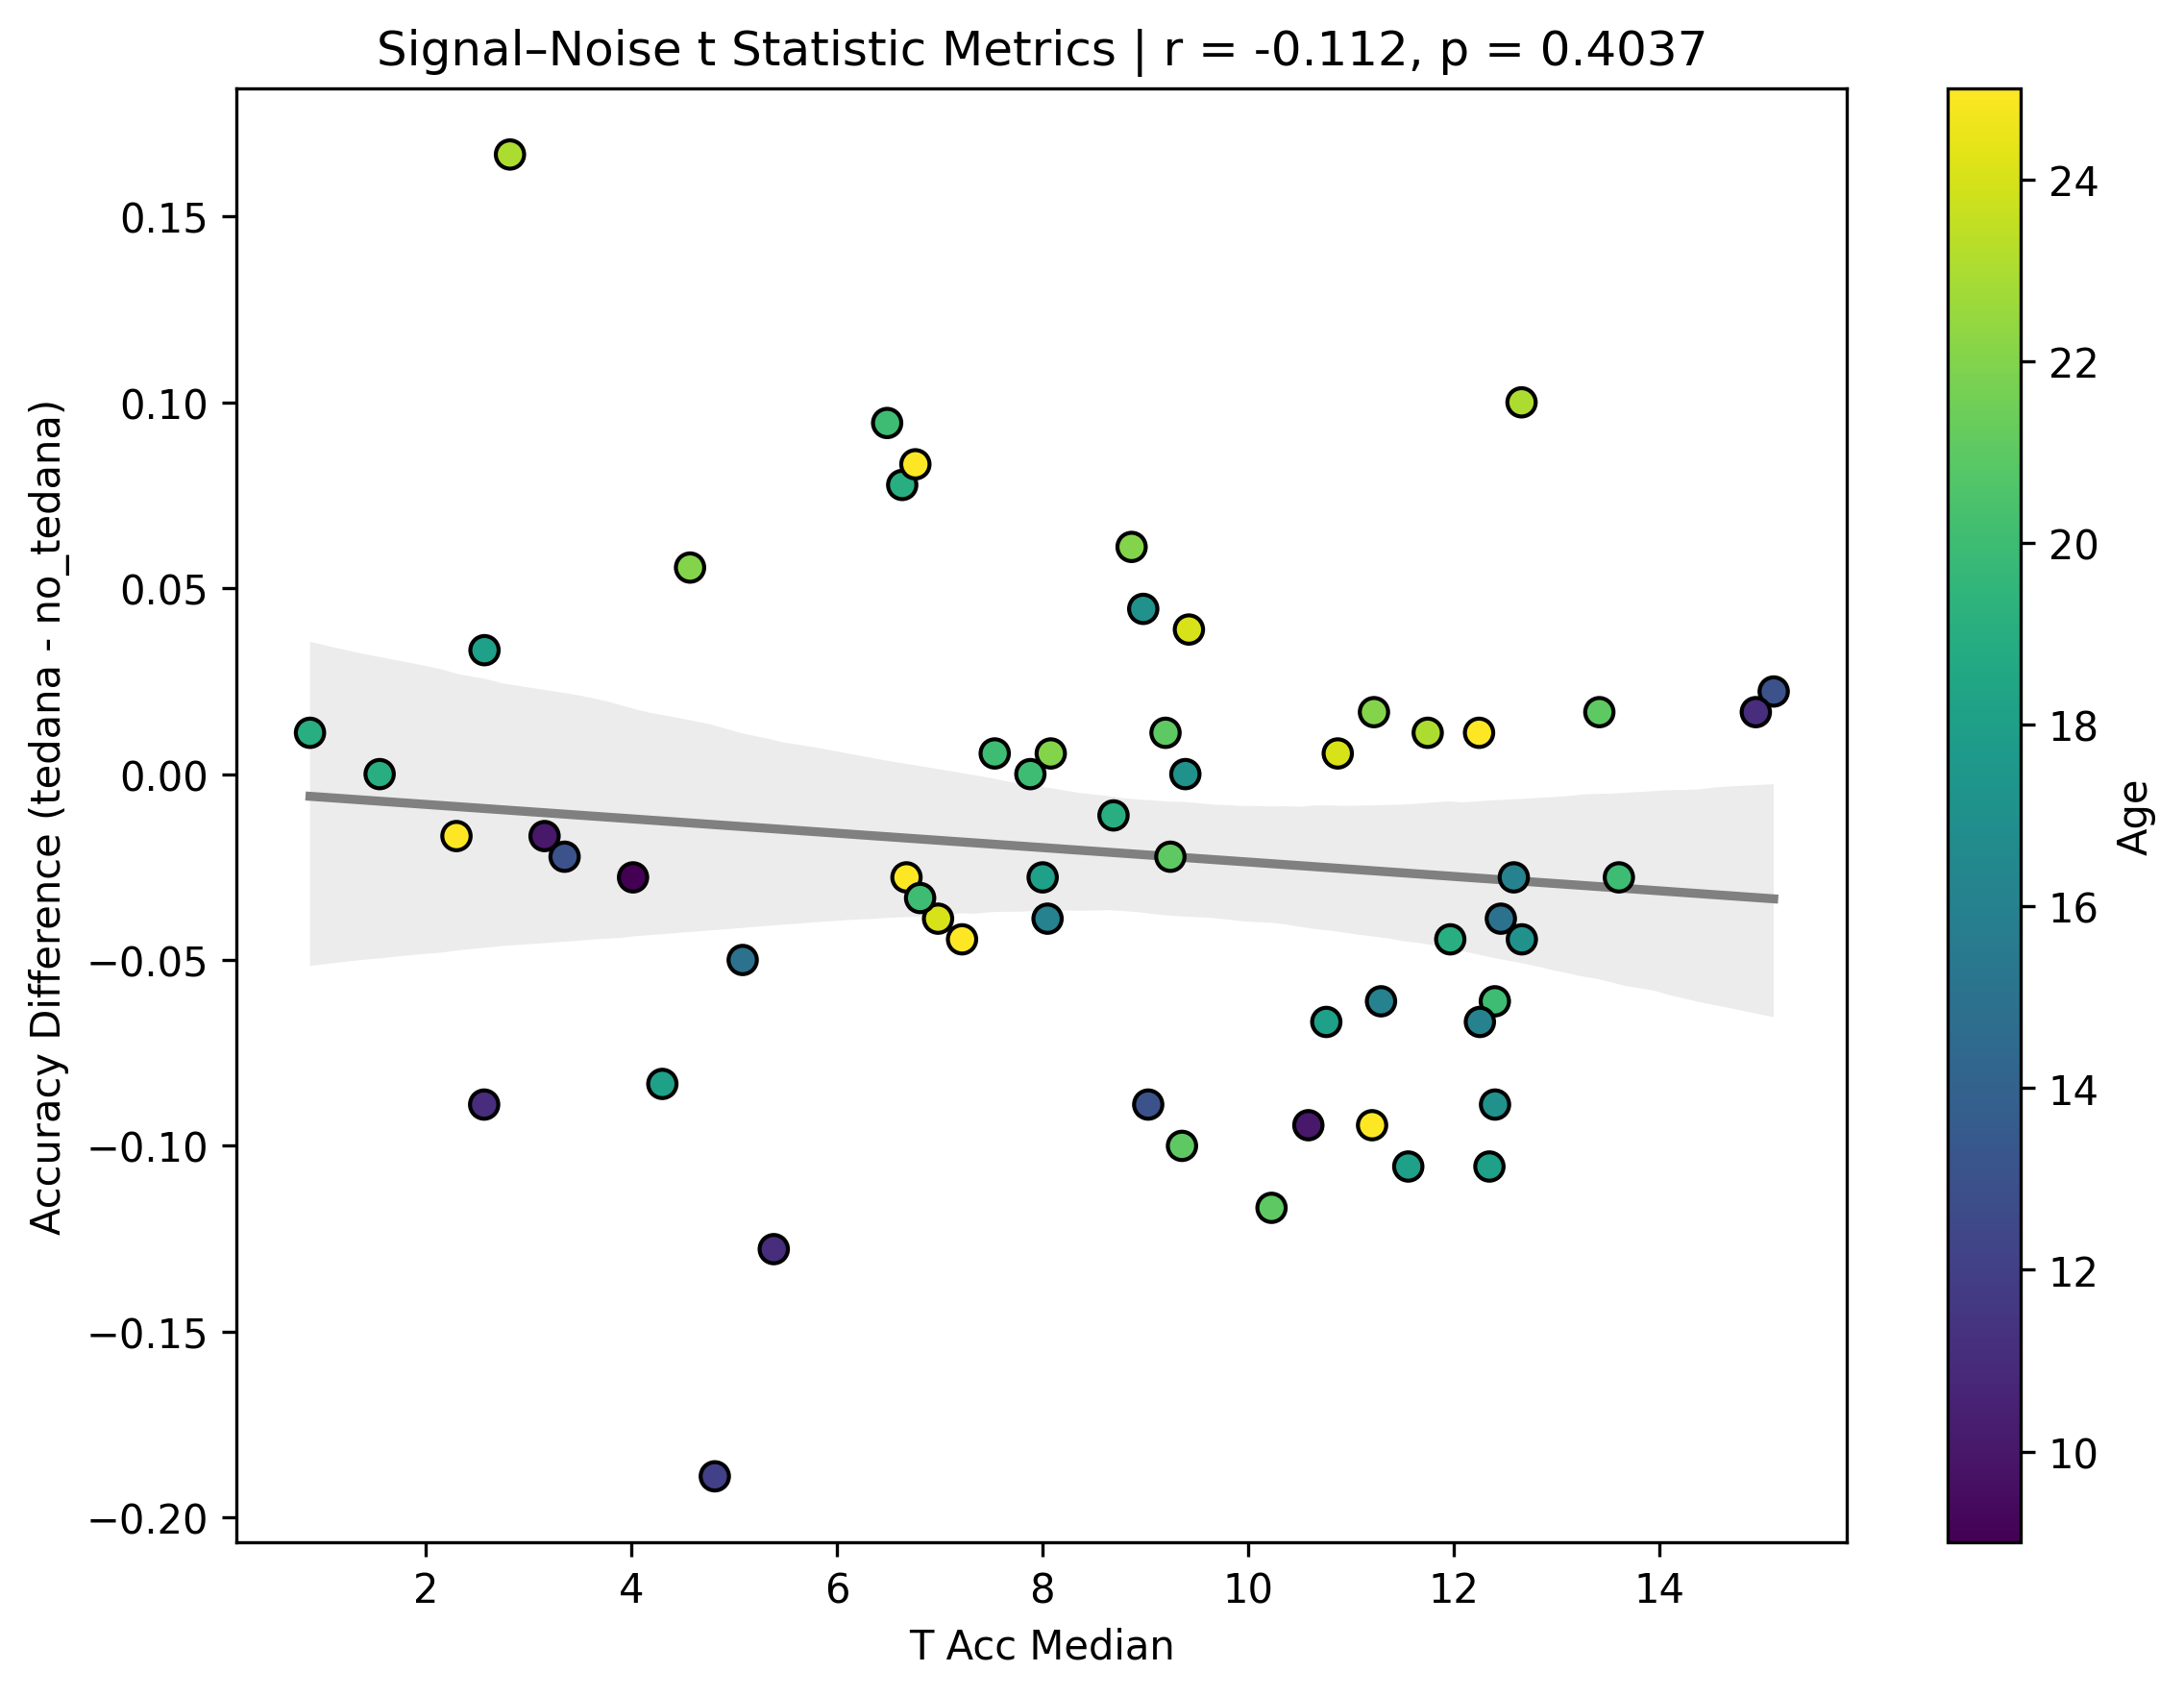
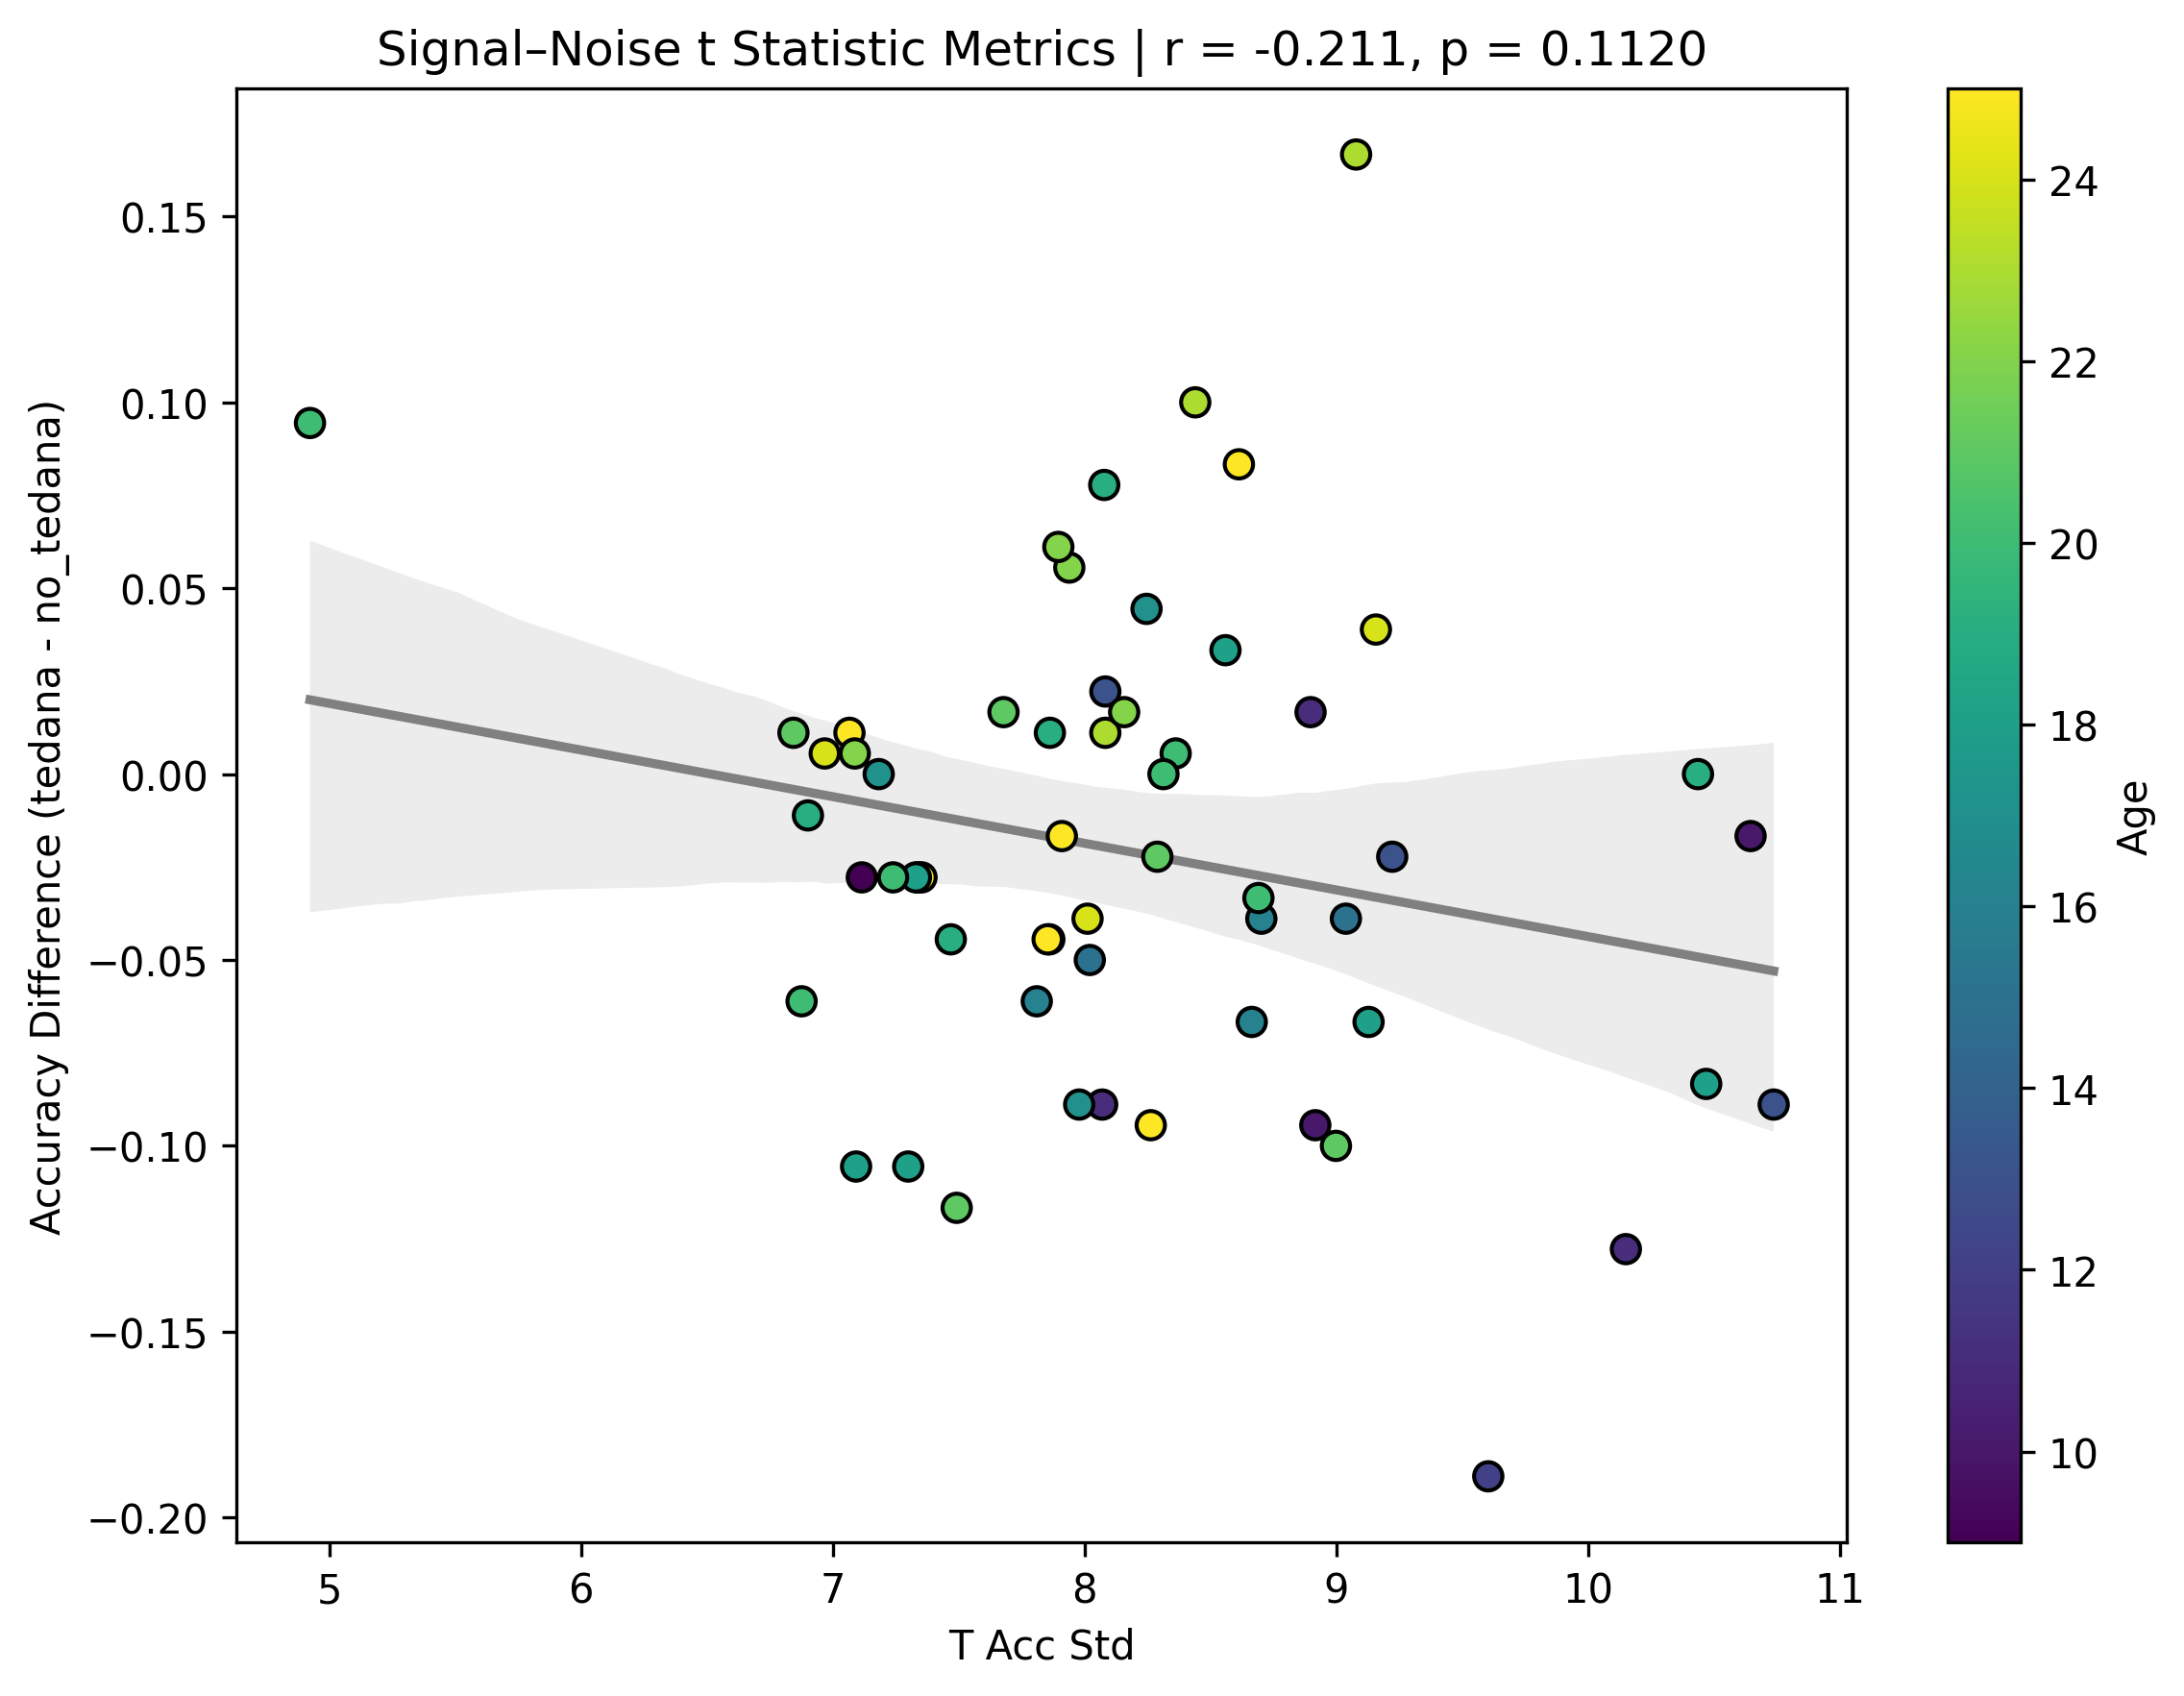
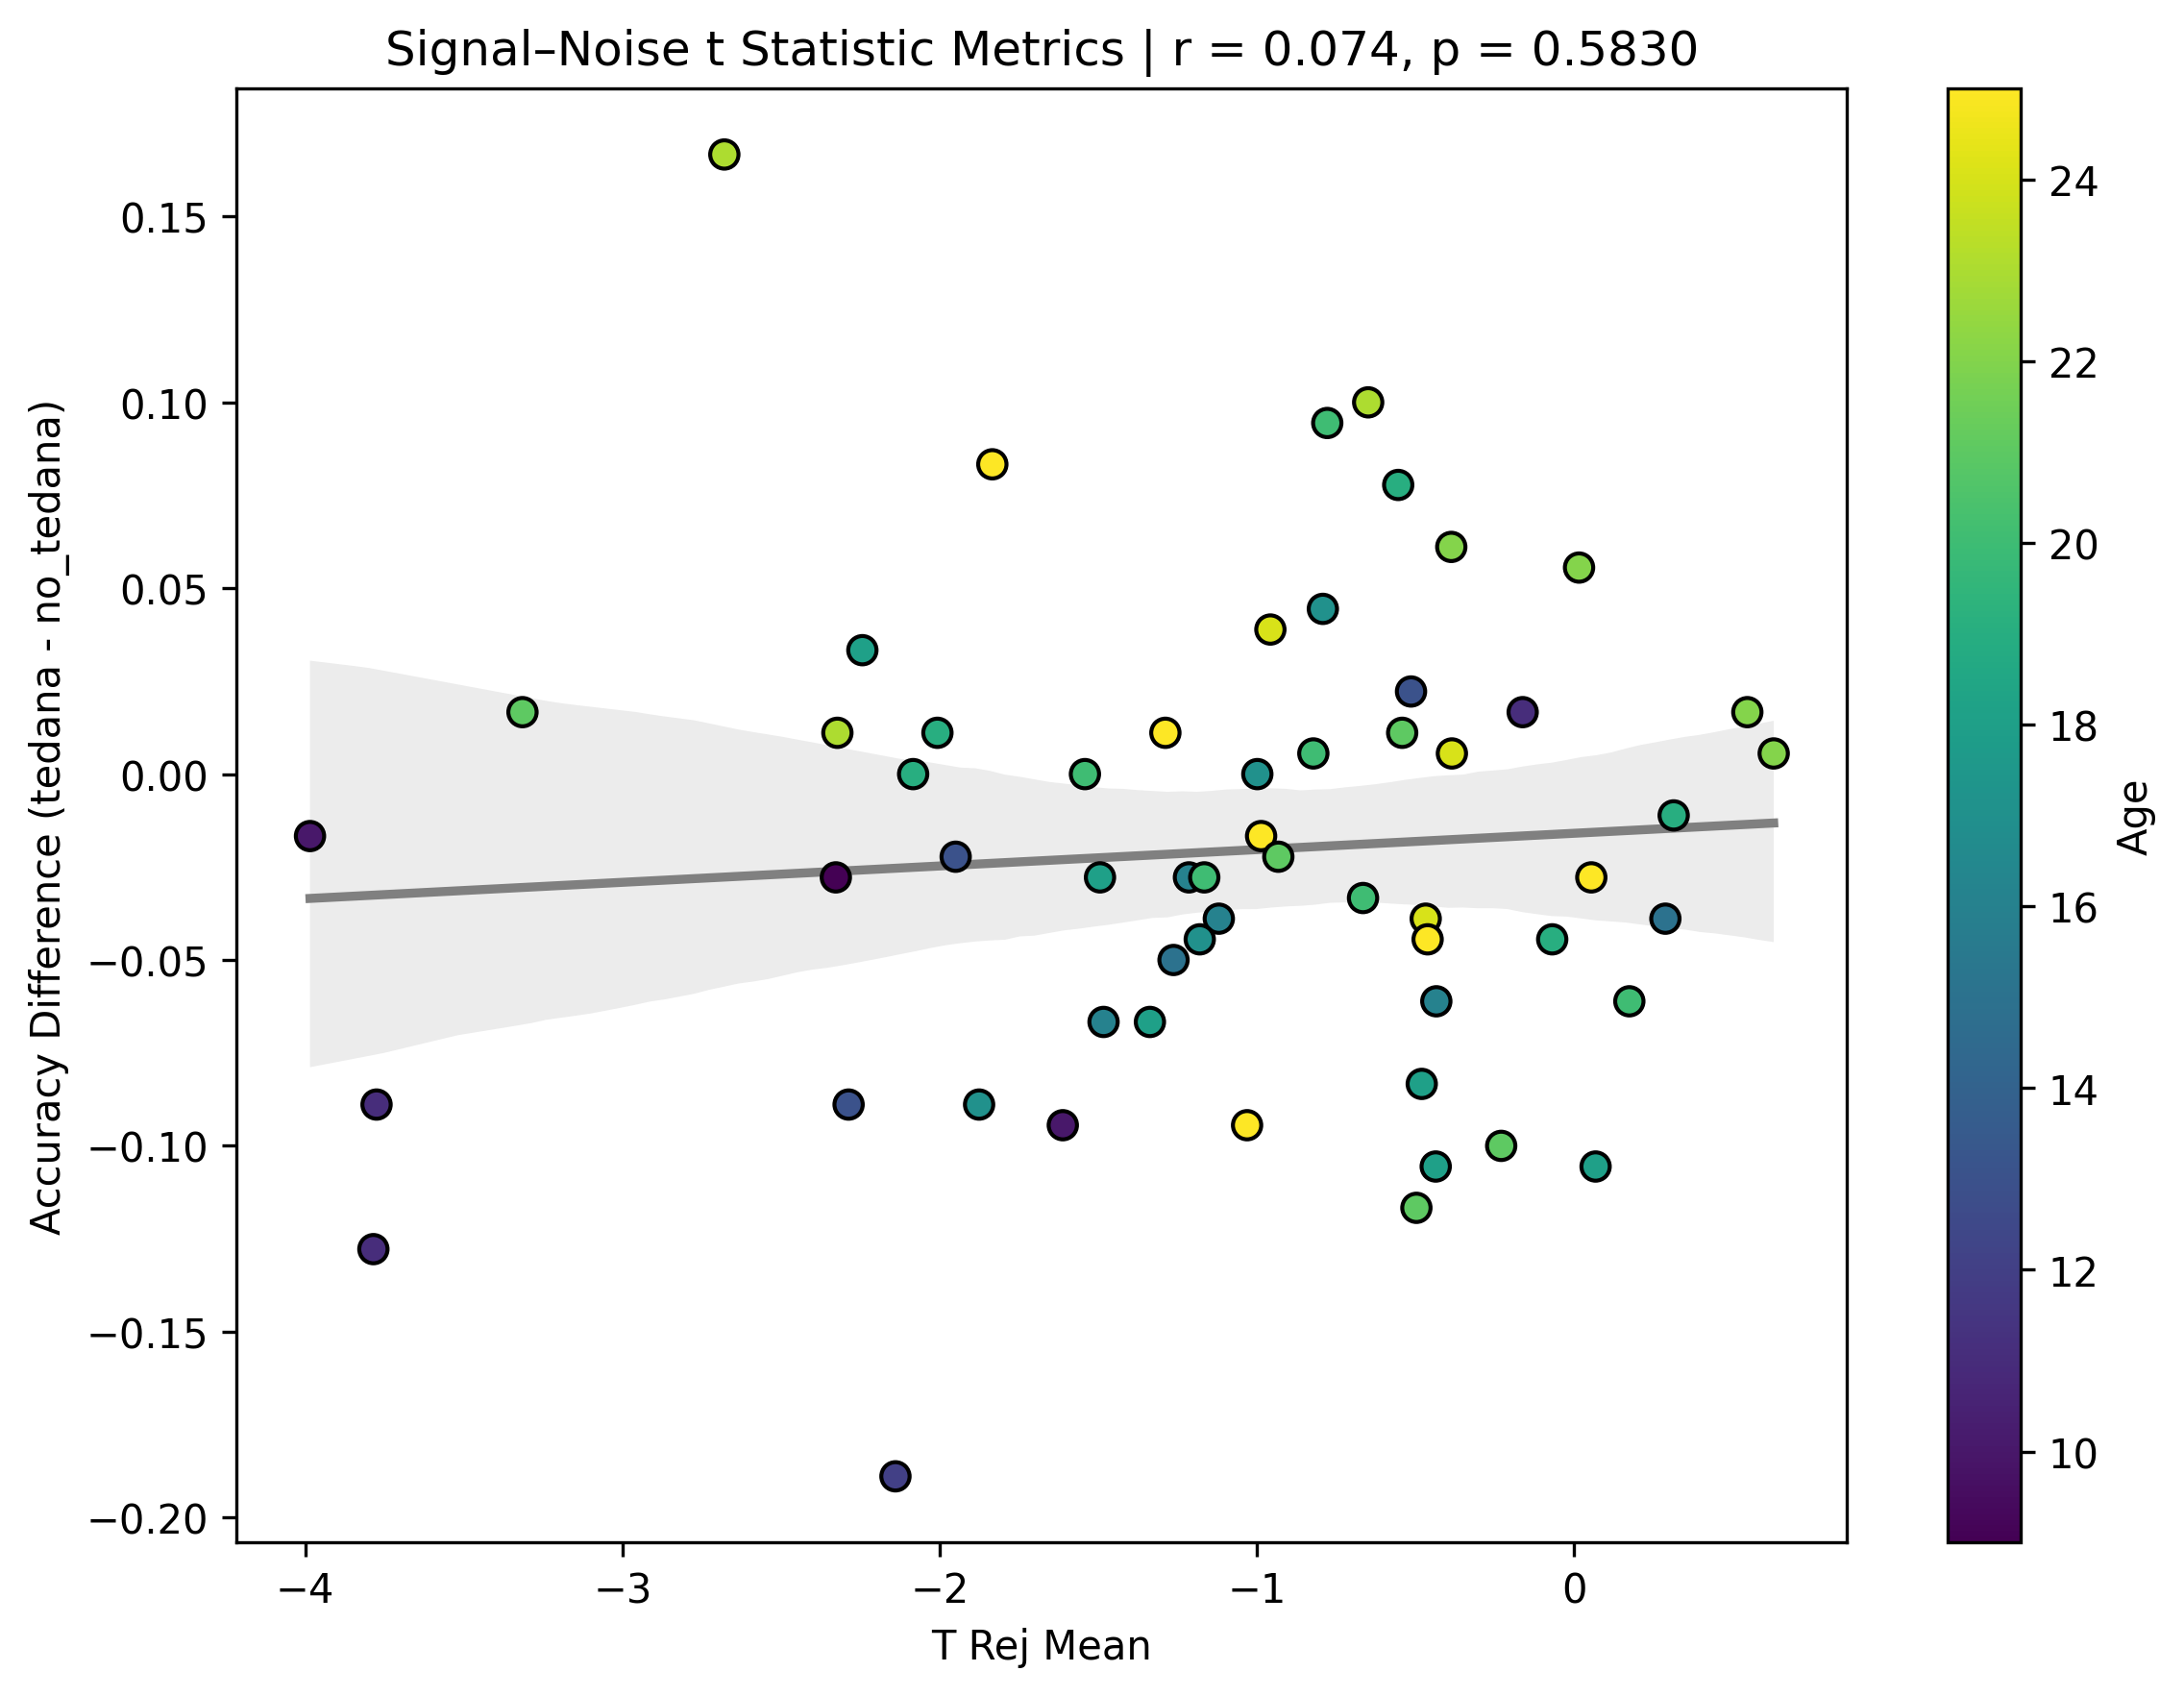
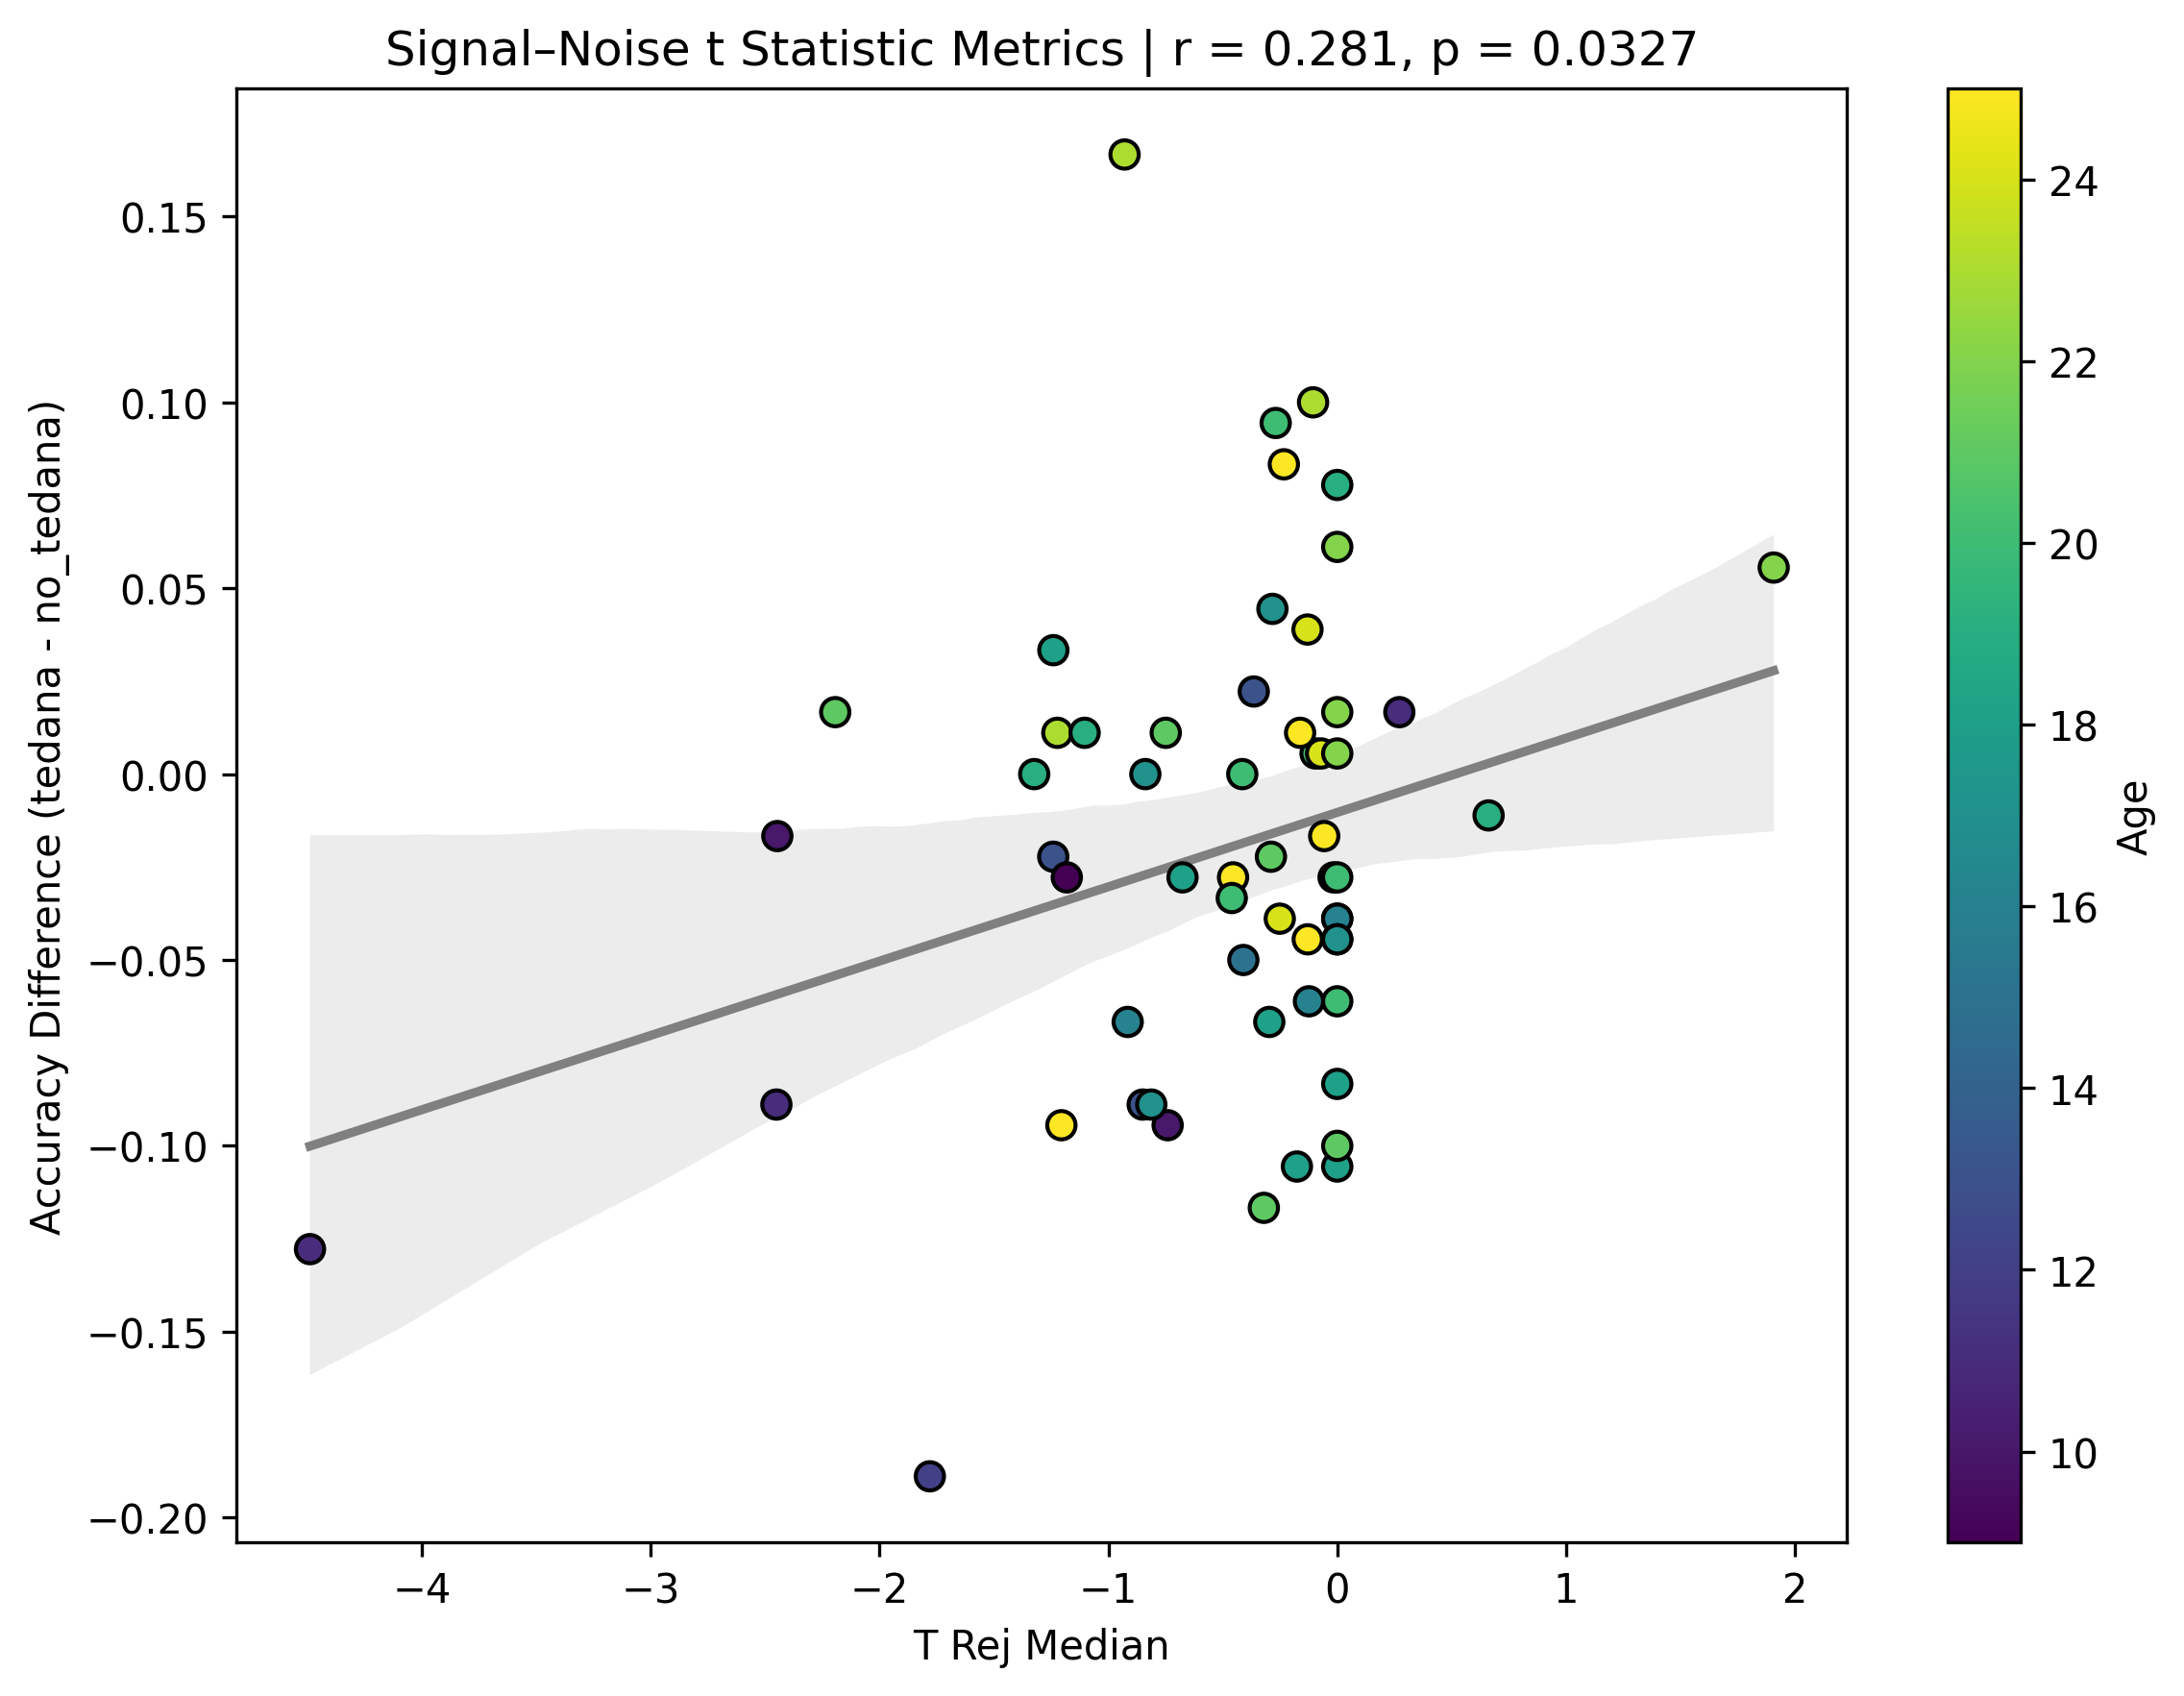
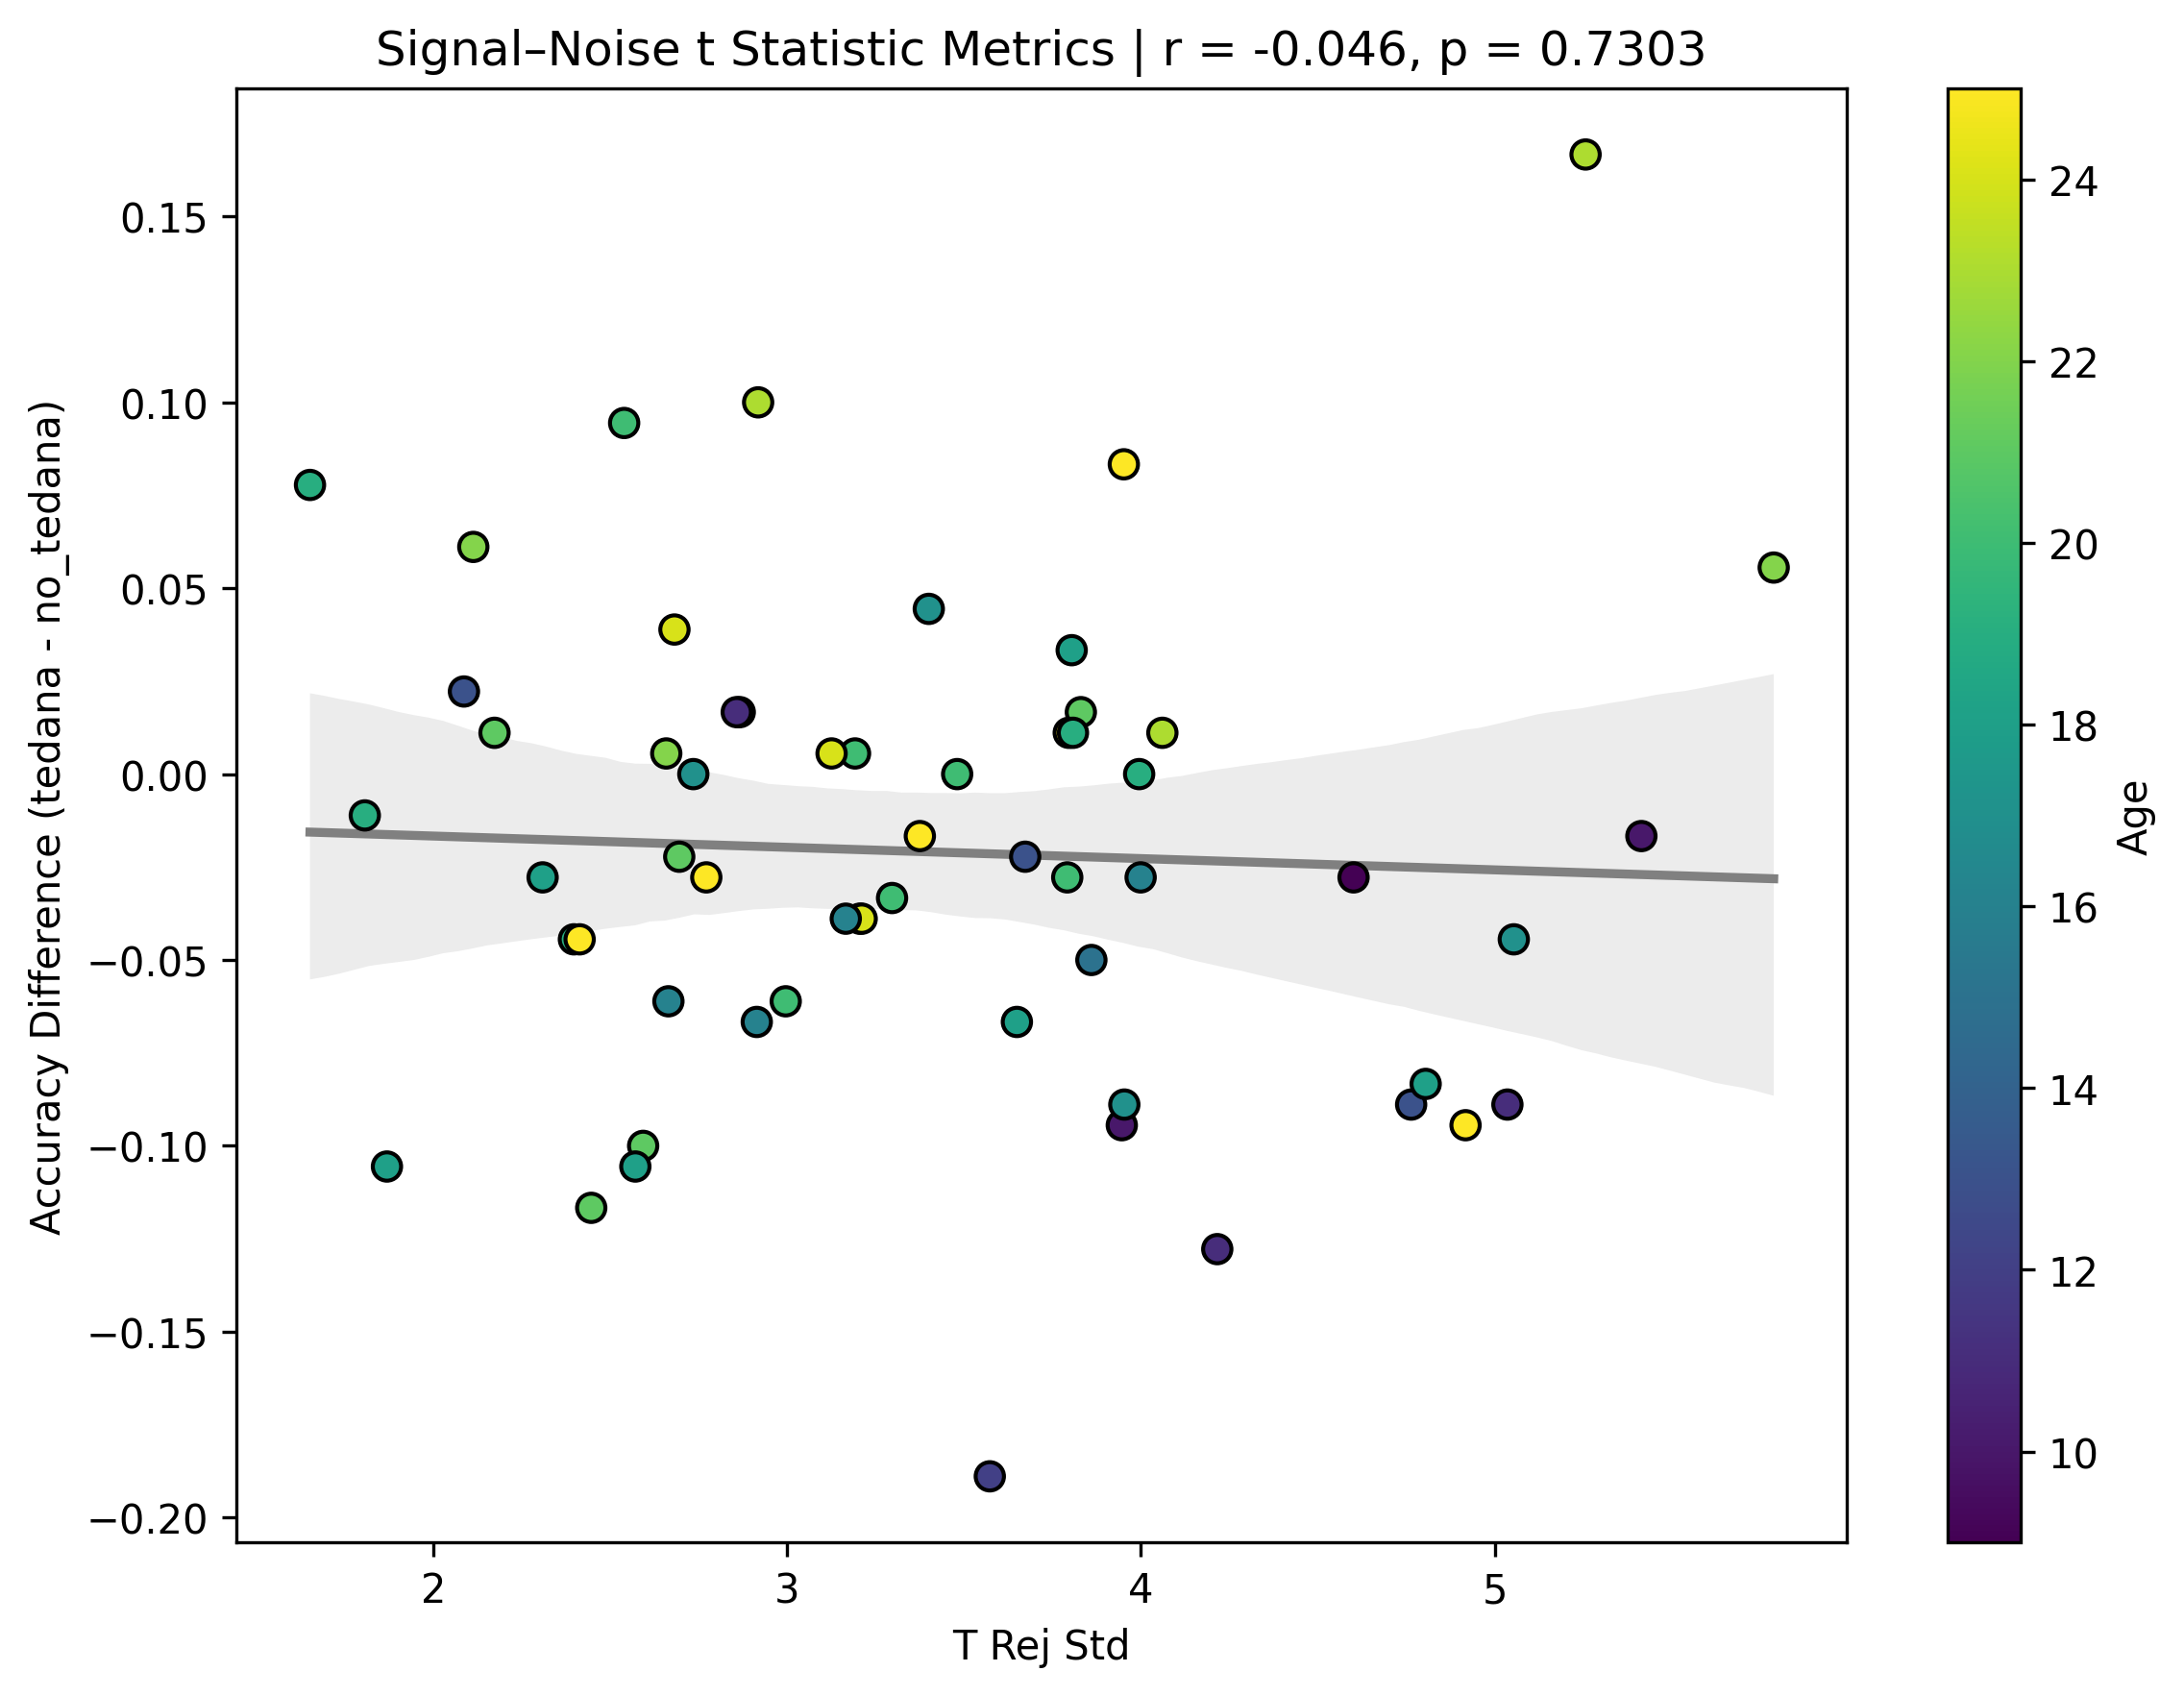
I also looked at the signal-noise_t of each component, calculated their mean, median, and std, and also correlated that, across total, accepted, and rejected components.

I’m not exactly sure how to interpret this. The stronger effects here seem to be driven by children’s data, who tend to have a lower median t-statistic for rejected components, and a higher t-statistic for accepted components.

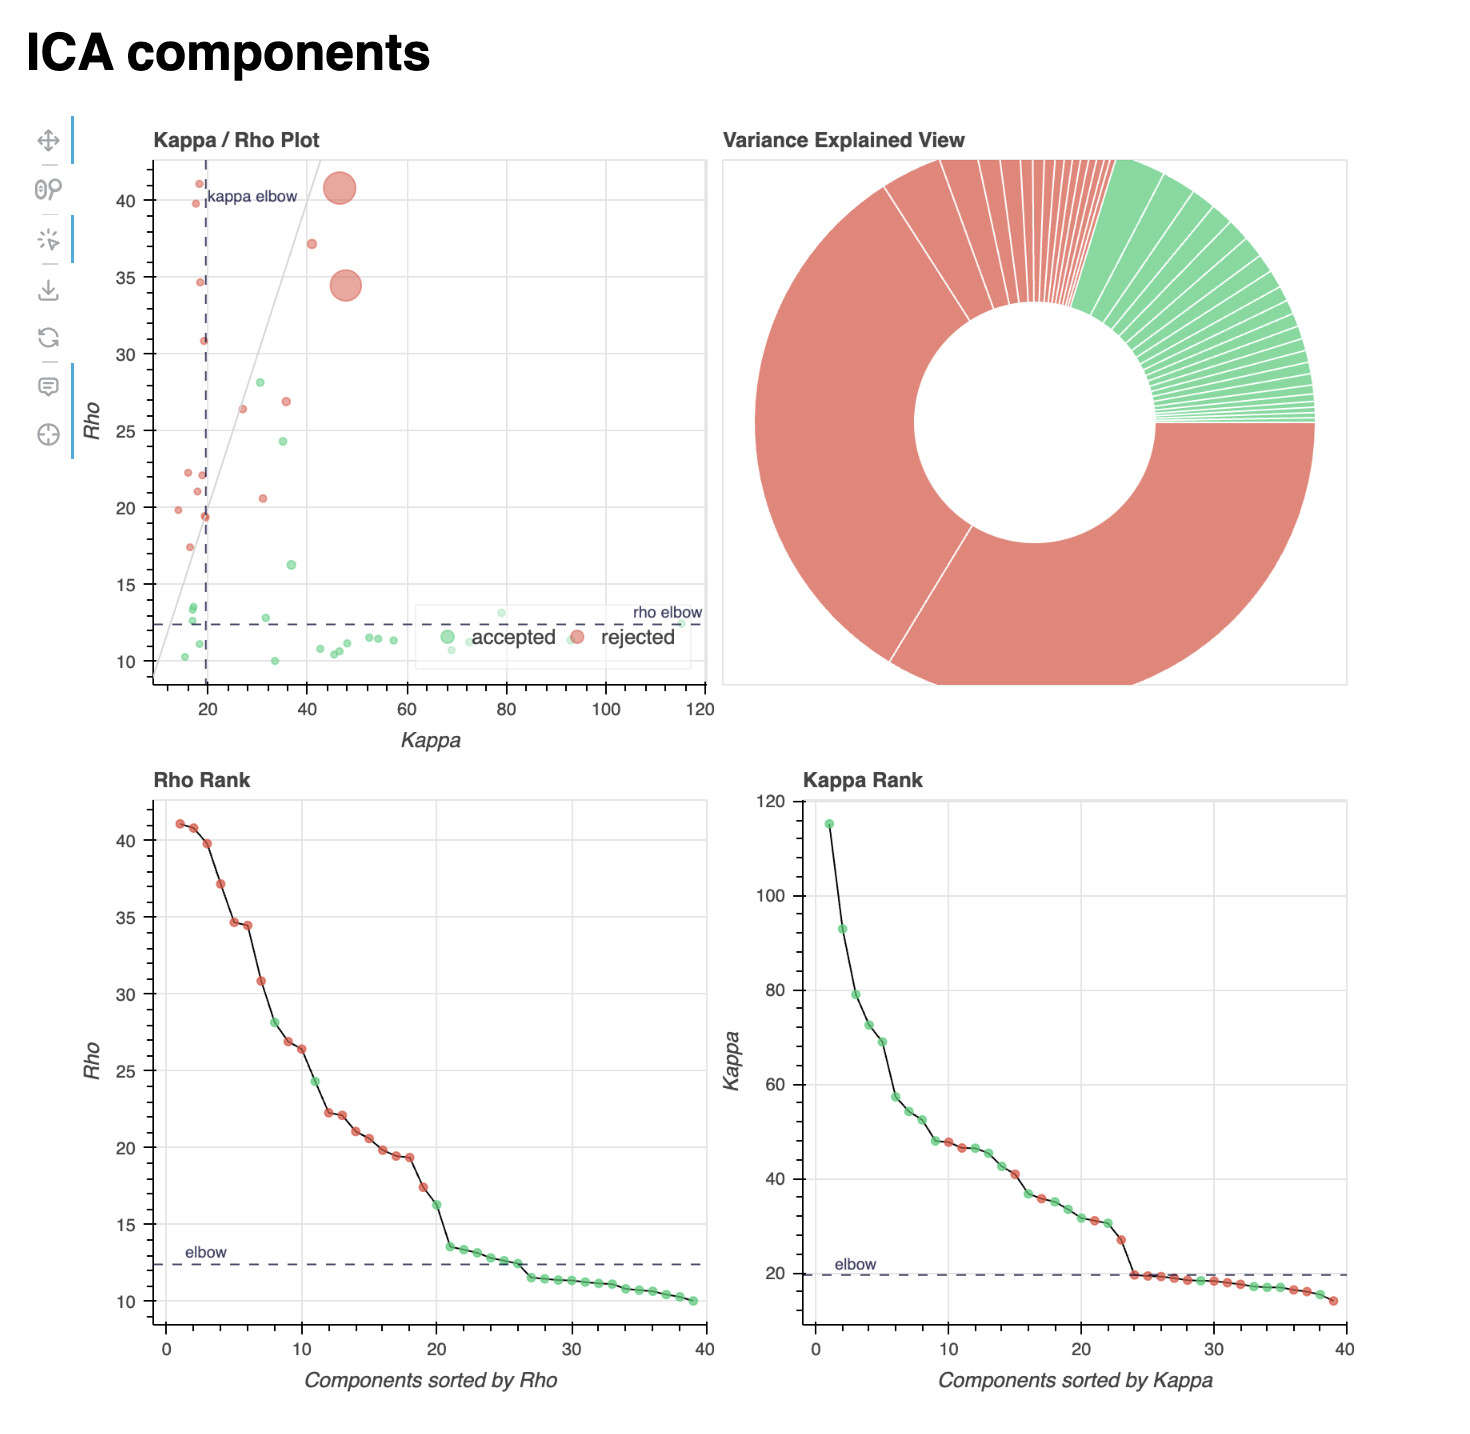
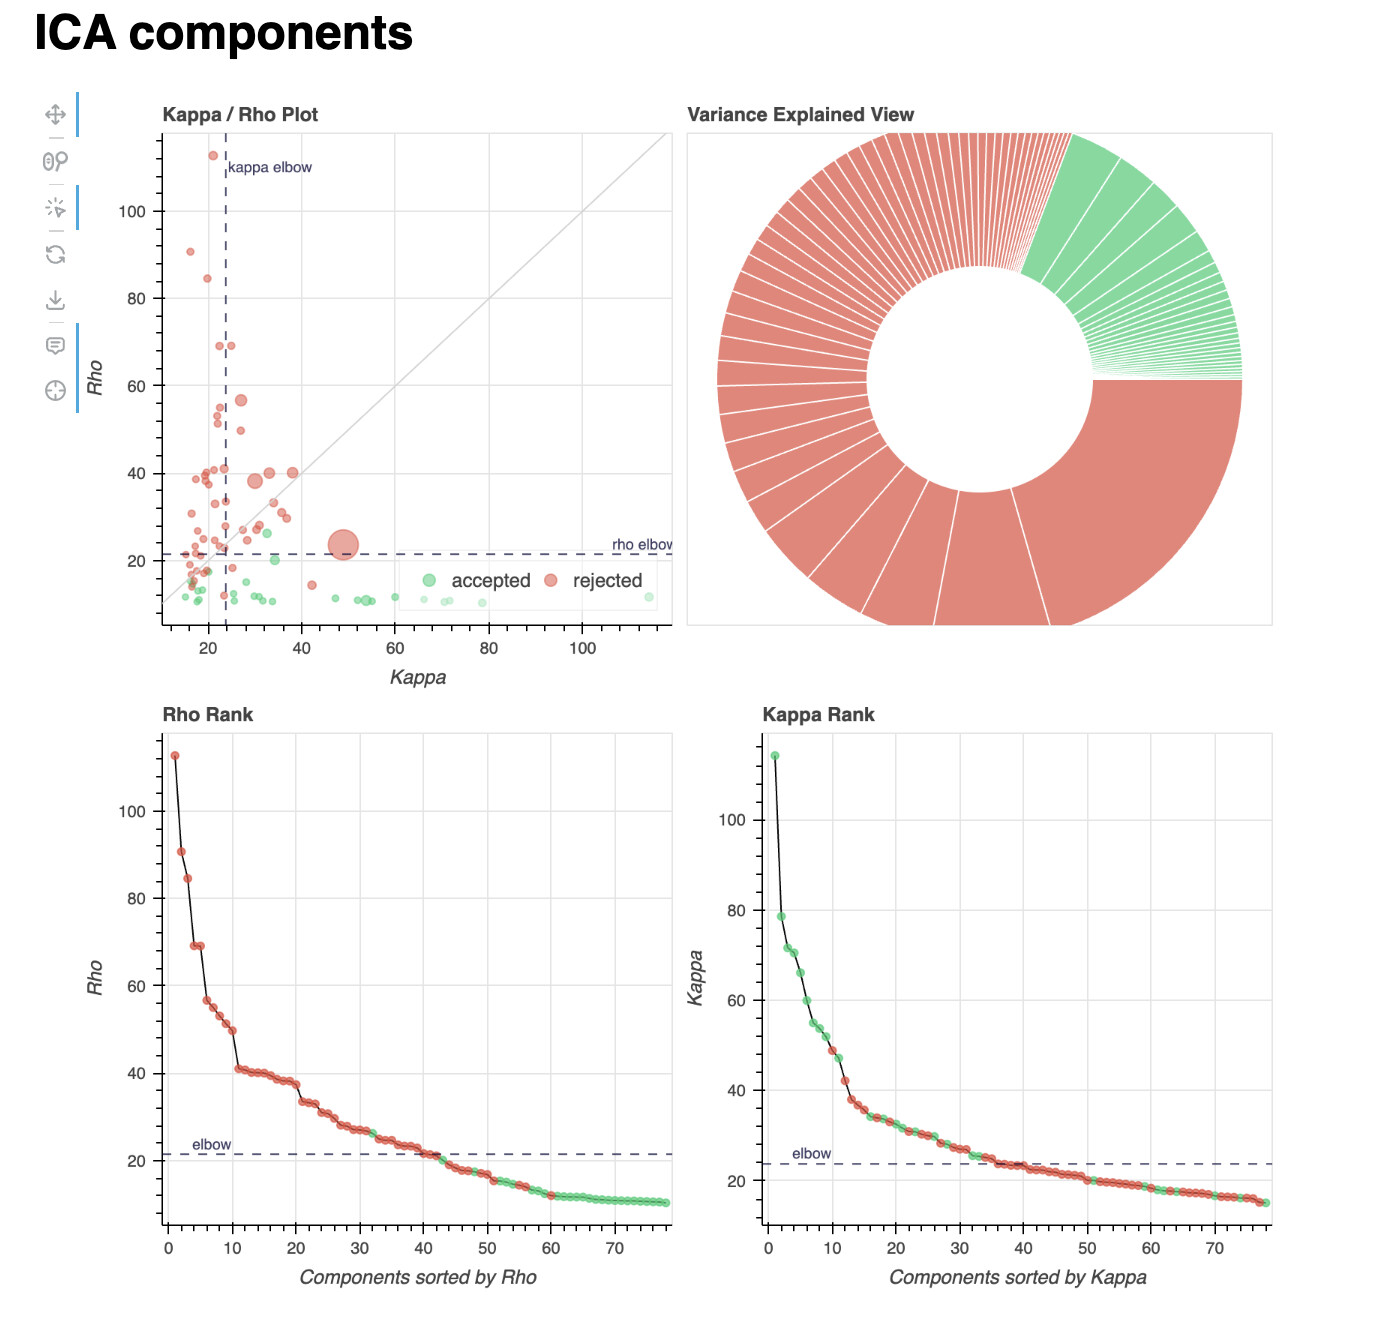
Lastly, I’ll add the component distribution of two example subjects: one showing a high classifier accuracy difference (84% vs. 74%, 10% difference, age = 23), and one showing a low one (64% vs. 83%, -19% difference, age = 12). These are the reports of a single localiser run, but all runs within each subject show a very similar distribution of components.

Subject with a higher tedana accuracy:

Subject with a lower tedana accuracy:

The component distributions in these subjects seem to concur with the broader analysis described above.

In light of these observations, is there a method within tedana to further reduce component rejection? Would you recommend we run manual classification of sorts – as in, reclassify N (or top N%) components closest to the elbow as accepted, and run denoising one more time? Would limiting the number of components PCA can create to a lower number be appropriate here? Maybe around 40-50, which would leave most subjects’ components unchanged.

Additionally, do you have any suggestions regarding running denoising on children’s data? Is there a standard way of implementing the tedana pipeline with children that you could refer me to?

Ultimately, we are trying to determine if tedana would provide an advantage for our analyses. We haven’t run any univariate analyses yet so it might be too early to say, but if using tedana requires extensive extensive manual adjustment, we aren’t sure whether the benefits would justify the additional complexity. Is there a point at which you would recommend we stop trying to make tedana work better, and stick to using the optimally combined data without any denoising?

Thank you very much in advance!! And again, very sorry for such a lengthy post.

Nikita

Hi Nikita,

Just a quick question before I read your post fully. Could you share a plot showing how many subjects you have per age bin? I am wondering of you have some unbalance that could explain the age-related differences you see.

From my experience, the tedana denoised data always looks so much better than the non-denoised data. Whether your model can benefit from this denoised data or not, I cannot tell.

Regarding your comment about fixing the number of PCA components, this is something I used to do in my analyses to avoid having different amounts of ICA components across subjects that you get when using AIC, MDL or KIC. It is hard to tell what that magic number is without looking at the data though. You could try seeing how it goes with 50 for a few of your subjects of different ages, and see if the denoised data you get looks good.

Best,

Eneko

Hi Eneko,

Absolutely! Sorry for not including it earlier. Here you go:

The imbalance is undoubtable there, but I’m not sure if it would necessarily explain all the imbalances. Are you suggesting that once we collect more data with children, the difference in accuracies may reduce/disappear? I’d assume even with a smaller sample, tedana denoising would at least preserve the same classifier accuracy as opposed to lowering it.

I did run a paired t-test only using adults, and found no significant differences:
Adults (age > 18): n = 32
Mean tedana accuracy: 0.78%
Mean no‑tedana accuracy: 0.77%
Mean difference (tedana − no): 0.01%
t = 0.3889, p = 0.7000

Very significant in children, however:
Children (age <= 18): n = 27
Mean tedana accuracy: 0.73%
Mean no‑tedana accuracy: 0.78%
Mean difference (tedana − no): -0.05%
Paired t‑test: t = -4.9897, p = 0.0000

This also makes me think something wrong is happening with denoising in children.

Hi Nikita,

I think that is the same figure as before? I was hoping to see how many subjects you have per age bin.

I do think that as a rule with any ML/AI model, the data that is used to train the model should be balanced to avoid unbalances in results.

Now, without seeing what your model’s input is, it is hard for me to get an idea of what could be going on here. But I would try looking into the differences between say one of your 9y.o. subjects and one of your 25y.o. subjects, with and without tedana. If you are using the time series as an input (I assume you are), then I don’t see how the better tSNR wouldn’t help your model get better accuracies.

I would be happy to jump on a call and take a closer look if you think that would be helpful. It’s a bit challenging to understand this without looking at the data and understanding your model better. Feel free to email me at eneko.urunuela at ucalgary.ca

Hi Eneko,

The figure is similar to the one before, but with group sizes printed in black at the bottom of the bars (e.g., the 9 year old bin has 2 subjects).

I’ve done the comparison between some of them (an example is outlined at the end of my original, lengthy reply), and it seems that the main issue is that more components are being created, and rejected, in children. I’d love to talk over zoom, really appreciate your willingness to help!! Would make things much easier. I’ll send you an email right now.

Hi Nikita,

Thank you for all these detailed results. I core issue is that we like to think that ICA neatly divides data into bold-weighted and non-bold-weighted components. It’s wonderful that ICA separates BOLD and non-BOLD signals as well as it does, but the fact that we have so many components with middle-range values for both shows this separation isn’t an inherent property of ICA (A few of us are talking about replacements to ICA which are designed to separate non-BOLD, but there’s nothing close to production quality yet).

You adding observation that there are more mid-kappa/rho components in a younger population is interesting, and could lead to a potential publication if shown in a larger population. I’m not sure why this is happening, but, assuming you are using the same sized voxels, you do have fewer brain voxels in younger volunteers and each of those voxels likely includes more of a mix between gray matter, white matter & CSF. That could make signals harder to separate. That said, I’d also expect fewer total components with physically smaller brains.

One thing that might help is to add --tedort option to tedana This orthogonalizes the rejected components w.r.t. accepted components prior to denoising so that common signal that is in both accepted & rejected components is conservatively retained.

Another potential solution is, if you think the issue is these borderline components, you can create your own decision tree that shifts the borderline. This is possible with any of the trees, but easiest for me to explain with the minimal tree. You can download tedana/tedana/resources/decision_trees/minimal.json at main · ME-ICA/tedana · GitHub and make a local copy with a different name. When you run tedana use --tree [full path to local decision tree].json

This is the point where components are rejected if they are below the kappa elbow.

You can add "kwargs": {"right_scale": 0.9}, to make the provisionalaccept threshold 90% of the calculated kappa_elbow threshold.

Similarly, at the following location, you can add "kwargs": {"right_scale": 1.1}, to make provisionalreject threshold 110% of the rho_elbow

More info on editing decision trees is here: Understanding and building a component selection process — tedana 24.0.2 documentation

I can help make/check a custom decision tree file, if you decide to take the above approach. The end result would be fewer rejected borderline components, which might make results worse when those were noisy components, but better when it was rejecting useful signal.

FWIW, the minimal tree uses a more liberal rho elbow threshold than the tedana_orig and meica trees.

I’ll also mention that we just added a new quality metric that has some overlap with your metric for closeness to the kappa and rho elbows. New QC measure for fit of rejected to accepted components by marlyr · Pull Request #1208 · ME-ICA/tedana · GitHub was merged yesterday. For every accepted component’s time series, the metric gives a fit to rejected component time series. In the examples I’ve seen so far, the borderline components you’re observing tend to have overlapping time series so that you might see accepted components, but much of the accepted signal was rejected in other components. This is essentially a metric showing what the --tedort option would change. We’re planning to release a new tedana version within the month & this will be included, but if you want to be on the bleeding edge, instructions for installing the newest code is here: tedana/CONTRIBUTING.md at main · ME-ICA/tedana · GitHub

Best

Dan