Testing different noise models output from fmriprep - unclear results with ICA-AROMA

This is an interesting thread and I’m curious to hear what may explain the anomalous results…

I just wanted to mention that the use of 3dTproject will probably yield rather different results than fsl_regfilt given the ‘non-aggressive’ approach that the latter typically adopts. It’s also worth noting that ICA-AROMA has been vetted primarily using the non-aggressive method.

Briefly, the main difference is whether voxelwise BOLD data are regressed on noise components alone (this is what you’re doing with 3dTproject, I believe) versus regressed on all timecourses from the ICA decomposition (the non-aggressive fsl_regfilt approach). In the fsl_regfilt case, the partial regression coefficients reflect the association of a noise component with the data in the presence of both noise and ‘good’ components. The signal to be removed is computed by multiplying the partial coefficients for the noise components by the timecourses for those components, summing the results, then subtracting this from the BOLD timecourse.

Here’s a small R function that does the same thing as fsl_regfilt. y is a voxel timecourse, X is the time x components matrix from (melodic) ICA, and ivs is a vector of numeric positions in X containing flagged noise components.

partialLm <- function(y, X, ivs=NULL) {
  require(speedglm)
  #slower, but clearer to the math folks
  #bvals <- solve(t(X) %*% X) %*% t(X) %*% y
  #pred <- X[,ivs] %*% bvals[ivs]
  m <- speedlm.fit(y=y, X=X, intercept=FALSE)
  pred <- X[,ivs] %*% coef(m)[ivs]
  return(as.vector(y - pred))
}

This is a strong contrast to the 3dTproject approach where the association between noise and non-noise signal sources is not considered, which could lead to removal of potentially useful BOLD variation.

Hope this helps clarify at least one part of this anomaly.
6 Likes

Very nice explanation of what is going on. This approach divides the variance shared between noise and signal into the the noise and signal coefficients. In other words some, but not all and not none of the noise/signal shared variance will be removed from the data. How do you think this approach would compare to orthogonalizing the noise components against signal components prior to regression (in other words making sure none of the noise/signal shared variance is removed from the data)?

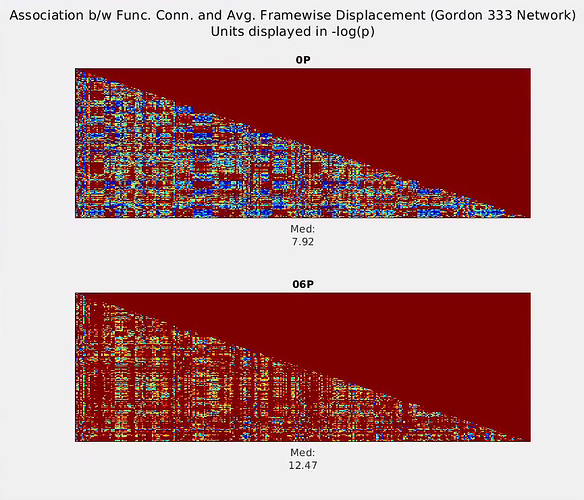
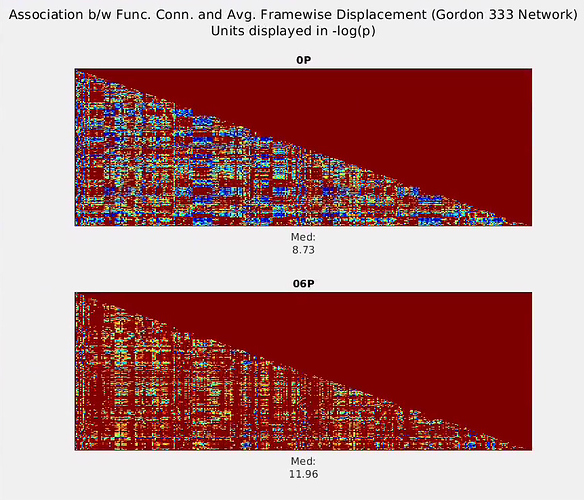
Thank you again @fMRIstats for sharing your insightful paper. I have re-run a couple versions of my pipeline to test the effects of sequential (regression of 6 motion parameters, followed by high-pass filter) versus simultaneous (regression of 6 motion parameters and stop-band regressors) de-noising procedures.

Sequential motion regression–> temporal high-pass .009 Hz:

Simultaneous motion+stopband (.009 Hz) regression:

As evidenced by the plots, regardless of the sequential vs. simultaneous method taken, the association (-log[p]) between Functional Connectivity strength and Frame-wise Displacement is greater when the 6 motion regressors are included (labeled “06P”) versus when they are not (“0P”). I do not point this out to disagree with the arguments made in your paper, but rather I don’t think this to be the bases for the anomalous findings in my data.

I wonder if spatial smoothing (and/or ROI time-series extraction, another form of spatial smoothing) following motion/stop-band regression might introduce noise? E.g., although the time-series of one voxel might be orthogonal to motion parameters, might averaging it with its neighbor reintroduce some association with motion? Is the “best bet” to smooth before motion regression? Or rather to conduct the motion regression on the extracted ROI time-series? I am working on a way to test my speculations, but if anyone has any insight into this question, it would be greatly appreciated!

Just a side note: you can limit the number of ICA components in fMRIPrep using --aroma-melodic-dimensionality 150

Interesting! Thanks for checking. I’ll have to think more about this…

1 Like

Thank you @Michael_Hallquist for the detailed explanation on the non-aggressive (vs. aggressive) regression filtering processes conducted in AROMA. True, the 3dTproject program does not take into account the “signal” components in the regression model and only regresses out “noise” components.

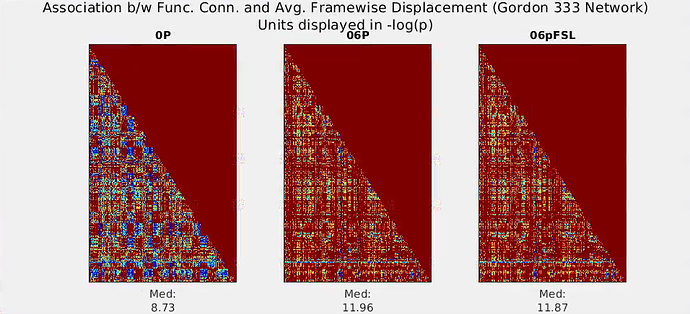
Nonetheless, @jforawe’s above point (posted on 2018-08-30) about functional connectivity from the “06P” model (6 motion parameters as “noise”) having greater association with mean Framewise Displacement than the “base” model (i.e., first 5 volumes removed; 0th, 1st, and 2nd order detrend, filter) is the most puzzling. So, part of my confusion is due to issues independent of AROMA. IF the voxel-wise BOLD time-series are indeed made orthogonal to the 6 motion time-series, wouldn’t one expect functional connectivity (inter-voxel correlation) to have a reduced association with Frame-wise displacement (a linear combination of the 6 motion parameters)? (Note: I’m not directing this question at you specifically, just reiterating the confusing aspect :slight_smile: ). I found a related 3dTproject discussion on the AFNI discussion boards from fall 2016, but I’m not sure it’s the same issue I’m seeing. I also re-ran a highly similar preprocessing pipeline, where detrending was done (AFNI’s 3ddetrend), followed by regression of 6 motion parameters using FSL’s fsl_regfilt, followed by smoothing (AFNI’s Merge), and get basically the same result.

  1. 0P, no regression conducted, “base” model
  2. 06P, regression in AFNI
  3. 06pFSL, regression in FSL

As I posted earlier today, I wonder if part of the issue stems from the fact that, at least with the “6P” data, spatial smoothing (and ROI time-series extraction) occurs after the noise-regression (I’m not sure when its done in the AROMA sequence), and I am curious if spatial smoothing among voxels might reintroduce some of the motion associations? I have no evidence of this now, but hope to in time.

1 Like

Did you ever figure out what was going on here? I have not run into this issue in my own analyses.

2 Likes

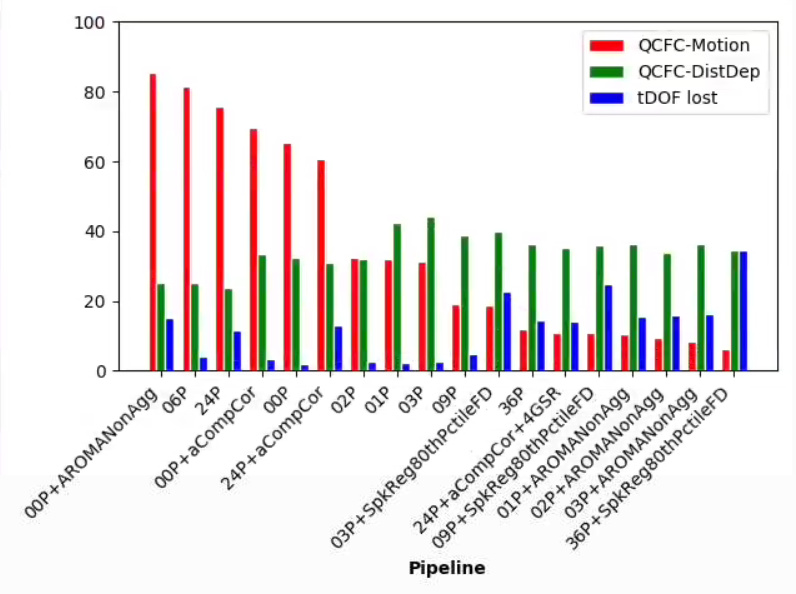
At the moment, I have not found clarity as to what is going on. After several denoising approaches (re-computing the non-aggressive AROMA output, voxel- vs. ROI-wise denoising), I still observe patterns similar to my original post. For the below-explained models, the associations between quality control functional connectivity (QCFC, temporal correlations among Gordon’s 333 ROIs) and motion (mean Framewise Displacement) are worst (largest) for the simple ICA-AROMA model, 6 motion parameter model, etc. Even more peculiar, the association between QCFC and motion for these models is greater than the “00P” model, where only highpass filter cosines and non-steady state outliers were regressed. (I’m developing Python scripts at https://github.com/sjburwell/fmriprep_denoising , if anyone is interested in testing on their own data.)

The below denoising pipeline models regress out the following:
00P: highpass filter cosine functions, non-steady state outlier TR
01P: 00P+global signal
02P: 00P+white matter, csf
03P: 01P+02P
06P: 00P+motion parameters
09P: 03P+06P
24P: 06P+1st difference and quadratic expansion of the parameters
36P: 09P+1st difference and quadratic expansion of the parameters
03+, 09+, 36+SpkReg80thPctileFD: these models, plus spike regression of high motion TRs
00P+, 24P+aCompCor: inclusion of the aCompCor columns
00P+, 01P+, 02P+, 03P+AROMANonAgg: non-aggressive AROMA filtering, done using fsl_regfilt; for 01, 02, and 03 models, global signal, white matter, and csf were estimated after the initial AROMA filtering.


In the above, the red bars pertain to the percentage of edges in the 333 node network significantly related to motion (p < .001), the green bars pertain to the absolute-valued distance-dependence of the functional connectivity (x100, to keep on the same scale as the other bars), and blue bars pertain to the percentage of temporal degrees of freedom lost.

In general, my results are consistent with papers by Ciric et al., (2017) and Parkes et al., (2018), but they do not report 00P models, so I cannot say whether that aspect is consistent or not.

1 Like

When you do the FD - network edge regressions, is this an across-subjects regression?

What do you think you would see if you instead measured FD-ROI regression coefficients within subject time-series as in ROI ~ 1 + FD

I usually find these to be substantially reduced after aCompCor and motion parameters.

This is a tremendously interesting and informative thread that needs to turn into a manuscript (I don’t know how I missed this back in Sept.)

As a separate but related issue, @burwell, have you compared the CompCor outputs to what the CONN toolbox outputs? We have been doing a similar comparison (but looking at voxel-wise connectivity maps, b/c you can ‘see’ when you are getting odd correlations with the CSF/WM, etc… and found that the CompCor outputs seem different than what the original software produces. I’ve been meaning to f/u with @ChrisGorgolewski but had forgotten until I saw this thread. Chris, have you all validated the CompCor implementation against CONN?

We also find the ICA-AROMA outputs to be dramatically different from either ‘our’ standard regression, roughly equivalent to your option: 09P(+1derivatives), and from ~02P+06P+aCompCor

Apologies for the little delay in response.

@mnarayan - Yes, it is a regression of the edge (Fischer-transformed correlation) between two time-series from network vertices (here, Gordon et al., 2016 atlas nodes) onto median Framewise Displacement across the resting-state scan. I took this approach because I believe it closely mirrors the approach that recent “pipeline bench-marking” papers by @rastko (Ciric et al., 2017; NeuroImage) and Parkes et al., 2018 (NeuroImage) have taken. I do believe that examining the association between Framewise Displacement time-series and voxel/ROI time-series would be an interesting comparison; my suspicion here is that “ROI ~ 1 + FD” associations would be strongly related to denoising methods that use the 6 realignment parameters as regressors (e.g., 06P, 24P), as Framewise Displacement is derived from these. That said, given that the variable of interest in most functional connectivity analyses is itself the network edges, I’m most interested in finding the denoising strategies that yield the most reliable and valid edge connectivity value.

Edited: What is most puzzling to me is that functional connectivity / framewise displacement associations are larger for certain denoised data (e.g., 06P, 24P, 00P+AROMANonAgg) than they are for effectively non-denoised data (i.e., 00P). If others have results where they tested “00P” against “06P” models that are convergent to what I’ve found, I would be very interested to hear about them.

@alexlicohen - I have not yet directly compared fmriprep outputs to CONN outputs for the aCompCor method. I’d be curious to know how exactly you’re implementing the comparison, as far as I know, the spatial preprocessing steps in fmriprep (which uses several software packages, e.g., Freesurfer, ANTS) are very different from that of CONN (all SPM-based). Additionally, last time I used the CONN toolbox (~2016), the defaults for CONN included a temporal bandpass filter, and I believe the PCA was conducted separately on CSF and WM regions, whereas the PCA in fmriprep is conducted on the CSF/WM regions combined (an fmriprep developer may want to fact-check me here so I’m not spreading #fakenews)…

A while back (August, 2018 in this same thread), @effigies posted that a/tCompCor regressors are meant to be used in conjunction with the “CosineXX” columns which act as a 128s temporal high-pass filter. The comparisons that I’ve plotted in this thread all regress out the “Cosine” and “NonSteadyStateOutlier” columns from the *confounds.tsv, but perhaps this could help explain gross differences between your differing fmriprep and CONN results?

@burwell:

Looking at between-subject association between FD and FC is definitely important. But also complicated to interpret since both artifact and neurobiology contribute to why FC is different in subjects that move more versus those who move less. A few recent papers that discuss the complexity of motion in

  • Siegel, J.S. et al., 2017. Data quality influences observed links between functional connectivity and behavior. Cerebral Cortex , 27(9), pp.4492–4502.
  • Hodgson, K. et al., 2017. Shared genetic factors influence head motion during MRI and body mass index. Cerebral Cortex , 27(12), pp.5539–5546.

There is however a way of transforming ROI ~ 1 + FD into a way of examining validity of network edges within subjects. This is unambiguous in checking if FD (or any other QC time-series) is still associated with network edges.

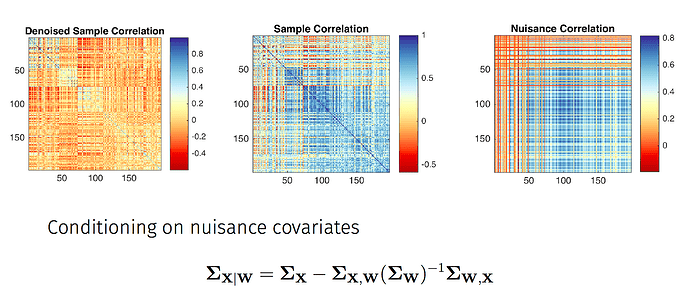
If you take a factor analysis approach to getting the FC correlation matrix you can re-think ROI/voxel level nuisance regression in terms of correlation matrices.

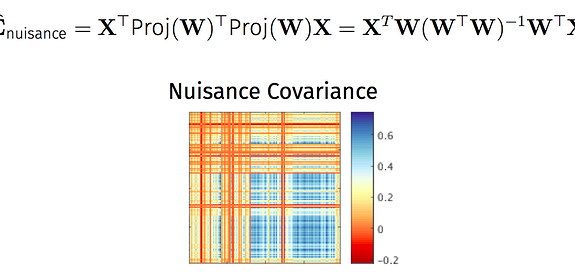
  • A = denoised covariance matrix is the covariance matrix conditional on nuisance regressors.
    (e.g. covariance between nuisance regressed ROI time-series)
  • B = non-denoised sample covariance matrix
    (e.g. covariance between non-nuisance regressed ROI time-series)
  • C = nuisance cross-covariance matrix.
    (e.g. cross-covariance based on non-nuisance regressed ROI time-series and nuisance regressors)
    The three are related as A = B - C.

Visually A, B and C might look like the following

Thus after doing nuisance regression using the various strategies you already pursue, you can then re-fit a model like as above with the framewise-displacement time-series or alternative QC measure as nuisance regressor. The nuisance correlation term would capture the extent to which something like FD-timeseries still contributes to each network edge.

Given ROI time-series X and QC time-series W, this would be

2 Likes

This is very intriguing @mnarayan, thank you for posting! Agreed, the complex relationship between motion and functional connectivity (i.e., stable and neurobiological factors underlying motion itself) is something that is not addressed yet in the plots I’ve posted, where I have primarily focused on reducing the residual association with participants’ overall motion.

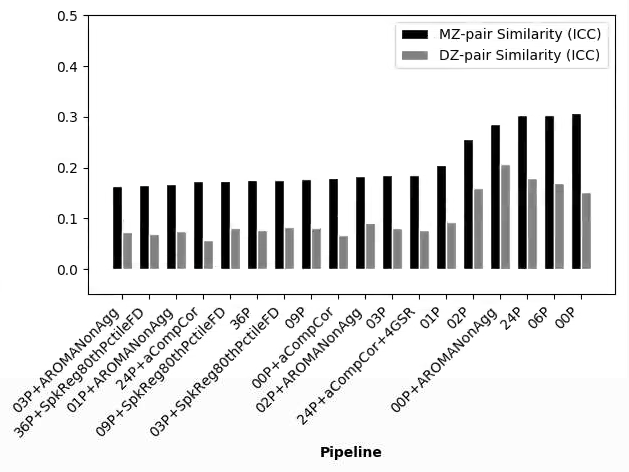
One thing I am not sure I have mentioned above is that these data are drawn from a large twin participant sample, and I originally thought I could use monozygotic (MZ) and dizygotic (DZ) twin correlations to guide my decision making on which denoising pipeline yielded a reasonable compromise by minizing QCFC-motion associations and maximizing within MZ-twin-pair similarity (considered by some a proxy for test-retest reliability).

In the below plot, bars for each pipeline illustrate the median intraclass correlation (over all edges in the entire graph) for MZ (black) and DZ (grey) twin-pairs; larger intraclass correlations indicate greater similarity in functional connectivity in twins from the same family whereas values close to zero indicate dissimilarity. If we were to believe that functional connectivity is genetically-influenced (which some publications have suggested, e.g., Adhikari et al., 2018; Ge et al., 2017; Fu et al., 2015), then the ideal denoising solution would be associated with a large median MZ intraclass correlation, and a DZ correlation that is about half the magnitude of the MZ correlation.
image
Arguably, there are 2 “modes” of MZ twin correlations: one mode with larger MZ twin intraclass correlations (~.25 to .35) captured by the 00P+AROMANonAgg, 00P, 06P, 24P denoising pipelines, and another mode of smaller MZ twin intraclass correlations (~.15 to .20) captured by the other pipelines. In other words, the “worse-performing” denoising strategies in terms of minimizing motion effects (i.e., 00P, 06P, etc.) were associated with the “best” MZ twin correlations, whereas the “best-performing” denoising strategies in terms of minimizing motion effects (e.g., 03P+AROMA, 36P+SpkReg) were associated with the “worst” MZ twin correlations.

My suspicion is that while effective denoising can minimize the association between QCFC and overall subject motion, it appears to also remove something that is non-artifactual (e.g., neurobiological, genetically-influenced) in the data. Your proposed solution may be useful to get to the bottom of this issue. I will work to implement your suggested model over the next week or so and hopefully have results to follow-up.

We added in the cosine regressors, and to reduce variability (and worries about how the CompCor and ICA-AROMA code may or may not be handling those first non-steady state frames), we remove four frames from our fMRI data before passing it to fMRIprep. Not ideal, but still trying to figure out best practices, same as you. I think part of the difference between CONN CompCor and fmriprep CompCor is the use of a combined mask in fmriprep
(I honestly think this is not in-line with what the CompCor authors had intended. @effigies Is there a reason it is set up that way here?)

IIRC, the CompCor authors detrended the BOLD series prior to computing CompCor. The regressors would then only make sense on the detrended series. Because we don’t detrend our output BOLD series, we needed to provide the same HPF basis for anybody who wished to use them. Almost all of our discussions are in the GitHub issues, so I’ll try to look it up to verify this was the reasoning in the morning. I’ll note that it is entirely possible that we misinterpreted the original paper.

2 Likes

I think my question was more related to the use of one versus two regions for CSF and WM, rather than the cosines inclusion. Unless I am misunderstanding your response?

1 Like

Thanks for the further explanations, @alexlicohen and @effigies

FWIW, I think the use of combined CSF/WM regions (rather than separate regions) in fmiprep’s implementation of aCompCor has to do with difficulties reliably estimating the CSF region for all subjects, per @ChrisGorgolewski’s comment in this post: aCompCor only for white matter and not for CSF?

1 Like

Ah, sorry, I misunderstood. With regard to that, I believe @rastko is currently working toward additionally producing CompCor series for WM and CSF, but the latter will be subject to the same limitations as a CSF signal. I believe the plan would be to return a column of nans in the case of an empty mask (please correct me if I’m wrong), so there would be a reliable condition you could check for in further analysis stages.

2 Likes

As this topic hasn’t been updated for quite a while, I wonder if there’s any latest developments that lead to a wider accepted approach. Being a PhD student myself, I feel really lost in which approach I may need to choose for the functional connectivity analysis of my pre-processed fMRIs.

Considering @burwell 's post, I would expect this to be the output of fmriprep+AROMANonAgg+00P (that is highpass filter cosine functions, non-steady state outlier TR)?

From the discussion I understand that there’s no consensus but any pointers or tips would be greatly appreciated. If that helps, I am pre-processing the ABIDE I and ABIDE II data.