Greetings,
I am testing the effects of various pre-processing “noise model” regressors (columns in the *_confounds.tsv from fmriprep) on rsfMRI connectivity’s association with motion (mean Framewise Displacement, in the *_confounds.tsv) on a dataset of ~325 young adults scanned on the same Prisma scanner. To do the noise model regression, I am using AFNI’s 3dTproject (in nipype), which affords simplicity in that it allows for regressing out “noise” time-series, censoring (…zeroing, or interpolating artifact TRs), regressing out trends, and smoothing. All denoising was conducted on the *_preproc.nii.gz output from fmriprep unless otherwise specified with an asterisk.
The noise models are defined below (* = uses the ICA-AROMA non-aggressive output)
0P = the “base” model (all other models contain these regressors): 6mm FWHM smoothing, first 5 TRs censored, 0th, 1st, and 2nd order detrending
1P = regression of GlobalSignal time-series
2P = regression of White Matter and CSF time-series
3P = 1P and 2P regressors
6P = regression of realignment parameters
9P = 3P and 6P regressors
24P = 6P regressors, their first derivatives, and quadratic terms of these
36P = 9P regressors, their first derivatives, and quadratic terms of these
aCC5 = aCompCor first 5 principal dimensions as regressors
tCC5 = tCompCor first 5 principal dimensions as regressors
aroma* = non-aggressive ICA-AROMA output, and 0P “base model”
aggaroma = “aggressive” ICA-AROMA regression conducted on 0P “base model”
spk3sd = spike regression
spk3md = spike regression, different threshold
12P+aCC5 = aCompCor5, 6P and their first derivatives (Chai et al., 2012)
36P+spk3sd = 36P and spike regression (Satterhwaite et al., 2013)
02P+aroma* = non-aggressive ICA-AROMA output, and 2P model regression (Pruim et al., 2015)
03P+aroma* = non-aggressive ICA-AROMA output, and 3P model regression (Burgess et al., 2016)
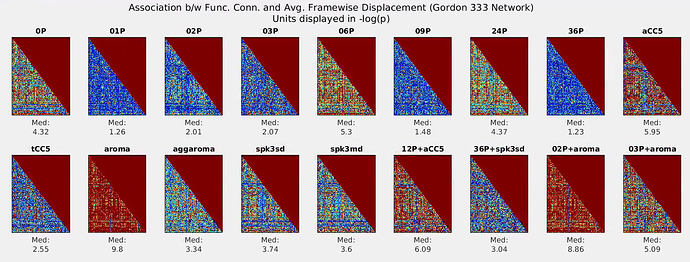
For each edge within a commonly used functional atlas (Gordon et al., 2016), I conducted linear regressions to examine the strength between functional connectivity strength (z-transformed temporal correlation coefficient) and subject movement in the scanner (mean Frame-wise Displacement output by fmriprep), and plotted absolute associations in the graphs below. Here, the association with motion is reflected in -log(p-value) and graph color scales range from -log(p=1.0) [blue] to -log(p=.0005) [red], so smaller/bluer values reflect less of an effect of motion (better). The median -log(p-value) is also presented below each graph.
My concern (and the reason for this posting) is that regression of some noise models seem to give especially poor results, particularly for when ICA-AROMA is used (see graphs labeled “aroma”, “02P+aroma”). The median association with motion is ~2x that of the 0P (“base model”). This is surprising to me, given that the number of “motion artifact” components identified by ICA-AROMA is typically much larger than even 36P. Overall, the full 36P regression had the least association with motion, but interestingly, a single Global Signal regressor seems to perform just as well.
I am curious if anyone has insight into this apparent disconnect in reasoning? Shouldn’t models that have regressed out more “motion”/“noise” variables as a result have less of an association with Frame-wise Displacement? Am I using the non-aggressive ICA-AROMA output correctly? Any suggestions would be helpful, as I have looked over my code a few times and cannot find any obvious mistakes.
Best,
Scott


