Summary of what happened:
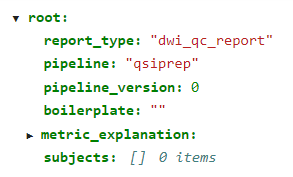
when I use qsirecon, and it produced the expected reconstructions and reported no errors. However, the figures directory is empty, the dwiqc.json has no subject item and the report is pretty sad looking without any figures.
Command used (and if a helper script was used, a link to the helper script or the command generated):
singularity run --cleanenv --bind ~/Dataset/Norm/CHCP_Tract/result:/data \
--bind ~/Dataset/Norm/CHCP_Tract/tractography:/output \
--bind ~/Dataset/Norm/CHCP_Tract/preprocessed/qsiprep:/input \
--bind ~/Dataset/Norm/CHCP_Tract/license.txt:/opt/license.txt \
--bind ~/code/CHCP_DiffusionTract/work:/work \
--bind ~/Dataset/Norm/CHCP_Tract/atlases:/atlases \
~/App/singularity/qsiprep_0.21.4.sif /data/ /output/ participant \
--participant-label sub-3001 \
--work_dir /work/ \
--output-resolution 1.2 \
--recon_input /input/ \
--recon-only --recon_spec /atlases/gqi_scalar_export.json \
--fs-license-file /opt/license.txt \
--stop_on_first_crash -v -v
Version:
0.21.4
Environment (Docker, Singularity / Apptainer, custom installation):
Singularity
Recon input layout
├── dataset_description.json
├── dwiqc.json
├── logs
│   ├── CITATION.html
│   ├── CITATION.md
│   └── CITATION.tex
├── sub-3001
│   ├── anat
│   │   ├── sub-3001_desc-aseg_dseg.nii.gz
│   │   ├── sub-3001_desc-brain_mask.nii.gz
│   │   ├── sub-3001_desc-preproc_T1w.nii.gz
│   │   ├── sub-3001_dseg.nii.gz
│   │   ├── sub-3001_from-MNI152NLin2009cAsym_to-T1w_mode-image_xfm.h5
│   │   ├── sub-3001_from-T1wACPC_to-T1wNative_mode-image_xfm.mat
│   │   ├── sub-3001_from-T1wNative_to-T1wACPC_mode-image_xfm.mat
│   │   └── sub-3001_from-T1w_to-MNI152NLin2009cAsym_mode-image_xfm.h5
│   ├── figures
│   │   ├── sub-3001_seg_brainmask.svg
│   │   ├── sub-3001_ses-dwi_carpetplot.svg
│   │   ├── sub-3001_ses-dwi_coreg.svg
│   │   ├── sub-3001_ses-dwi_desc-resampled_b0ref.svg
│   │   ├── sub-3001_ses-dwi_dir-98_dwi_denoise_ses_dwi_dir_98_dwi_wf_denoising.svg
│   │   ├── sub-3001_ses-dwi_dir-99_dwi_denoise_ses_dwi_dir_99_dwi_wf_denoising.svg
│   │   ├── sub-3001_ses-dwi_final_denoise_wf_biascorr.svg
│   │   ├── sub-3001_ses-dwi_sampling_scheme.gif
│   │   └── sub-3001_t1_2_mni.svg
│   ├── ses-anat
│   │   └── anat
│   │       └── sub-3001_ses-anat_from-orig_to-T1w_mode-image_xfm.txt
│   └── ses-dwi
│       └── dwi
│           ├── sub-3001_ses-dwi_confounds.tsv
│           ├── sub-3001_ses-dwi_desc-ImageQC_dwi.csv
│           ├── sub-3001_ses-dwi_desc-SliceQC_dwi.json
│           ├── sub-3001_ses-dwi_dwiqc.json
│           ├── sub-3001_ses-dwi_space-T1w_desc-brain_mask.nii.gz
│           ├── sub-3001_ses-dwi_space-T1w_desc-eddy_cnr.nii.gz
│           ├── sub-3001_ses-dwi_space-T1w_desc-preproc_dwi.b
│           ├── sub-3001_ses-dwi_space-T1w_desc-preproc_dwi.bval
│           ├── sub-3001_ses-dwi_space-T1w_desc-preproc_dwi.bvec
│           ├── sub-3001_ses-dwi_space-T1w_desc-preproc_dwi.nii.gz
│           ├── sub-3001_ses-dwi_space-T1w_desc-preproc_dwi.txt
│           └── sub-3001_ses-dwi_space-T1w_dwiref.nii.gz
├── sub-3001.html
Recon output layout:
├── dataset_description.json
├── dwiqc.json
├── logs
│   ├── CITATION.html
│   ├── CITATION.md
│   └── CITATION.tex
├── sub-3001
│   └── figures
└── sub-3001.html
Relevant information:
dwiqc.json:

