Dear Community,
In our latest data collection wave (Batch 4), T1-weighted images look darker and the intensity is inhomogeneous once converted to NIfTI, despite appearing almost normal in the raw DICOM viewer. Earlier batches from the same scanner (Batch 1-3) do not show this problem.
Our scanner is a Siemens 3 T that was upgraded in 2018 from a single-channel CP head coil (pre-XA software) to the current XA30 platform with a 64-channel head/neck array. A quick pilot scan revealed that enabling “Prescan Normalize” in the vendor’s Resolution → Filter menu restores normal contrast, suggesting the issue stems from that setting being OFF for Batch 4.
Key Symptoms from MRI quality checking
- fMRIPrep 23.0.0 – recon-all aborts at Talairach (talairach_afd p < 0.005) → ~10 subjects
- FreeSurfer 7.3.x – watershed error (“few WM voxels value 110”) → several
- CAT12 – low QC grades even after bias-field correction → many
- FSL VBM – GM segmentation fails (overall low intensity) → many
- AFNI QC – SNR numerically OK, but anatomy visibly dark compared to other protocols → most
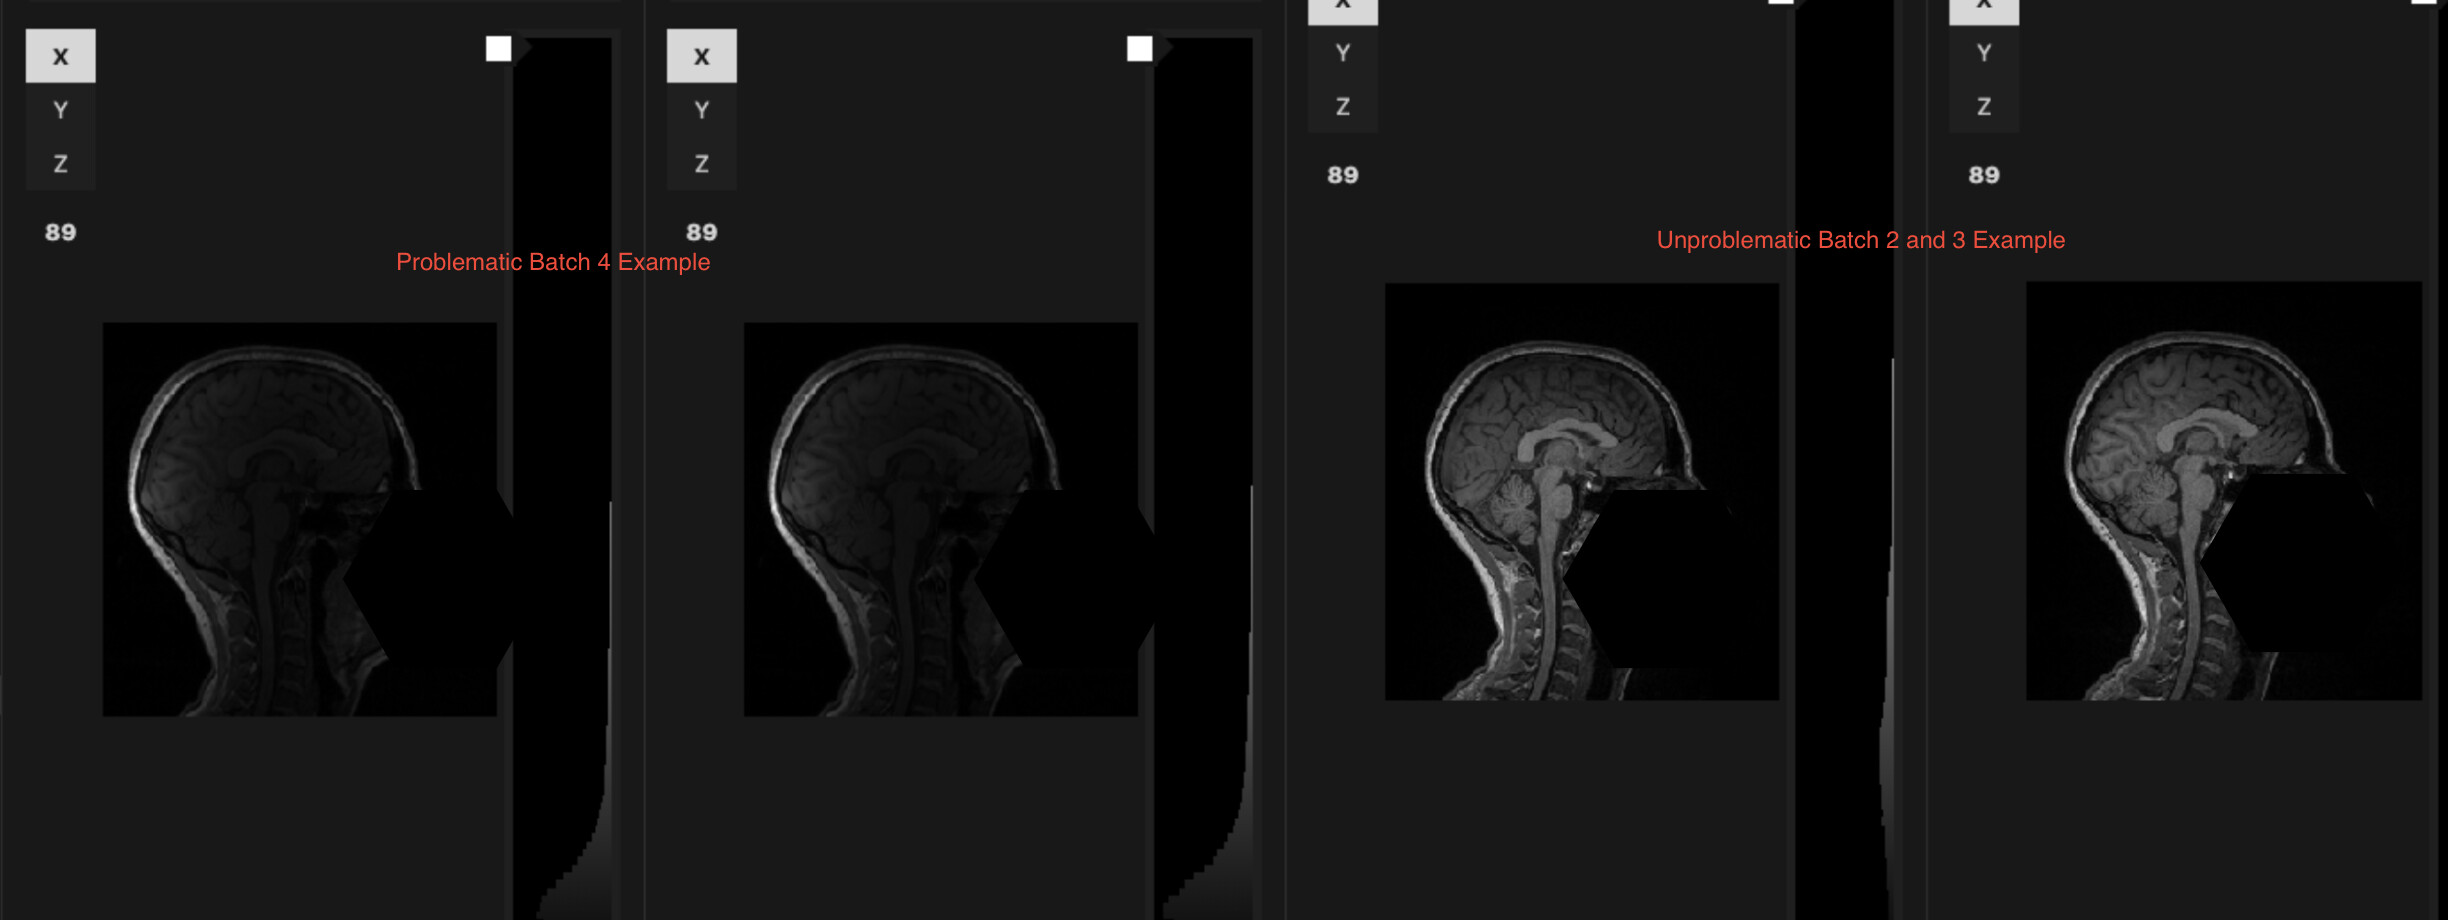
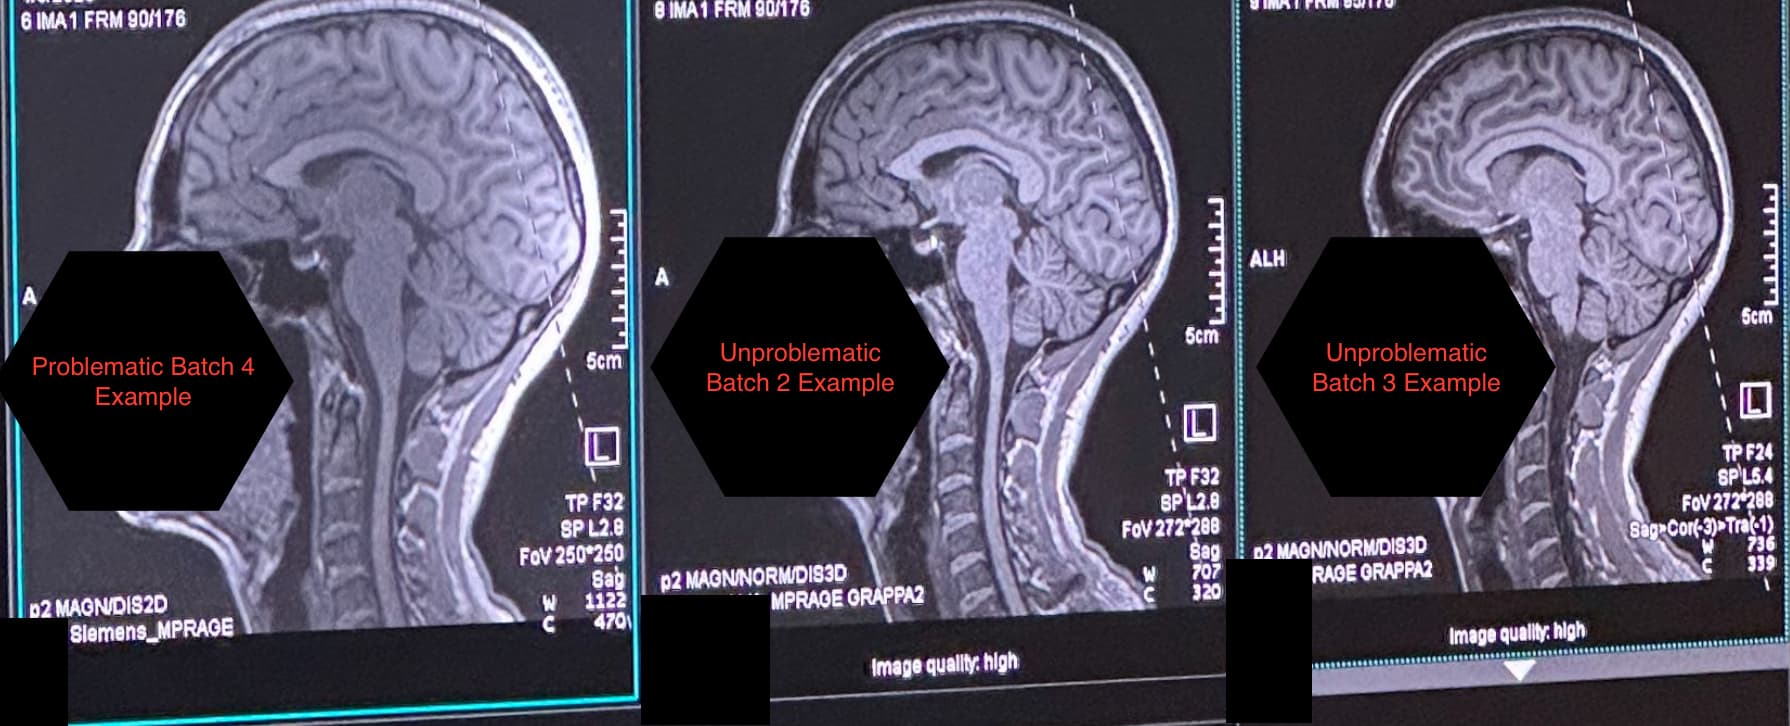
Visual comparison (see attachments):
- “Problem” T1 NIfTI vs. “Typical” T1 from earlier batches
- Raw DICOM screenshots – slight but noticeable contrast loss
Acquisition Details
- 3T Siemens TIM Trio scanner and a 64-channel phased-array head coil
- software version updated in 2018
- 1 mm isotropic MPRAGE-type sequence
- Coil-combine method: Adaptive
- Prescan Normalize was OFF for Batch 4, ON for previous batches
- Conversion: dcm2niix (2024-02-02) for Batch 4; earlier batches converted with a 2023 build.
Troubleshooting Performed
- Bias-field correction (ANTS N4 & FSL restore) – modest brightening; However, the brain segmentation didn’t work well and FreeSurfer still produced extremely low or high values for subcortical volume, cortical thickness, and surface area in problematic scans.
- Re-conversion with alternate dcm2niix options – no change.
- New pilot scan with Prescan Normalize ON – intensity normal; processes fine.
- Running fMRIPrep without surfaces (–fs-no-reconall) – works, but anatomical still dark and affects EPI→T1 co-registration quality.
Questions
- Is there any post-hoc method to replicate the vendor’s Prescan Normalize on existing NIfTIs?
- How much residual bias is acceptable before it starts impacting our functional data? We would be grateful for recommendations for co-registration settings in fMRIprep or other software.
- Recommended workflows to rescue these scans (stronger N4? SynthStrip uniformization? mri_robust_template for Talairach?)
- Practical exclusion criteria – e.g., CAT12 QC threshold or WM/GM contrast ratio – that others use to decide when to drop subjects vs. keep them.
- If we keep them, is it safer to skip surface-based analyses?
Any guidance on automated fixes, quality thresholds, or decision rules would be greatly appreciated.
Thank you!