Dear experts,
Hello! I am currently using nilearn for MVPA analysis to distinguish which brain regions represent word properties. However, I’ve encountered a confusing issue and need your assistance.
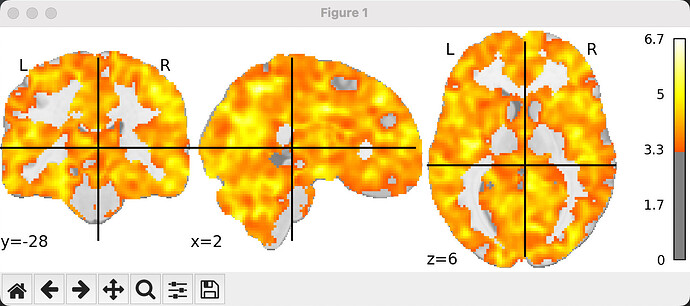
Following the official nilearn tutorials, I extracted the beta maps for all of my trials using LSA (a similar procedure was used in RSA, yielding results akin to previous studies). Then, I conducted a whole-brain searchlight analysis using the SVM classifier with class_weight='balanced' to account for the differences in the number of trials, iterating 2000 times with L2 penalty. I used LeaveOneGroupOut based on the runs to obtain decoding accuracy. However, during second-level analysis, I found decoding accuracy above the chance level (0.5) across almost the entire brain, which is puzzling. Is this a normal occurrence?
This is the result image of the second-level analysis with a cluster threshold of 50, height control set to ‘fdr’, and alpha at 0.001.
Could the presence of this situation be due to an incorrect second-level analysis? I processed the decoding accuracy maps registered to the standard space using ants with the following code: image_data = math_img("np.maximum(img - 0.5, 0)", img=image.load_img(second_level_inputs[img])). For the second-level analysis, I then entered these processed data with a design matrix of [1]*n_subject and contrast matrix of [1].
Here is the code for my second-level analysis:
folder_path = '/Users/caofeizhen/Desktop/pos_and_composition/fMRI_data/fmri/RawData/derivatives/mvpa_glm/searchlight_nv_task_iter1000/Picture'
os.chdir(folder_path)
second_level_inputs = glob.glob('*.nii')
n_subjects = 13
design_matrix=pd.read_excel('/Users/caofeizhen/Desktop/pos_and_composition/fMRI_data/fmri/RawData/derivatives/mvpa_glm/searchlight_名动-任务_迭代20000/Word/design_matrix.xlsx',header=None)

#%%

second_level_model_paired = SecondLevelModel(smoothing_fwhm=4).fit(second_level_inputs, design_matrix=design_matrix)
plot_design_matrix(second_level_model_paired.design_matrix_)
stat_maps_paired = second_level_model_paired.compute_contrast([1], output_type="all")


#%%
cluster_threshold = 50
height_control = 'fdr'
alpha = 0.001

# Load MNI template
gm_target = '/Users/caofeizhen/.cache/templateflow/tpl-MNI152NLin2009cAsym/tpl-MNI152NLin2009cAsym_res-02_label-GM_probseg.nii.gz'
gm_target_img = check_niimg(gm_target)
gm_target_data = get_data(gm_target_img)

gm_target_mask = (gm_target_data > 0.2).astype("int8")

gm_target_mask = binary_closing(gm_target_mask, iterations=2)
gm_mask_img = new_img_like(gm_target_img, gm_target_mask)

clean_map, threshold = threshold_stats_img(stat_maps_paired['z_score'], alpha=alpha, height_control=height_control, cluster_threshold=cluster_threshold, two_sided=True,mask_img = gm_mask_img)
plotting.plot_stat_map(clean_map,threshold=threshold,colorbar=True)
plotting.show()
Could you please offer some guidance? Thank you in advance for your help. I have learned a lot from this forum and always recommend it to other researchers I know.
