We are using fmriprep 21.0.1 to process fMRI data acquired on a Siemens Skyra using the CMRR mb sequence.
The AP SE distortion maps have PhaseEncodingDirection": “j-” and PA “PhaseEncodingDirection”: “j” in the json sidecars. The 3 functional runs and their _sbref images are supposed to be AP and have “PhaseEncodingDirection”: “j-”, which seems right to me.
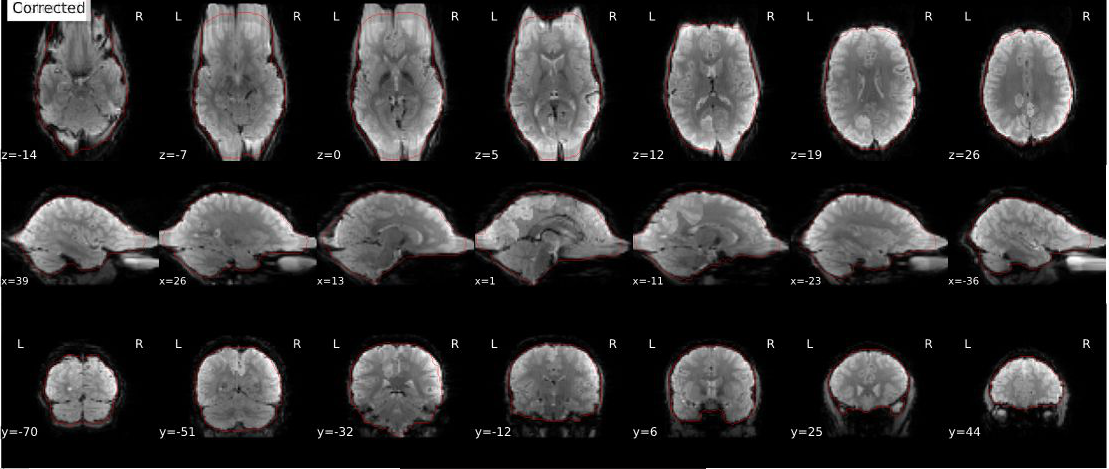
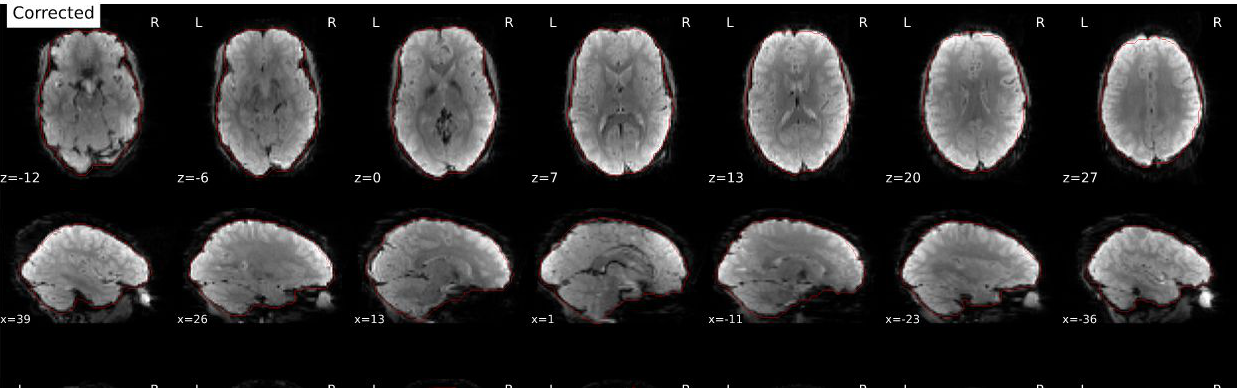
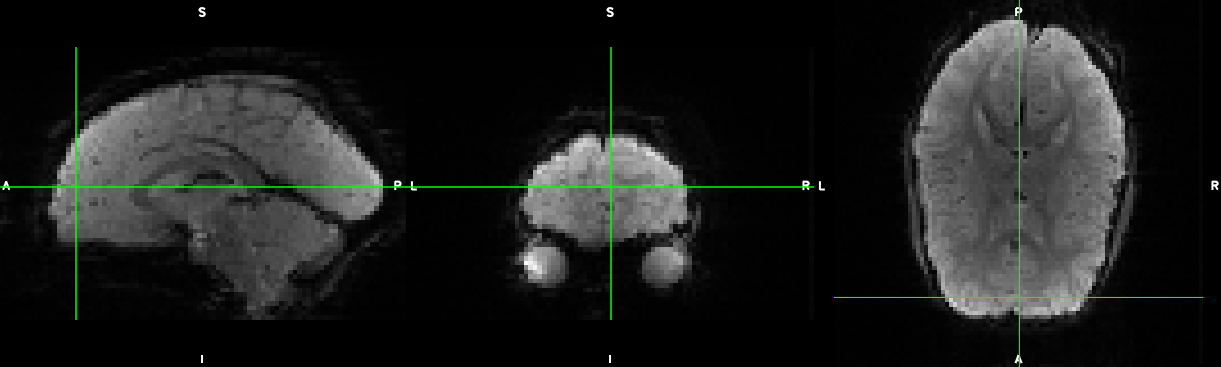
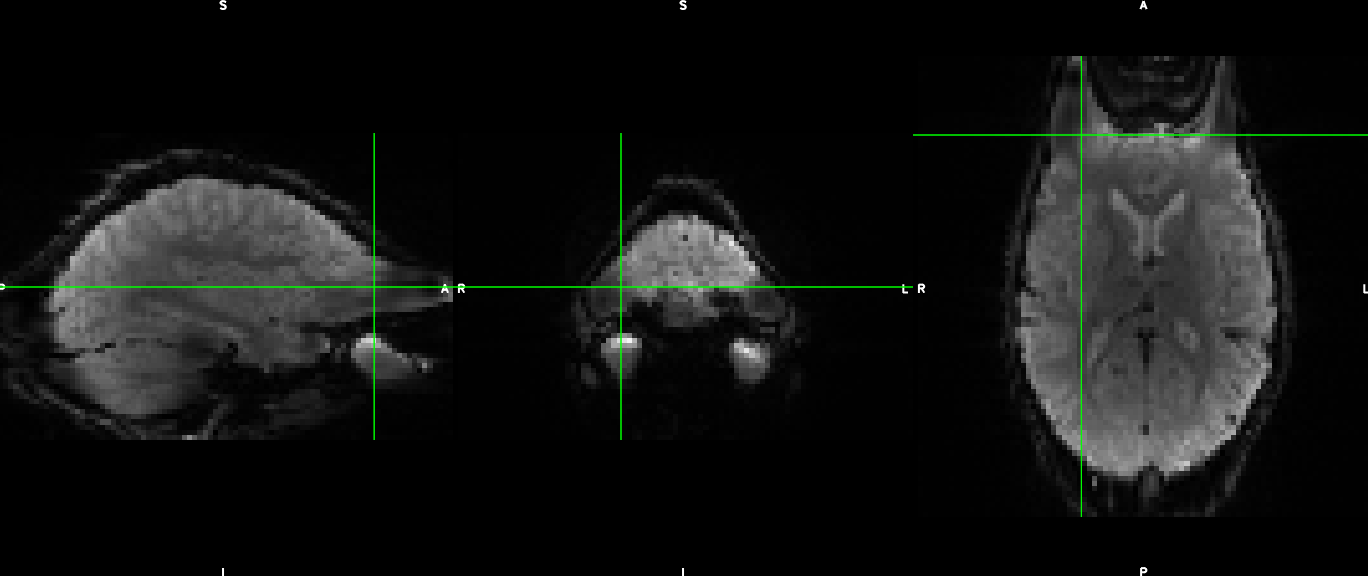
However, the results of SDC are completely peculiar after running fmriprep (image 1 below) and we can only get reasonable-looking SDC (image 2 below) by switching j- to j and vice versa in the SE distortion map jsons and leave the bold runs as j-. Can anyone help us understand what is going on
This seems strange. Could you check that the SE-EPI images in AP looks with similar distorsions than the bold images in AP?
Which software do you use to convert from DICOM to NIFTI images and get the JSON images?
As far as I know, “j” and “j-” refers to the second axis of the image data without indicating whether it is AP or PA. To understand how it maps to the brain orientation within the scanner, you might need to use the transformation matrix that it stored in header which maps the data array to the scanner space.
All this reminds me of an issue I had once years ago, I vaguely remember that somehow the coverage was flipped and data array was storing the voxels in reversed order, changing the mapping of j and j- to AP and PA.
This looks like a real mystery! We are also using a Siemens scanner with the CMRR sequence and I never encountered this kind of issue. Which Syngo version do you have on your Siemens Skyra?
How do you reverse the phase encoding direction at the scanner to go from AP to PA:
Do you do it in the “Routine” tab by adding or removing 180° in the Phase Encoding Direction value?
Do you use the “Sequence>Special” tab where one can check a box to flip both phase and readout polarity?
I guess you checked that all the images (bold and SE_EPI) are in LAS orientation?
If you could, you could try to run FSL-topup yourself to see if you can make sense of this?
This is the issue I was referring/remembering in my previous answer. I think there is a combination of these phase encoding direction changing options that results in j being mapped to AP instead if PA. At least I remember encountering this issue once.
We use the RO/PE checkbox on the Special tab
I did check the bold and SE are in the same orientation
I tried running topup and had to use --inindex =2 in applytopup to make the correction look “correct” (no matter which way around I specified the phase encoding in the topup acquisition_parameters.txt file). I’ll check this again because I don’t think I understand.
Quite possible we are doing something weird but I’m not sure what…
and your acquisition_parameters.txt file would look like this:
0 -1 0 totalreadouttime
0 1 0 totalreadouttime
Then, you would run topup with --imain=AP_PA.nii.gz
And in applytopup you would use --inindex =1 to apply the field coefficients calculated by topup to bold images with phase encoding direction in AP, or --inindex =2 to bold images with phase encoding direction in PA.
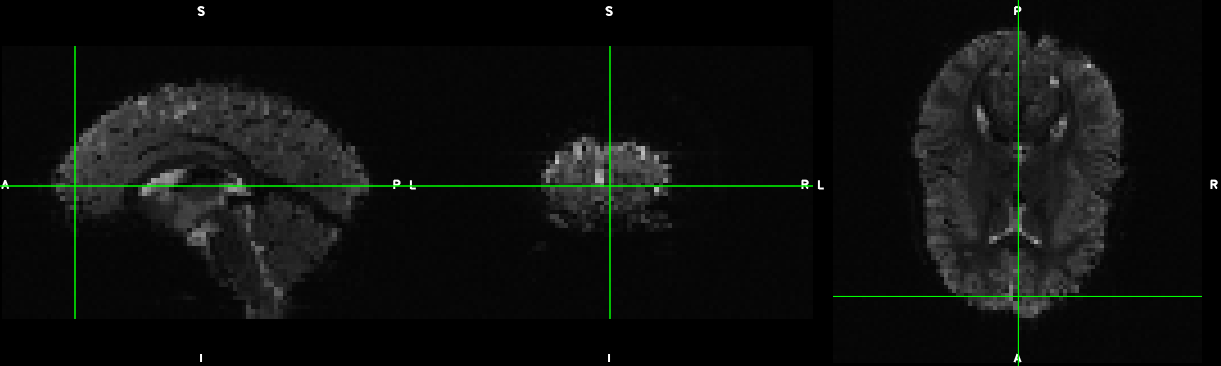
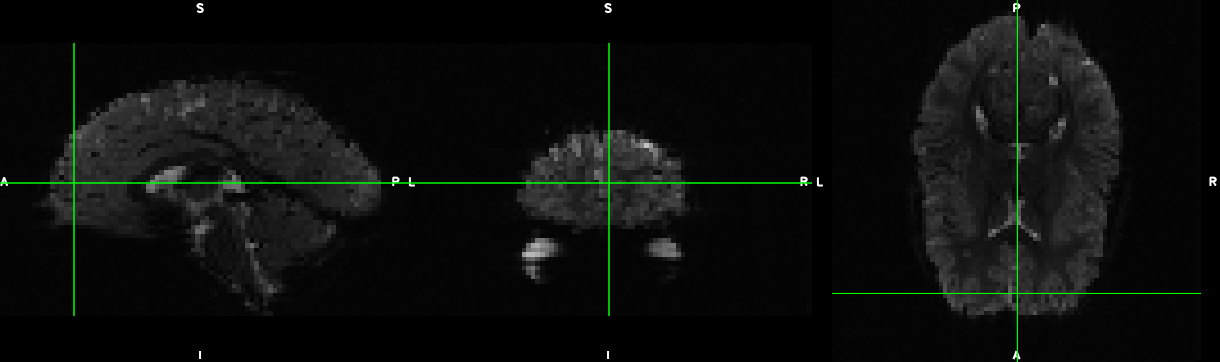
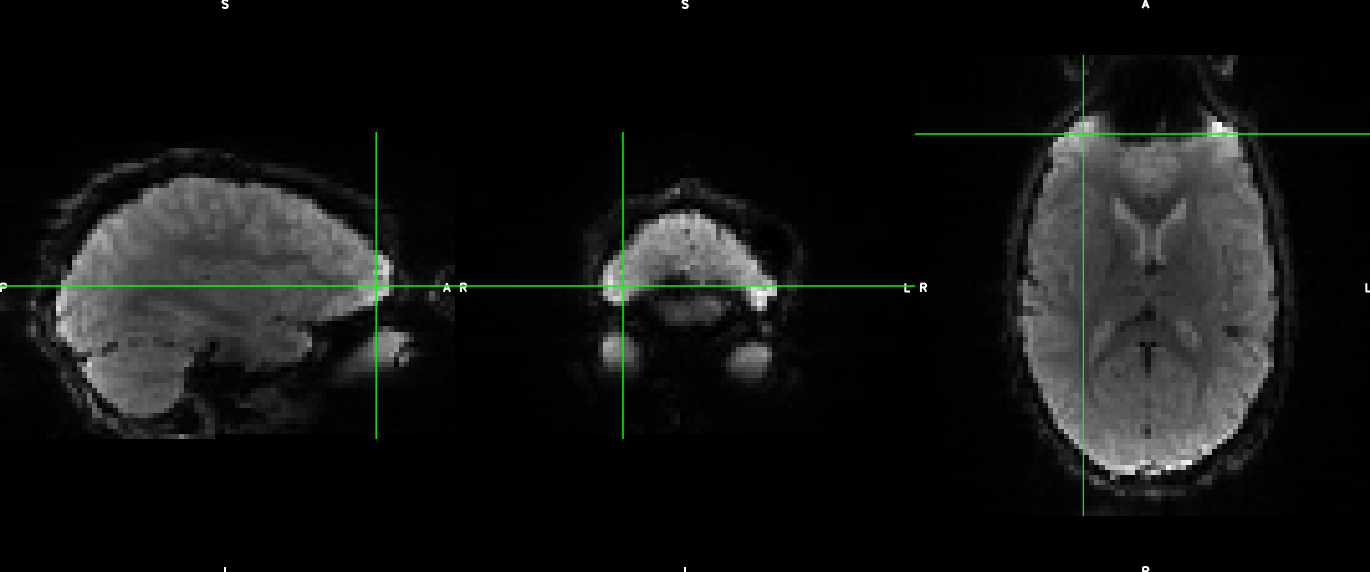
I did another subject with topup. Images below are 1) original and 2) images after applytopup with --inindex=1 (theoretically correct since my bold images claim to be AP) and 3) with inindex==2
Very strange. I tend to prefer the original over the 2 corrected versions, for instance the eyes look like spheres on the image 1 as they should be while they are obviously deformed in image 2 but also image 3. But image 3 looks obviously much better than image 2 even though the fat around the skull looks very deformed in the frontal area in image 3. Do the functional images and the SE distorsion maps have the same TotalReadoutTime ?
Which version of dcm2niix are you using?
Interesting. Thank you for catching this. Actually topup should work the same way with GE AP-PA images. The difference between those two sequences (SE-EPI vs GRE-EPI) is that you have different image intensities (T2w vs T2*w contrast) and more importantly more dropout on GRE-EPI images than on SE-EPI images. There are some papers comparing SDC with GE AP-PA images instead of SE AP-PA and there is a debate on which one gives best results.
What strikes me then on your story is that on your first post, the images comparing SE (but apparently it was GE-EPI images) and BOLD images (your second post on this thread) show a huge intensity difference between those images. If there are coming from the same sequence (GRE-EPI), what parameters differ to produce with huge intensity changes?
Yes, the TE on the AP-PA images is 80ms - which would have been appropriate had they been T2w, but of course makes the dropout worse than the BOLD images - this could be why topup has such a strange effect?
It is for sure not ideal to have enhanced T2*w dropout with long TE. However topup should still be able to measure the correct displacement field induced by the susceptibility differences comparing AP and PA images with similar characteristics (like are your AP and PA GRE-EPI fieldmap images with TE=80ms.)
Could you check how is the fieldmap calculated by topup? Perhaps the dropout is confusing topup during its estimation and it is overestimating the displacement field, this would explain the huge deformation applied to the corrected bold images.